
Abstract
BACKGROUND:
Honey, a product of the beehive with high nutritional and taste value, is a food much appreciated by consumers for its nutritional value and therapeutic properties such as antioxidant, anti-inflammatory and antibacterial properties.
OBJECTIVE:
The main objectives of this work are to evaluate the quality of Algerian honeys, their chemical composition, their antioxidant, anti-inflammatory and anti-browning enzyme activities, and to confirm the qualitative superiority of local honeys over imported honeys.
METHODS:
Six local and imported honeys are analyzed for their physicochemical parameters, floral origin, phenolic compound content and in vitro antioxidant and anti-inflammatory activities. The enzymatic browning inhibitory power of Algerian honeys is also tested.
RESULTS:
The pollen study shows that the four local honeys were of monofloral origin, while the two imported honeys are pollen-free. Local and imported honeys are compared on 17 physico-chemical and biological parameters. The results reveal that single-flower honeys generally meet international standards in terms of HMF and proline content, unlike imported honeys. These honeys have lower antioxidant levels than other honeys: polyphenols (161 to 248 mg GAE/100 g) and flavonoids (64 to 74 mg QE/100 g). There is a correlation between honey color, antioxidant contents and biological activities.
CONCLUSION:
Darker Algerian honeys have higher antioxidant content and better biological properties than others samples.
Keywords
Introduction
Since ancient times, there has been a relationship between Homo sapiens and the honey-producing bee. The latter is an important natural product that is among the most popular products. Honey consists of a complex solution highly concentrated in sugar and it is composed of macro and micronutrients that attribute the nutritional and therapeutic properties (antioxidant, healing, antimicrobial, anti-inflammatory, anticancer and anti-tumor) to this product [1]. These multiple properties are linked to the richness of honey in bioactive compounds, mainly phenolics [2]. Also, another interesting property of honey in the food industry is the inhibition of enzymatic browning. The latter is a problem of minimally processed foods such as fruits, vegetables and fruit juices [3]. Generally, it is caused by the enzyme polyphenol oxidase (PPO) [4]. The works of [5] reported that enzymatic browning of apple is due to the oxidation of its phenolic compounds. The latter are bound in a vacuole by a tonoplast (a lipoprotein membrane), while the PPO are found in the chloroplasts as well as the cell walls. As soon as physical stress (cutting, peeling, etc.) or aging stress is introduced into the apple, the cells of reactive oxygen species (ROS) therefore rupture the lipoprotein membrane and the PPO interact directly with the released phenolic substrates, which causes the appearance of a brown color and therefore reduces the nutritional and taste qualities [3].
According to the research work of [6] and [7], honey has a power of inhibition of enzymatic browning caused by PPO on apple slices. [8] examined the effect of honey and citric acid treatments on the postharvest quality of fresh guava fruit and pieces and recommended combining honey (15%) with citric acid (2%) so that the guava fruits maintain their quality during storage, while [9] have recommended the use of 35% bee honey for best results. [10] concluded that honey was the best natural inhibitor to prevent enzymatic browning in sweet potato. This power essentially depends on the type of honey and its content of antioxidant compounds.
Algeria is a vast country endowed with a very diversified flora allowing a qualitative and quantitative production of honey [11]. According to the to the Institut Technique des Elevage (ITELV) [12] honey production is on average 74,420 quintals/year with an 85% growth recorded over the last ten years. In 2019, Algeria contributed 0.3% to global honey production. These percentages remain low despite its very varied natural capacities which could develop national production and avoid imports of this food [13]. In order to reduce the risk of fraud and to preserve the quality of honey, the International Honey Commission has established certain standards for physicochemical parameters such as humidity, pH, electrical conductivity as well as the level of hydroxymethylfurfural (HMF) and of proline [14]. There are many imported honeys sold at low prices in supermarkets and to verify their similarity in terms of chemical composition and biological properties with Algerian honeys, the present study aimed to authenticate the botanical origin of honey by performing a melissopalynology analysis, determining the physico-chemical properties, the bioactive composition and the antioxidant and anti-inflammatory activities.
Also, due to the lack of research on the inhibition of enzymatic browning of Algerian honeys, this study aims to investigate the efficacy of Algerian honeys in inhibiting enzymatic browning of apple slices. This work can help assess the quality of Algerian honeys, verify their compliance with Codex Alimentarius Commission and European Commission standards, as well as characterize Algerian honey types, compare them with national and international standards, and determine their potency enzymatic anti-browning on apple slices.
Material and methods
Samples
Six honey samples, four of which were local, such as Bejaia and Tizi-Ouzou in Algeria, and two imported (Table 1). Six apples, with an average weight of 100 g/apple, were purchased from a store in Bejaia. The honeys were stored at room temperature, protected from light and humidity, and the apples were purchased on the day of analysis.
Pollen spectra of honey samples
Pollen spectra of honey samples
In order to understand the relationship between the bee and the plant, pollen analysis was carried out using the method described by [15]. Pollen grains were identified using an optical microscope (Zeiss Axiolab, Göttingen, Germany) with a G×40 objective, with reference to the digital databases of the Centre d’Etudes Techniques Apicoles de Moselle (CETAM).
Physico-chemical parameters
Water content and Brix, pH, electrical conductivity, HMF and proline parameters were determined using the methods of [14]. Honey color intensity was determined using the method of [16]. Protein content was determined by the method of [17]. Results were expressed as mg bovine serum albumin equivalent (BSAE)/100 g (y = 0.904 × –0.0936; R2 = 0.9932).
Antioxidant content
Polyphenol content was determined using the method demonstrated by [18] and flavonoid content was determined using the method of [14]. Results were expressed as mg gallic acid equivalent (GAE)/100 g using the gallic acid standard curve (y = 3.71 x + 0.06; R2 = 0.9891) and mg quercitin equivalent (QE)/100 g using the quercetin standard curve (y = 0.368 x + 0.0014; R2 = 0.9867), respectively.
Antioxidant activities
The ability of honey antioxidants to reduce the 2,2-diphenyl-1-picrylhydrazyl radical (DPPH) was assessed using the method of [19]. The 2,2’-azino-bis (3-ethylbenzothiazoline-6-sulfonic acid) (ABTS) test was carried out according to the method described by [20]. The reducing power test was performed according to the method described by [21], with results expressed as mg GAE/100 g using the standard gallic acid curve (y = 1.6825 x –0.349; R2 = 0.9904). The ferric reducing antioxidant power (FRAP) test was performed using the method of [22] and results were expressed as mg GAE/100 g (y = 5.655 x + 0.1217; R2 = 0.9953). The ferrozine test was performed according to the method described by [23]. The copper-reducing antioxidant capacity (CUPRAC) test was performed according to the method of [24] and results were expressed as mg GAE/100 g (y = 15.27 x + 0.0305; R2 = 0.9967). The phosphomolybdate test was performed according to the method of [25] and results were expressed as mg GAE/100 g with reference to the gallic acid calibration curve (y = 3.695 × –0.0035; R2 = 0.9979).
Anti-inflammatory activity
According to [26], three solutions of different concentrations (0.5, 1 and 2 mg/mL) of honey were prepared and a volume of 500μL of BSA solution (0.2% ; w/v) prepared in Tris- HCl buffer solution (pH = 6.6) was transferred to a test tube. A control was prepared with 1 mL of 0.2% w/v BSA solution with 1 mL of Tris-HCl solution (pH = 6.6), also a blank was prepared with 500μL of honey solution and 500μL of Tris-HCl buffer. Next, the test tubes underwent a double incubation, the first at 37°C for 15 min followed by a second in a water bath at 72°C for 5 min. Absorbance was read at 660 nm after cooling, and results were expressed according to the following formula:
With: As: Sample absorbance. Ab: Absorbance of the blank. Ac: Absorbance of the control (1 mL of BSA solution with 1 mL of Tris-HCl solution).
Enzymatic anti-browning activity
The inhibitory power of enzymatic browning was tested using the method described by [6]. Four apple slices (0.5 cm in diameter) were immersed in a 10% honey solution, while control apple slices were immersed in distilled water. After 30 min, the treated slices were wiped dry and placed in Petri dishes. Observation was carried out with the naked eye at 30 and 4°C for: 30 min, 1 h, 2 h, 16 h, 24 h, 48 h and 72 h. The optical density of apple samples was measured at 420 nm after centrifugation at 1200 rpm for 5 min. Results were expressed in browning units (1 browning unit (BU) represents a 0.01 change in absorbance).
Statistical analysis
Three trials were carried out for each test. Results were calculated with Microsoft Office Excel 2007 and presented as mean±standard deviation. The ANOVA test (analysis of variance with a single classification criterion) and the correlation matrix were applied using STATISTICA 7.1.2 software. Results were ranked in descending order. A principal component analysis (PCA) was performed to study the similarity between the different honey samples and the links between the variables.
Results and discussion
Pollen analysis
A natural honey contains several types of pollen grains in suspension and their absence makes it possible to suspect falsification or that it is really invert sugar. Pollen analysis is the quantitative and qualitative study of the pollen grains contained in honey [27]. The results of the pollen analysis reveal the presence of four samples of monofloral honeys (honeys H1 and H3 are from the Fabaceae family; H2 and H4 are part of the Fagaceae). A total of 12 pollen families are identified and illustrated in Table 1. Two types of pollen (Fabaceae and Fagaceae) are detected as dominant (≥45%) in the four natural honeys (H1, H2, H3 and H4). On the other hand, there is not pollen in commercial honey H5. Honey H6 has only one very minor type of pollen (< 3%) (Fabaceae). This indicates that imported honeys are adulterated and, above all, low in protein, since pollen is the main source of protein in honey. Fabaceae are the most abundant in the honey samples which indicates the richness of the Bejaia region in this family of plants. However, the seven pollen families (Myrtacae, Teliaceae, Asteraceae, Ericaceae, Eucalyptus, Poaceae and Lamiaceae) represent only 11% of the total pollen and are judged as minority or very minority pollens. Variations in the pollen content of honeys depend on the botanical richness of the foraging area, climatic and environmental conditions, the location of the hive in relation to the flower field as well as the strength of the bee colony [28].
Physico-chemical analysis
The results of the physico-chemical parameters of the honeys analyzed are shown in Table 2a. Honey is largely composed of carbohydrates which are expressed by the degree of brix [29]. The brix values of the analyzed samples vary from 81.4 (Fagaceae H4) to 84.1% (H5). The results of this parameter for the six honeys studied are well above the minimum limit for nectar honeys (> 65%) set by the [30] and are close to the values reported by [31] in Omani honeys (80 to 83.6%) and [32] in Algerian honeys (81 to 84.5%). The ANOVA test of the degree of brix of the honeys studied reveals a single homogeneous group H1, H2, H3 and H6. According to the results obtained, the botanical and geographical origins, environment, climate and honey storage conditions turn out to be important factors influencing the sugar content of honeys [28, 33].
Results of the physico-chemical parameters of honeys
Results of the physico-chemical parameters of honeys
Values are mean±standard deviation. Means followed by the same letter in each line are not different using the test ANOVA (Analysis of one Variance).
Humidity is a parameter for evaluating the degree of maturity of honey. Humidity higher than 20% can cause microbial growth [34].
The humidity of the honeys analyzed varies from 14.8 (H1) to 17% (H5) corresponding to refractive indices of 1.50 (H1) and 1.502 (H5). These results are below the maximum limit set by the [35] which is 20% . The honeys analyzed are ripe and do not present a risk of fermentation if they are well stored. The recorded contents are higher than those obtained by [32] (13 to 16%) and are similar to those of [33] (14 to 15%) in Algerian honeys. Imported honey H5 and local honeys (H3 and H4) form a homogeneous group for this parameter. The humidity of honey is mainly related to the humidity of the nectar and/or honeydew, the strength of the bee colony, the relative humidity in the harvesting area and the conditions for processing and storing the honey [36].
The pH of the six honeys studied varies from 4.02 (H1) to 4.52 (H3). These results indicate that the local honey H3 and H4 are a mixture of nectar honey and honeydew (pH > 4.5) and that H1 and H2 are of nectar origin (< 4.5). The values recorded are in agreement with those of [32] (4.26 to 4.43) and they are similar to those reported by [37] (3.97 to 4.5). The ANOVA test indicates the existence of two homogeneous groups: H2 and H5; H3, H4 and H6. The different pH values obtained can be explained by many factors such as botanical origin, the soil, the action of glucose oxidase as well as the organic acid composition (gluconic, acetic, benzoic and citric acids) and inorganic ions (phosphate, chloride) [38].
The EC of the honeys analyzed varies from 0.15 (H6) to 2.3 mS/cm (H3). These results are superior to those reported by [39] (0.29 to 1.13 mS/cm) and those of [28] (0.21 to 1.61 mS/cm) for Algerian honeys. The EC of H2 honey (0.65 mS/cm) is less than 0.8 mS/cm suggesting that it comes from nectar. However, the EC obtained by monofloral honeys H1, H3 and H4 (1.61; 2.30 and 1.16 mS/cm, respectively) is greater than 0.8 mS/cm which means that they are a blend of nectar and honeydew honeys. The ANOVA test of EC reveals a single homogeneous group which corresponds to commercial honeys H5 and H6. The latter have the lowest conductivity compared to that of other honeys. The different EC of the honeys studied could be explained by the variability of their chemical composition in ionizable substances (content of minerals, organic acids, carbohydrates and proteins) [40].
The HMF level of honeys varies from 8.09 (H5) to 51 mg/kg (H6). The range of results obtained is different from that recorded by [41] (1 to 34 mg/kg) and it is superior to the results of [39] (2 to 9 mg/kg). The samples H2, H3, H4 and H5 have an HMF content which does not exceed 20 mg/kg. Therefore, they are fresh (not exposed to high temperatures). However, H1 and H6 honeys have an HMF level that goes beyond the tolerated limit (> 40 mg/kg). This rise can be explained by excessive heating in order to avoid crystallization for H6 honey. On the other hand, poor storage conditions may be the cause of the high HMF concentration for H1 honey. For H5 commercial honey, its low HMF content can be explained by its low concentration of monosaccharides. Statistical analysis shows two homogeneous groups (H1 and H6; H4 and H5) for this parameter. The variability of HMF concentration depends on the increase in storage temperature and the carbohydrate profile [42].
The rate of proline in local honeys varies from 321 (H2) to 802 mg/kg (H3) which proves that they are authentic and ripe. However, imported H5 and H6 honeys have zero levels of this amino acid which proves that they have undergone adulteration following perhaps the addition of sugar to these honeys. The results obtained are superior to those reported by [43] (59 to 102 mg/kg) on Tunisian honeys and [28] on Bejaia honeys (202 to 680 mg/kg). Honeys H1, H2, H3 and H4 show a significant difference in the concentration of this amino acid, probably due to the strength of the bee colony (phenomenon of trophallaxis).
The color results of the honeys analyzed record intensities ranging from 0.15 (H6) to 0.98 OD (H4). These values differ from those reported by [44] for Palestinian honeys, which are characterized by a relatively light color (0.07 to 0.23 OD), and by [32] for Algerian honeys (0.27 to 0.81 OD), with a color varying between light yellow and brown. Statistical analysis shows a significant difference in color between the six honey samples (p < 0.05). The different colors obtained can be explained by the variability in the chemical composition of each honey in terms of phenolic acids, flavonoids, carotenoids (carotenes, xanthophylls), minerals (iron, copper) and amino acids (tyrosine, tryptophan) [45].
Proteins and amino acids are present in small quantities in honey. Their content varies from 0.2 to 0.4 mg/100 g for nectar honeys and from 0.4 to 0.7 mg/100 g for honeydew honeys [24]. The protein content of the honeys studied ranged from 3.83 (H6) to 491 mg BSAE/100 g (H1). This range is higher than that reported by [33] and [41] in Algerian honeys (46 to 134 mg BSAE/100 g and 35 to 137 mg BSAE/100 g respectively). Samples H5 and H6 have the lowest protein content and form a homogeneous group. According to [45], the different protein concentrations of the honeys analyzed are due to botanical and geographical origins, storage conditions and time, the quantity of pollen grains present in the honey, and the presence of enzymes added by the bees during honey production (amylase, gluco-invertase, catalase, glucose-oxidase, phosphatase).
The antioxidant contents range from 56 (H6) to 248 mg GAE/100 g (H4) (Table 2b). These levels are higher than those obtained by [46] in Turkish honeys (16 to 120 mg GAE/100 g). On the other hand, higher values are reported by [11] in Algerian honeys (90 to 318 mg GAE/100 g). Indeed, dark honey has a high phenolic compound content [19], which explains the richness of H3 and H4 honeys in these compounds (211 and 248 mg GAE/100 g respectively). 4-hydroxybenzoïcic, gallic, gentisic, vanillic, syringic, benzoic and caffeic acids could be components of these honeys. Indeed, [11] and [33] identified these phenolic acids in 35 and 26 Algerian honey samples, respectively. Honey samples H5 and H6 have the lowest polyphenol content (76 and 56 mg EAG/100 g respectively). The brown color of these honeys may be due to heating.
Results of phenolic compound content, antioxydant and anti-inflammatory activities
Results of phenolic compound content, antioxydant and anti-inflammatory activities
The range of flavonoid contents in the honeys analyzed varies from 47 (H6) to 74 mg EQ/100 g (H2) (Table 3). Honeys H2, H3 and H5 have the highest flavonoid contents and form a homogeneous group that differs significantly from the other honeys. Honey H6 has the lowest value. These results are higher than those obtained by [32] and [33] on Algerian honeys (respectively 7 to 20 mg CE/100 g; 3 to 28 mg QE/100 g). The variability of flavonoid concentrations in honey, such as flavonols (quercetin, kaemferol, isorhmmetin), flavones (galangin, chrisin,...), flavonones (isosakurametin, pinobanksin,...) and isoflavonones (genistein and diadzein) depends mainly on its floral and geographical origins. Indeed, [11] have identified these flavonoids in Algerian honeys. Consequently, the local honeys analyzed could have some of these flavonoids in their chemical composition.
The antioxidant activity of the honeys analyzed was assessed using 7 methods, and the results obtained are presented in Table 2b.
The percentage DPPH reduction of the honeys analyzed range from 50 (H6) to 76% (H5). This range is close to that obtained by [47] (47 to 83%) and higher than that of [48] (11 to 46%). The DPPH· inhibitory power exhibited by H4 honey is 65%, perhaps due to the presence of antioxidants with high reducing power such as phenolic compounds, vitamins, enzymes as well as copper and iron. Imported honeys H5 and H6, on the other hand, expressed an inhibition percentage of 76% and 50%, respectively. They may contain other substances with this biological activity. According to the work of [49] and [50], variations in DPPH free radical scavenging capacity of honeys depend on botanical origin and high concentrations of caffeic, ferulic, sinapic, p-coumaric and cinnamic acids. These acids present the best percentages of DPPH· radical inhibition thanks to the presence of –CH=CH-COOH groups, which are responsible for the high hydrogen atom donation capacity and subsequent stabilization of phenoxy radicals.
The antioxidant activity tested by the ABTS test registers values between 2 (H6) and 48% (H3). These results are close to those of [47] (2 to 31%). On the other hand, they are lower than the results of [33] (8 to 75%). H3 and H5 honeys show the highest anti-free radical activity (48 and 29%, respectively). The variability of these results can be explained by the qualitative and quantitative profile of the phenols present in each honey (cinnamic, phenylacetic, protocatechuic acids, etc.), vitamins (ascorbic acid, α-tocopherol), carotenoids and enzymes (catalase, glucose oxidase).
The reducing power of the honeys analyzed range from 124 (H6) to 412 mg EAG/100 g (H3). Fabaceae honeys H1 and H3 (339 and 412 mg GAE/100 g respectively) have the highest reducing power. In contrast, the samples H5 and H6 show the lowest activity (171 and 124 mg EAG/100 g, respectively), which may be explained by the addition of synthetic antioxidants during the manufacture of these honeys. These results are higher than those of [51] (39 to 120 mg EAG/100 g). The values recorded for this potency show a significant difference between the honeys analyzed, probably linked to their distinct quantitative and qualitative composition in phenolic acids, flavonoids, vitamins (C, E) and carotenoids, capable of yielding their electrons in order to reduce Fe3 + to Fe2 + .
The FRAP test assesses the reducing capacity of ferric iron (Fe3 +) to ferrous iron (Fe2 +) by enzymatic (catalase, glucose oxidase and peroxidase) and non-enzymatic (ascorbic acids, carotenoids and polyphenols) antioxidants in honey. M3 honey has the greatest reducing capacity (332 mg GAE/100 g) which is explained by its richness in antioxidant compounds (phenolic acids and flavonoids). However, H6 honey has the lowest activity (28 mg GAE/100 g) which confirms its poverty in antioxidant compounds. The values obtained are higher than those reported by [33] and [52] (9 to 257 and 8 to 240 mg GAE/100g, respectively). The ANOVA test for this activity reveals a single homogeneous group (H1 and H4) which shows a significant difference from the other samples.
The results of the ferrozine test show iron chelating activity between 27 (H3) and 41% (H4), indicating that the formation of the Fe2 +-ferrozine complex is not complete. These results are closer to those obtained by [53] (36 to 37%) but they are lower than those reported by [49] (52 to 88%). Commercial honeys H5 and H6 form a homogeneous group and have the same chelating activity (39%) which is explained by their enrichment in chelating compounds such as polyphenols, vitamins,... H4 honey has the least Fe 2+- ferrozine complex indicating activity, which means that this honey has a lot of iron chelating agents compared to others. The variability of the chelating power of analyzed honeys reflects the distinct nature of the chelating compounds present as well as their different affinity for iron in competition with ferrozine. Among the phenolic compounds of honey known for their chelating power, there are ferulic and caffeic acids, quercetin, kampferol and naringenin, which are characterized by a strong nucleophilic aspect of their aromatic rings [41].
The copper reducing power of the honeys analyzed ranged from 0.021 (H6) to 56 mg GAE/100 g (H3). These values are close to those reported by [32] (12 to 49 mg TR/100 g). Honey H2 has the lowest copper reduction capacity of the monofloral honeys (28 mg GAE/100 g), which may be explained by its low phenolic content. H5 honey from Turkey has an average value, which may be explained by adulteration or enrichment in minerals, mainly copper. Imported honey H6, on the other hand, has no activity, confirming its adulteration. The ANOVA test indicates the existence of the H1 and H5 homogeneous groups. The difference in the copper-reducing power of each honey depends on its composition in mineral salts and phenolic compounds, as well as on its floral origin.
Phosphomolybdate test results record values between 51 and 90 mg GAE/100 g for Fabaceae H3 and H1 samples, respectively. These results are lower than those obtained by [32] (87 to 104 mg GAE/g) in Algerian honeys and by [44] (87 to 102 mg AAE/g) in Palestinian honeys. Statistical analysis shows a significant difference between the six samples studied. This variability can be explained by the difference in chemical composition of phenolic compounds.
Anti-inflammatory activity
The results of BSA denaturation inhibition as a function of the different concentrations of the honeys analyzed are shown in Table 2b.
The results obtained show that the BSA denaturation inhibition capacity of the honeys analyzed varies from 11 to 79%, with maximum activity at a concentration of 0.5 mg/mL. These results are close to the range reported by [54] for Spanish honeys (12 to 85%) and [55] (7 to 71%) for Brazilian honeys. The dark brown H4 honey shows the highest activity compared with the other samples. This may be due to the honey’s high phenolic acid and flavonoid content, which reduces free radical formation. In contrast, the lowest anti-inflammatory activity was recorded by imported honey H6 at concentrations of 0.5, 1 and 2 mg/ml, with inhibition percentages of 38, 23 and 11% respectively. The inhibitory activity of commercial honeys may be explained by their enrichment in synthetic antioxidants. Statistical analysis reveals two homogeneous groups H1 and H3 at a concentration of 0.5 mg/mL and H2 and H5 at a concentration of 1 mg/mL.
Based on studies by [56] and [57], the phenolic compounds of honey, in large part, are responsible for the anti-inflammatory activity by decreasing the expression of inflammatory mediators (tumor necrosis factor- α (TNF-α), nitric oxide (NO), interleukin (IL)-4 and IL-13) via the ellagic acid while syringic acid modulates the proliferation of inflammatory cells (neutrophils, macrophages and lymphocytes). According to [58], honey causes a significant decrease in two inflammatory mediators (cyclooxygenase-2 (COX-2) and TNF-α) this by blocking the translocation of nuclear factor kappa B (NF-kB) in the nucleus thus reducing the concentration of prostaglandins E2, prostaglandins F2α and thromboxanes B2 responsible for the symptoms of inflammation. The variability of the protective activity of BSA by honeys can be explained by distinct contents of bioactive compounds such as flavonoids and phenolic acids. The latter are able to interact with the different sites of BSA, which prevents its denaturation [59].
Enzymatic anti-browning activity
Anti-browning enzyme activity is only obtained with four honeys (H1, H2, H3 and H4), as the imported honeys H5 and H6 are adulterated. Results for anti-PPO activity of monofloral honeys tested on apple slices range from 30 (H4) to 41 BU (H1) after incubation at 30°C, as shown in Figure 1a. The values obtained show that M4 honey has the lowest browning unit with the best PPO enzyme inhibition capacity (11 after 30 min to 47 BU after 72 h). On the other hand, the control has the highest browning unit of the honeys analyzed (36 at 30 min to 54 UB at 72 h), with the appearance of mold after 72 h. The range of enzymatic anti-browning activity at 4°C of the four natural honeys is 23 (M4) to 34 BU (H1). The results obtained (Fig. 1b) indicate that Fagaceae H4 honey has the greatest activity (10 after 30 min to 36 after 72 h). The control values oscillate from 23 at 30 min and 49 BU at 72 h. The results obtained (Table 4) are superior to those reported by [7] in 6 poly-floral honeys with an interval of 21 to 25 BU. The enzymatic anti-browning ability of honey is due to its content of phenolic compounds which explains the better PPO inhibiting activity of H3 and H4 honeys with the highest levels of polyphenols. Also, the difference in concentration of the 600 Da peptide from one honey to another can play a role in slowing down enzymatic browning by the formation of a stable complex between the copper of the PPO enzyme and the peptide. Indeed, [6] revealed this. The effect of temperature is also involved in this activity; the honey-low temperature combination shows greater anti-PPO activity compared to the honey-high temperature combination. This study confirms the previous results of [60] on apple slices treated with a poly-floral honey solution (10%) and stored under vacuum at 3°C. Fig. 2 represent the temporal monitoring of the evolution of enzymatic browning of apple slices treated with monofloral honey solutions (10%) at 30 and 4°C.
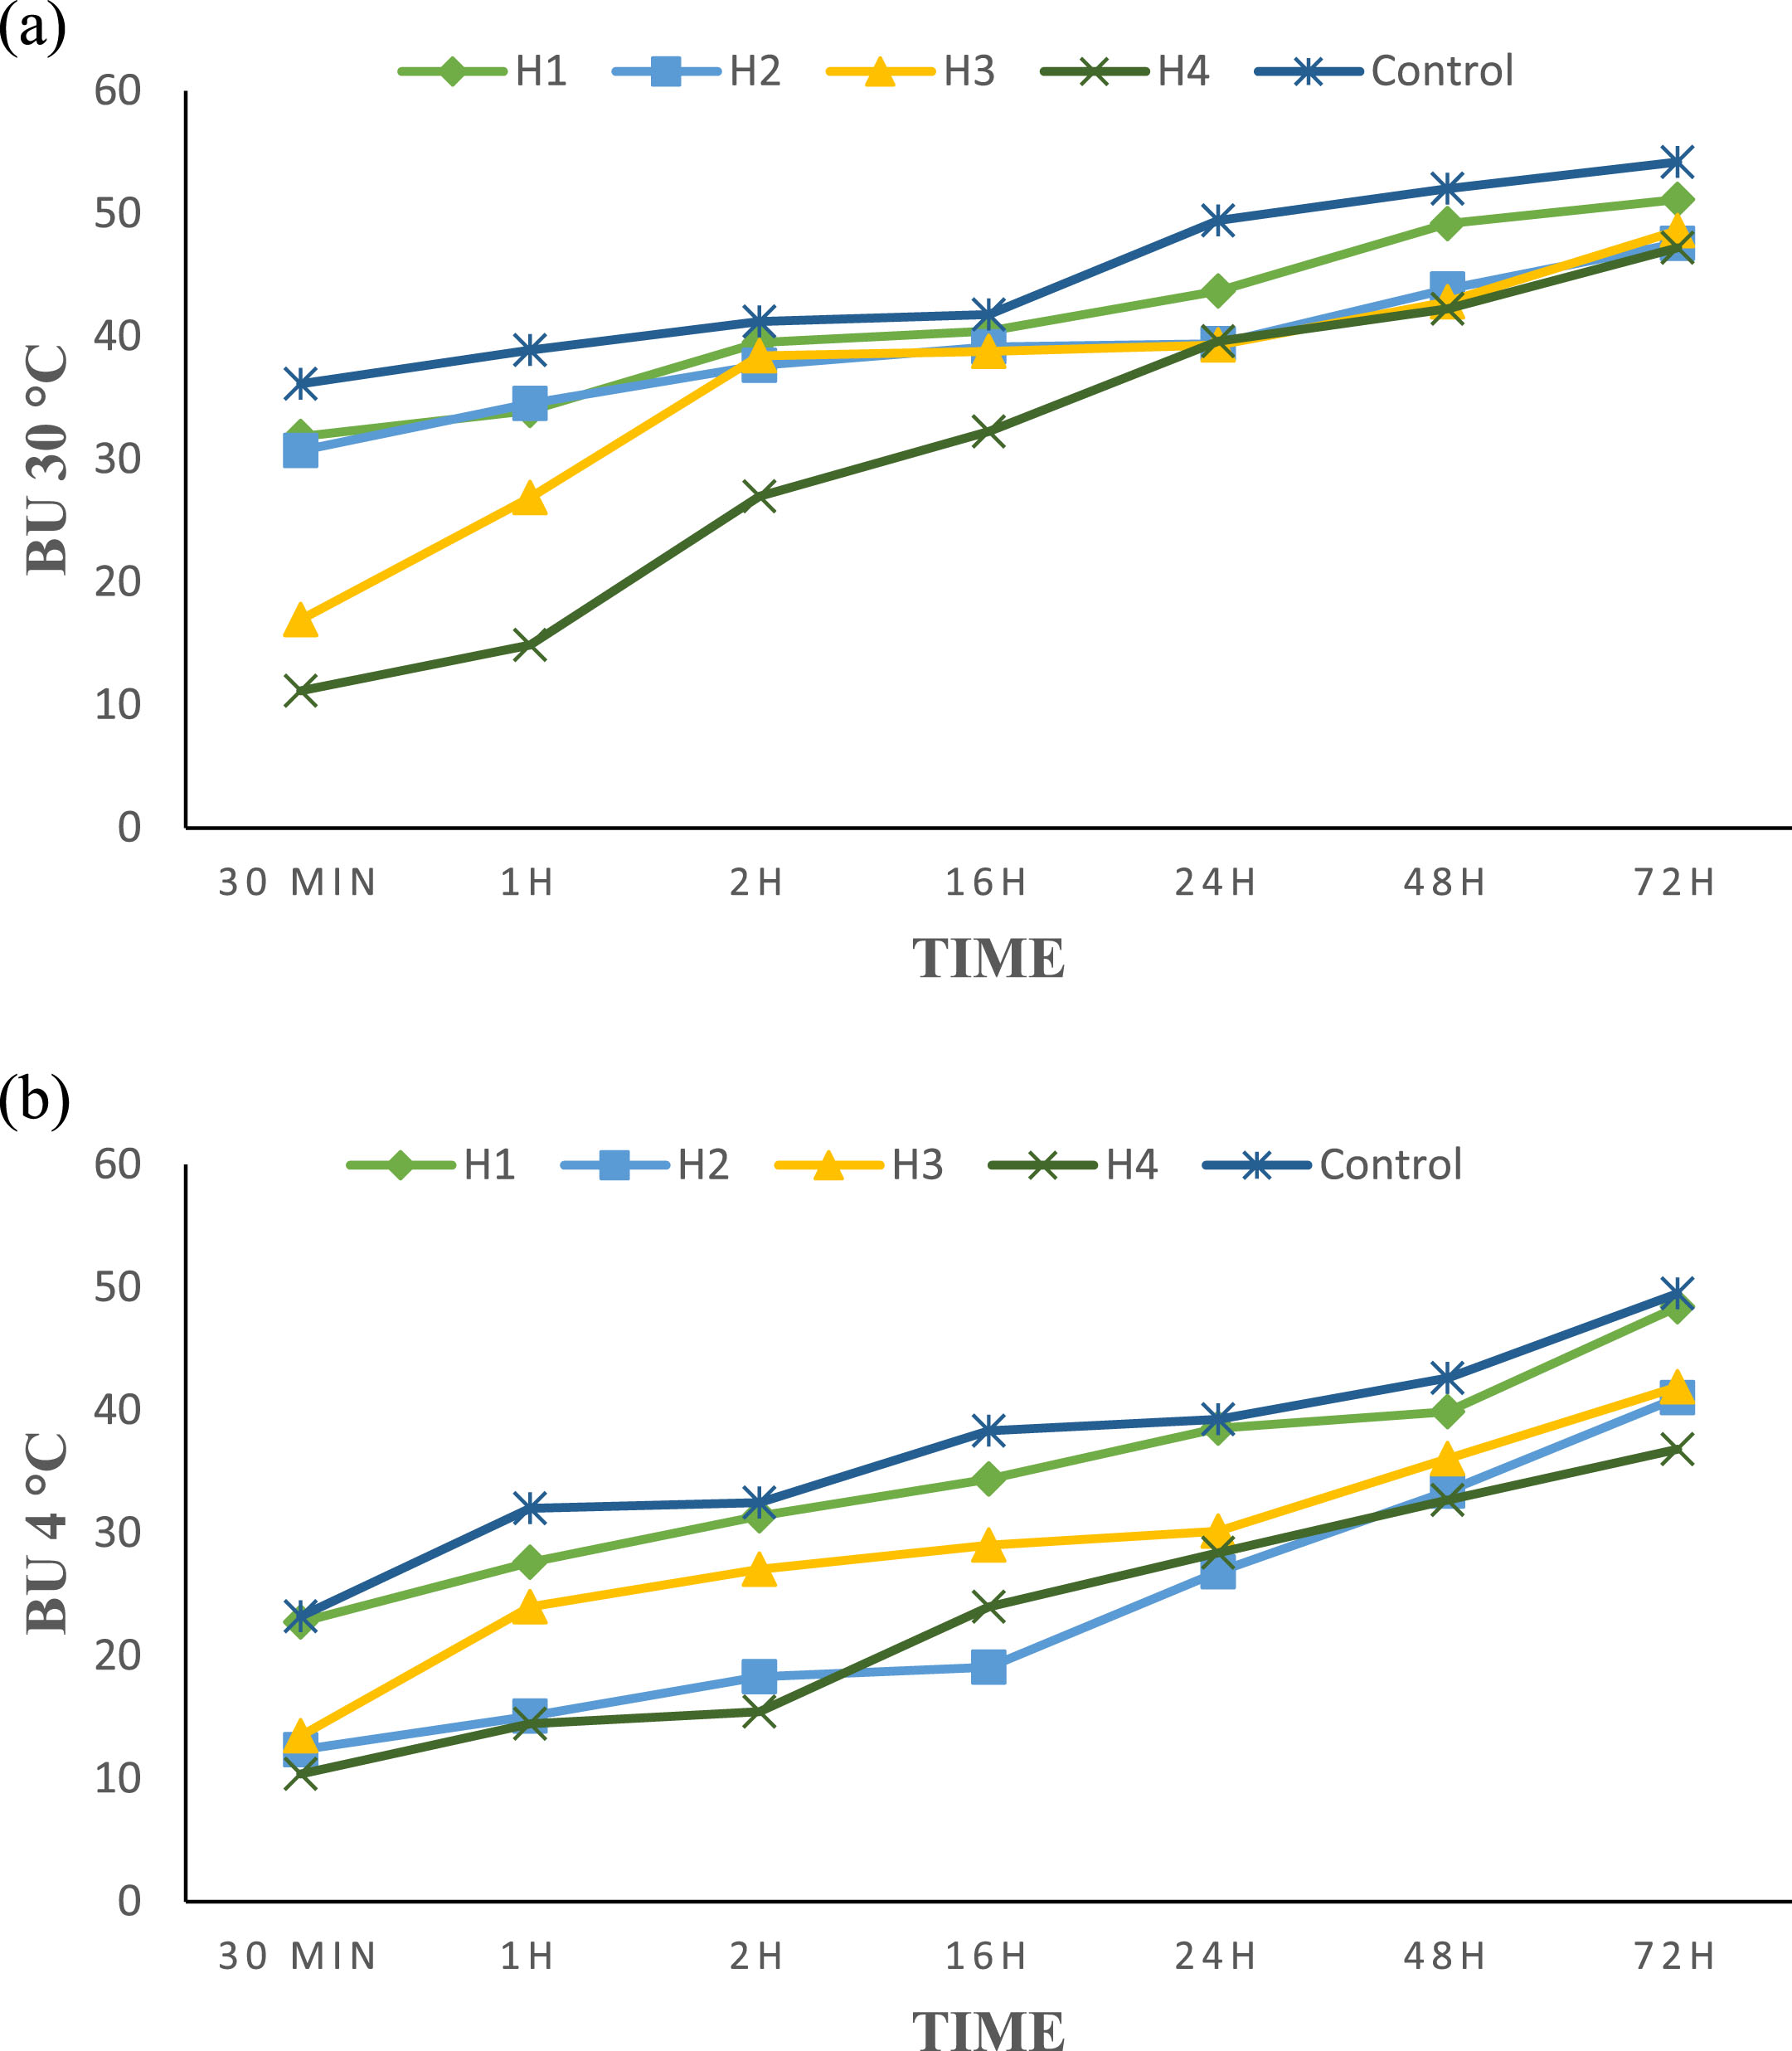
a) Browning unit for apple slices treated with honey solutions (10%) at 30°C. b) Browning unit for apple slices treated with honey solutions (10%) at 4°C.
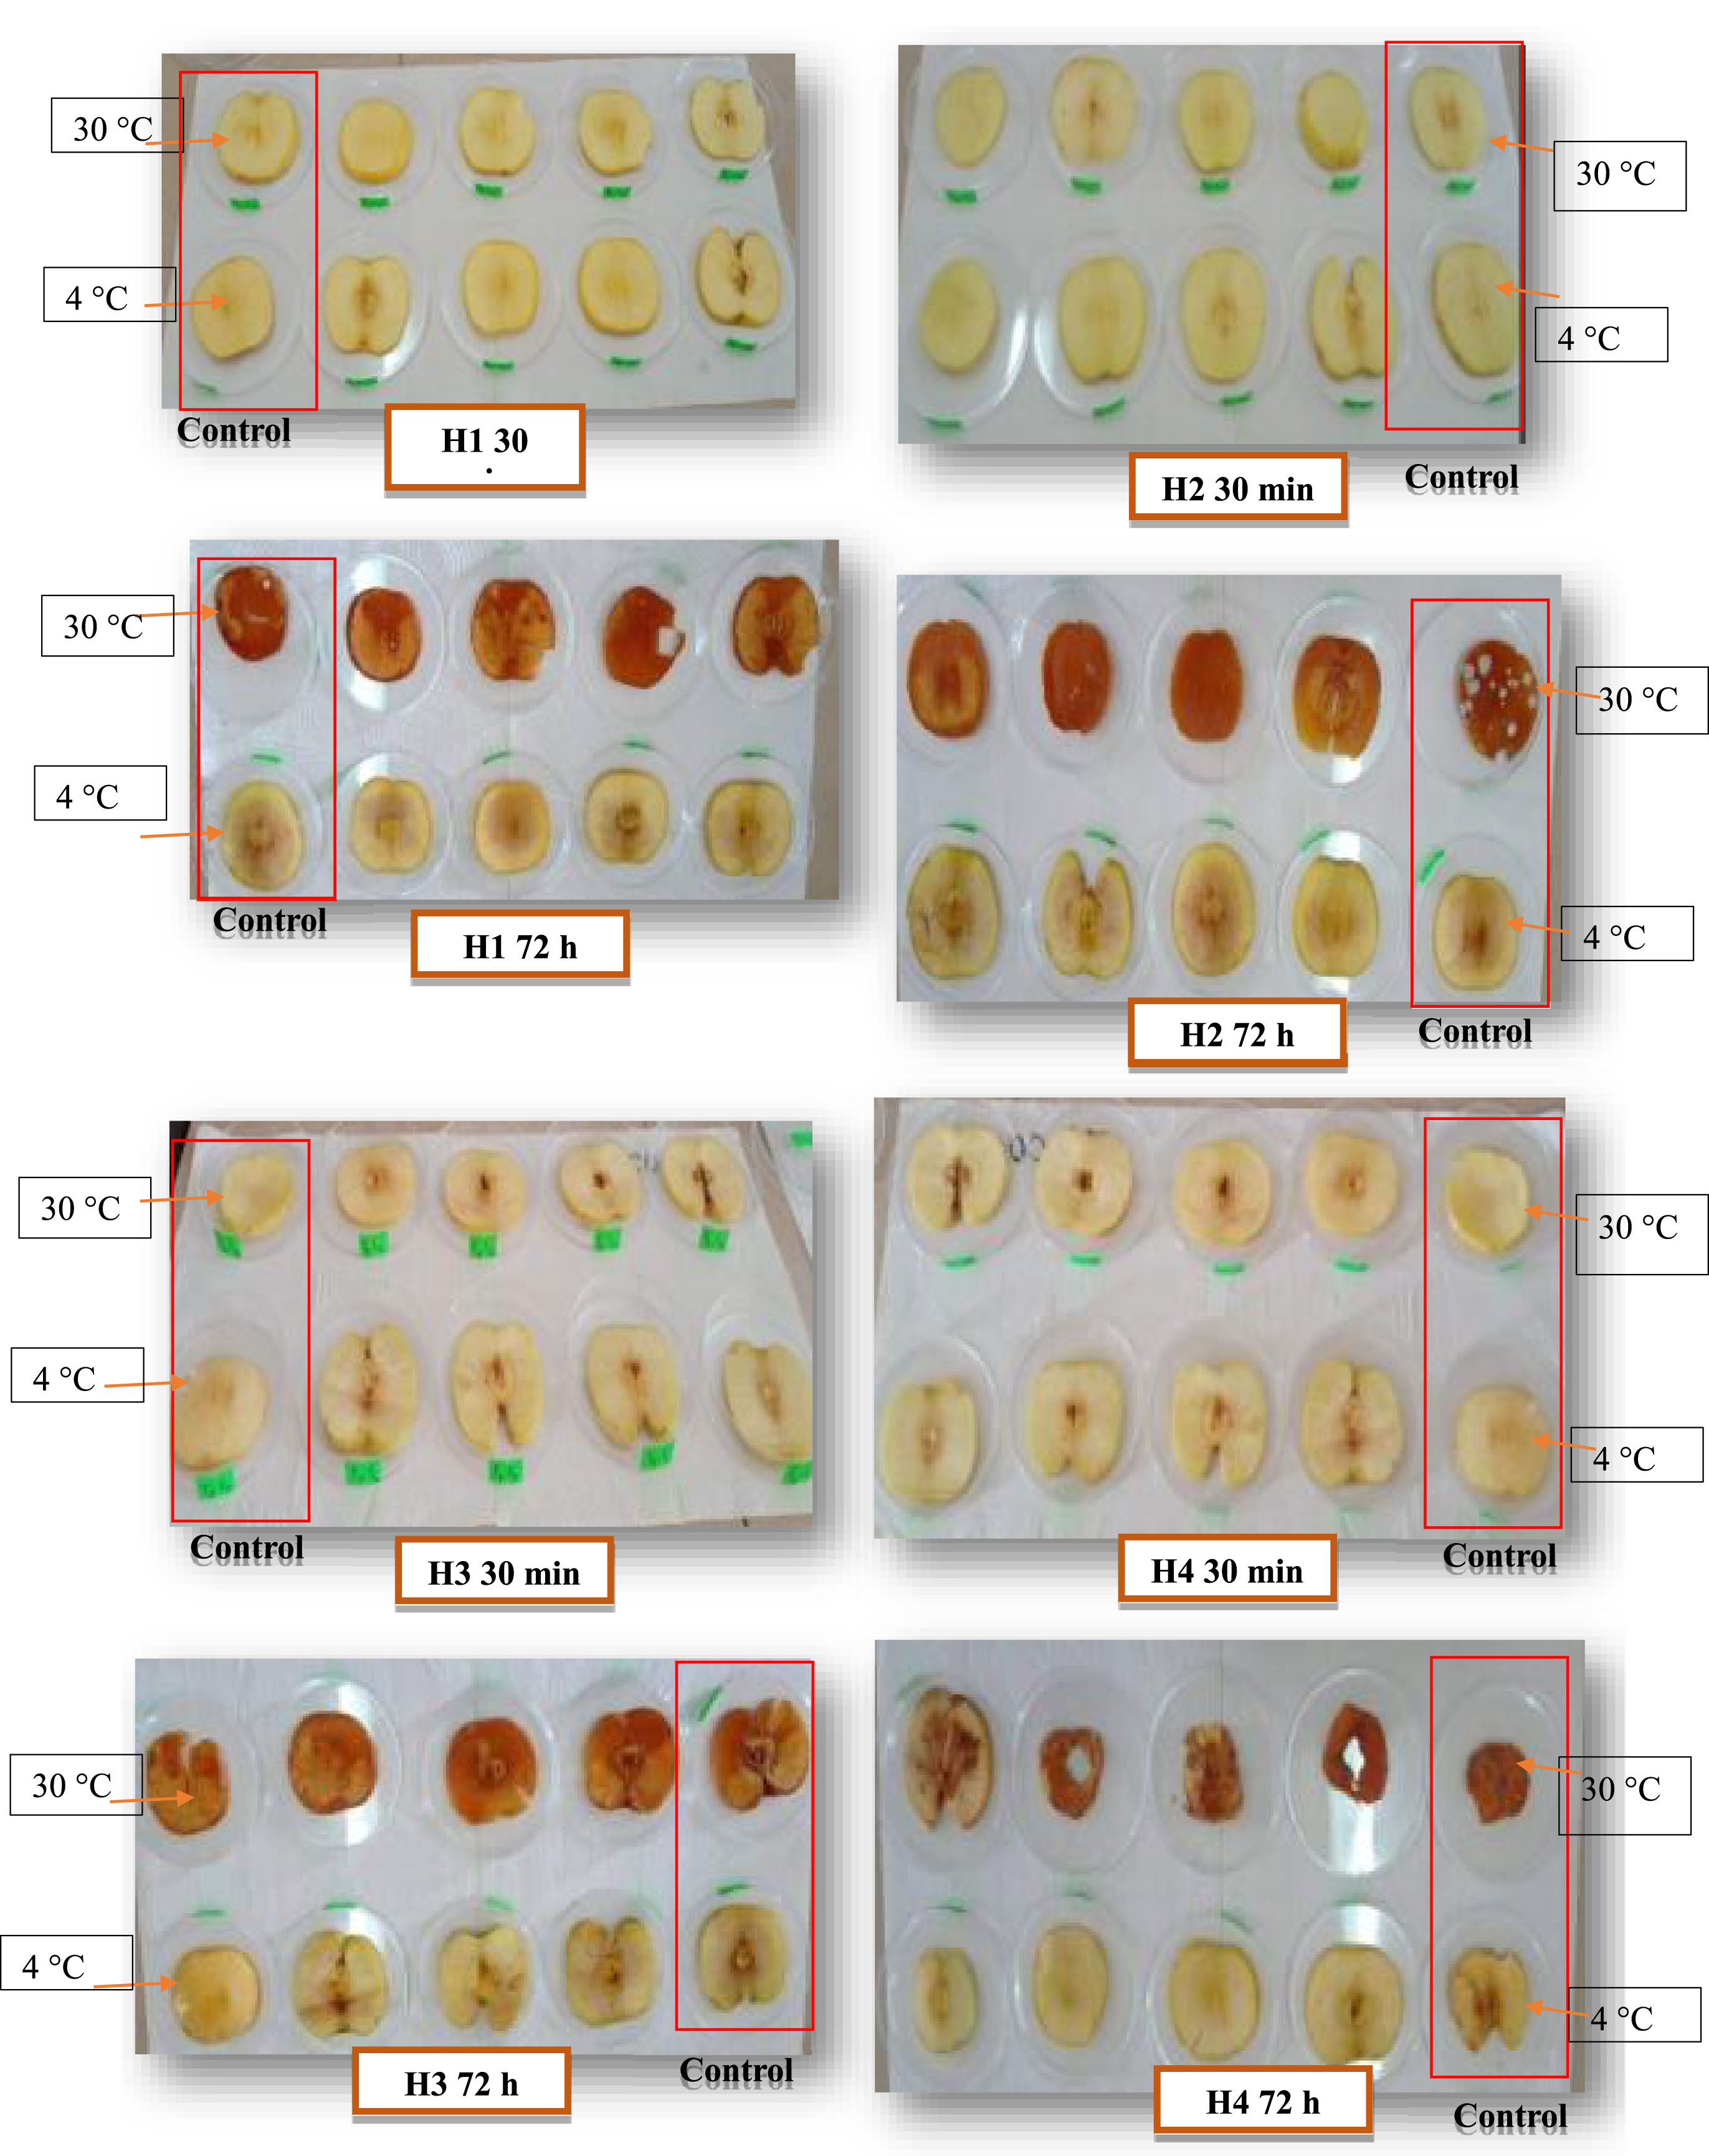
Photographs of the enzymatic anti-browning activity of honey at 30 and 4°C.
Color is highly correlated with electrical conductivity (r = 0.92) and polyphenol content (r = 0.92). It also correlates very significantly with protein content (r = 0.65) and the following antioxidant activities: CUPRAC, FRAP and phosphomolybdate (r = 0.65; r = 0.63; r = 0.65, respectively). These results are in line with those reported by [32]. Polyphenols correlated very highly with electrical conductivity (r = 0.81) and significantly with protein content (r = 0.55). The CUPRAC test revealed a highly significant correlation with FRAP, reducing power and ABTS tests (r = 0.84; r = 0.84; r = 0.91, respectively). Electrical conductivity shows a highly significant correlation with the ABTS test (r = 0.77) (Table 3a). Similarly, the results of this antioxidant activity show a significant correlation with the flavonoid content of the honeys analyzed. The darker honeys (H3 and H4) had the highest levels of polyphenols and flavonoids, the best physico-chemical parameters (pH, electrical conductivity, humidity, etc.), antioxidant activity (ABTS, reducing power, FRAP, ferrozine and CUPRAC tests) and good anti-browning enzymatic activity.
Correlation matrix between physicochemical parameters, antioxydant content and antioxidant activities
Correlation matrix between physicochemical parameters, antioxydant content and antioxidant activities
The correlation matrix (Table 3b) reveals a significant correlation between the proline content of the honeys analyzed and anti-inflammatory activity at 0.5 mg/mL, with a coefficient of 0.84. This relationship is justified by the anti-free radical power of proline, which gives honey its anti-inflammatory activity [57]. In addition, this matrix shows a link between anti-inflammatory activity (1 mg/mL) and the ABTS test (r = 0.50). The results show a significant relationship between anti-inflammatory activity at 1 mg/mL and the DPPH test (0.51), and between BSA denaturation inhibitory activity (0.5 and 1 mg/mL) and the ferrozine test (0.49 and 0.51, respectively). Highly significant correlations were observed between DPPH and the protective activity of BSA at 0.5 mg/mL (r = 0.7). At the same time, a significant correlation exists between anti-inflammatory activity at 2 and 1 mg/ml on the one hand, and between anti-inflammatory activity at 1 and 0.5 mg/mL on the other, with correlation coefficients of 0.86 and 0.74, respectively. Indeed, honey H4 shows the best iron chelating activity (ferrozine) and registers the highest anti-inflammatory activity at different concentrations (0.5; 1 and 2 mg/mL).
Correlation matrix between color, phenolic compounds, antioxydant and anti-inflammatory activities
The correlation matrix (Table 3c) shows very highly significant correlations between anti-browning enzyme activity at 48 h and 72 h, with a correlation coefficient of 0.94. It should also be noted that there are highly significant correlations between anti-PPO activity (24 h), proline level, reducing power and the FRAP and CUPRAC tests (0.76; 0.74; 0.74 and 0.75, respectively). In addition, there was a correlation between anti-PPO activity (48 and 72 h) and the ABTS test with 0.72 and 0.77, respectively. There are also significant correlations between anti-browning activity at 24 h and the ferrozine and ABTS assays (0.21; 0.61, respectively). In addition, anti-browning enzyme activity at 24 h shows a significant correlation with polyphenols (r = 0.21). Indeed, Fagaceae H4 honey has the highest polyphenol content and the best anti-PPO activity, which can be explained by its richness in phenolic acids such as caffeic, ferulic, sinapic and cinnamic acids, as well as in 600 Da peptide.
Correlation matrix between color, phenolic compounds, antioxydant and enzymatic anti-browning activities
Principal component analysis (PCA) is used to determine the similarities between the analyzed honeys as well as the relationships between the studied variables in a two-dimensional space. The correlation circle (Fig. 3a) shows two principal components CP1 and CP2 which represent 74.58% of the total variation and which are used in the interpretation of the data. CP1 explains 57.19% of the data and it represents in the positive part the HMF while in the negative part the water content and the antioxidant activities (test of DPPH, ABTS, CUPRAC and FRAP) and anti-inflammatory activity at different concentrations. However, CP2 explains 17.39% of the data and represents proline, proteins, electrical conductivity, reducing power, polyphenols and color in the positive part; the pH, the brix and the ferrozine and phosphomolybdate tests in the negative part. Furthermore, this figure reveals that there is a close correlation between the several parameters (color, electrical conductivity, proteins, proline, polyphenols, flavonoids, anti-inflammatory and antioxidant activities (CUPRAC tests, reducing power, DPPH, ABTS and FRAP) because they are grouped in the circle of correlation. Discrimination by CP1 express five groups of honey samples. Two groups can be found in the left part of Fig. 3b: the first group represents the H3 sample which has the best proline content, electrical conductivity, reducing power and FRAP test the second group contains the H4 honey which shows a better activity anti-inflammatory (0.5; 1 and 2 mg/mL) and antioxidant (DPPH, ferrozin tests and polyphenol content). The two other groups located in the right part are the imported honeys H5 and H6 which reveal low values in physicochemical parameters and biological activities. The last group is located in the center and includes the H1 and H2 honeys. These honeys have a similarity in their moisture and brix contents. The PCA results indicate a significant difference between natural honeys H1 and H2, H3, H4 and falsified honeys H5 and H6 in terms of physicochemical parameters, levels of antioxidant compounds and antioxidant and anti-inflammatory activities. The correlation circle confirms the correlations obtained in this study.
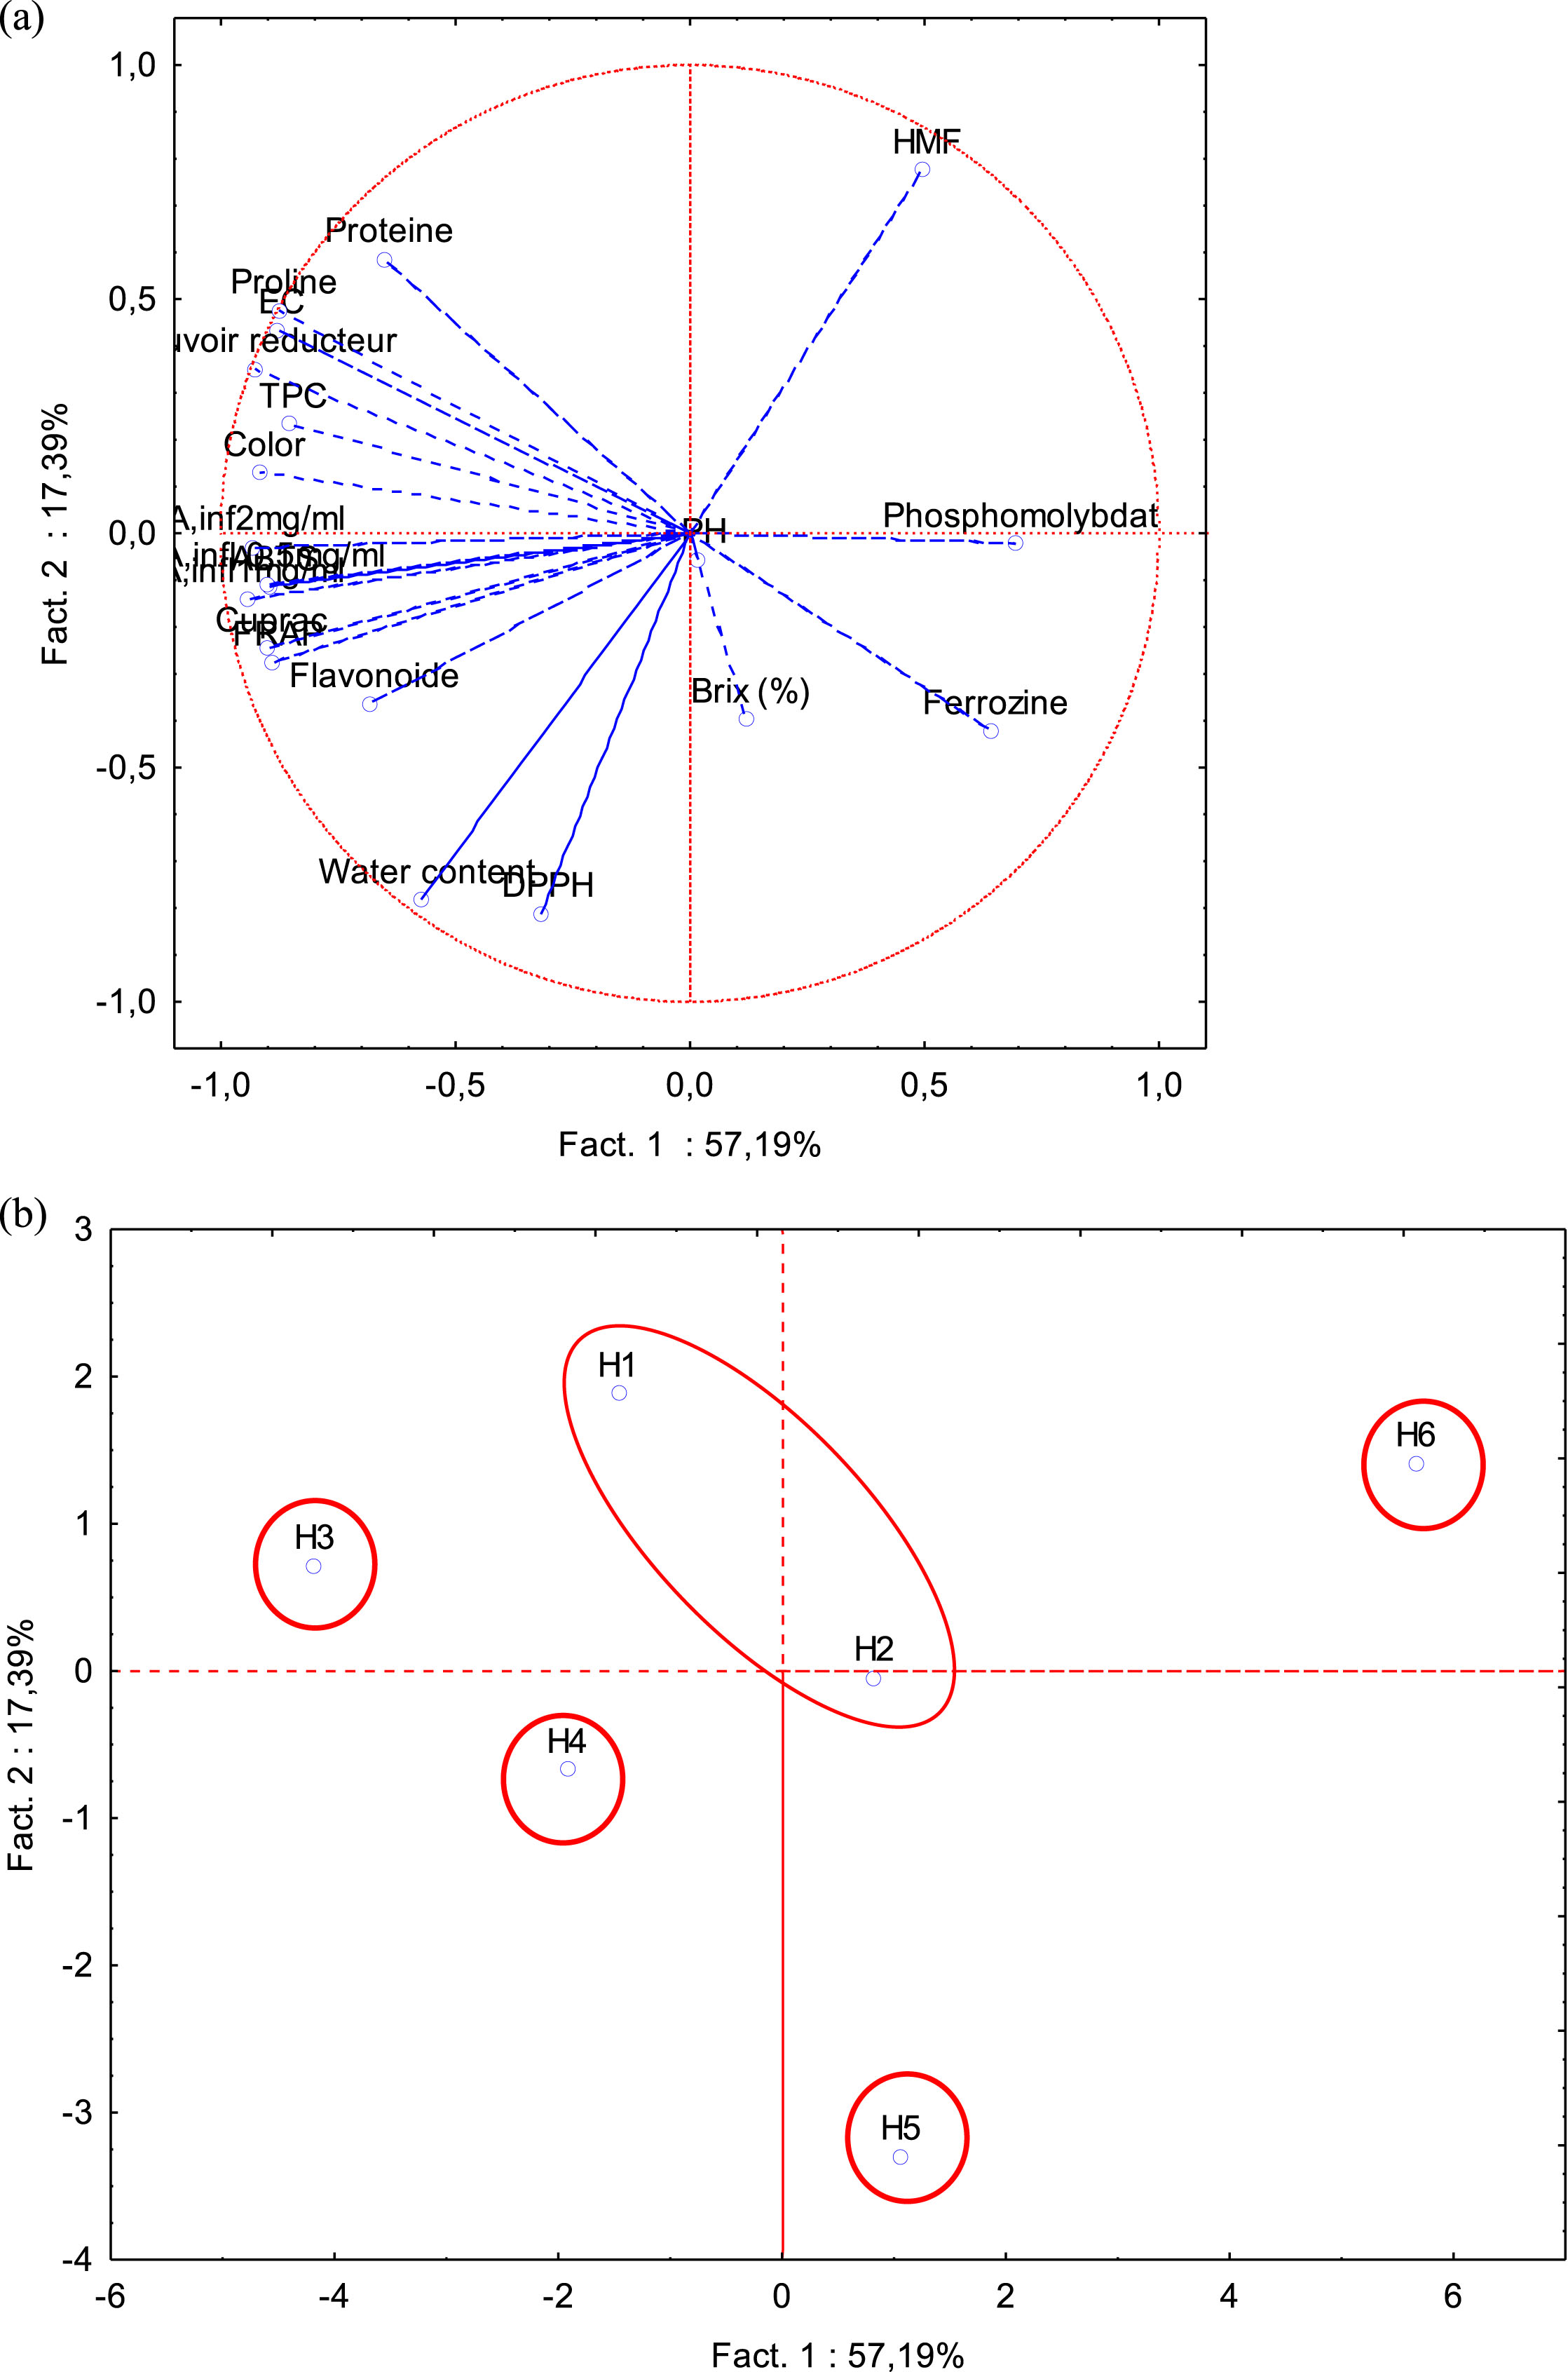
a) Correlation circle of physico-chemical parameters, antioxidants content, antioxidant and anti-inflammatory activities of the analyzed honey samples. b) PCA of physicochemical parameters, antioxidant content and biological activities of analyzed honeys.
This research work investigates the botanical origins, physicochemical properties, antioxidant and anti-inflammatory activities and enzymatic browning power of four local honeys (Ouzellaguen (H1), Yakouren (H2 and H3), Gouraya (H4)), and two imported honeys. Pollen analysis reveals four monofloral honeys with two dominant pollens (Fabaceae and Fagaceae) and the absence of pollens in the imported honeys (H5 and H6), confirming their adulteration. The results of the physico-chemical parameters indicate that the six honeys analyzed comply with international standards. However, the HMF and proline contents of commercial honeys (H5 and H6) do not comply with tolerated limits, unlike the other honeys. Algerian honeys show good antioxidant, anti-inflammatory and anti-PPO activities. Spearmane correlation and PCA results show that local honeys H3 and H4 show the best results in physico-chemical parameters and biological activities, unlike imported honeys H5 and H6.
It would be interesting to extend this work in order to better evaluate the effectiveness of honey by carrying out other biological activities, in particular antifungal activity, studying the effect of monitoring incubation time beyond 72 h for apples soaked in honey, the study of the enzymatic anti-browning effect on apples without the addition of honey at 4°C, the study of the enzymatic anti-browning power of honey with other techniques, on other fruits and vegetables and the determination of the enzymes responsible for browning (PPO), as well as the study of phenolic compound and mineral profiles.
Footnotes
Acknowledgments
We thank the Algerian Ministry of Higher Education and Scientific Research for encouraging scientific research.
Author contributions
Conflict of interest
The authors declare no conflict of interest for this paper.