
Abstract
In the ever-evolving world of cricket, the T20 format has captured the imaginations of fans worldwide, intensifying the anticipation for match outcomes with each passing delivery. This study explores the realm of predictive analytics, leveraging the power of machine learning to alleviate the suspense by forecasting T20 cricket match winners before the first ball is bowled. Drawing on a rich dataset encompassing factors such as past team performance and rankings, a diverse ensemble of predictive models, including logistic regression, support vector machine (SVM), random forest, decision tree, and XGBoost, is meticulously employed. Among these, the random forest Classifier emerges as the standout performer, boasting an impressive prediction accuracy rate of 84.06%. To assess the real-world applicability of our predictive framework, a post-case study is conducted, focusing on the high-stakes World Cup T20 matches of 2022, where England emerges as the triumphant team. The dataset underpinning this study is meticulously curated from ESPN CricInfo, ensuring the robustness of our analysis. Moreover, this paper extends its contribution by offering a comprehensive comparative analysis, scrutinizing performance metrics such as accuracy, precision, recall, and the F1-score across benchmark machine learning models for cricket match prediction. This in-depth evaluation not only validates the efficacy of our models but also sheds light on their superior execution time and statistical robustness, further bolstering their utility in the realm of cricket outcome forecasting.
Introduction
Cricket, a beloved sport with a global fanbase, has witnessed an unprecedented surge in popularity over the years. With billions of enthusiasts and players worldwide, cricket offers diverse formats, including T20 Internationals, One Day Internationals, and Test Matches. Among these, the T20 format reigns supreme, captivating audiences with its concise 20-over structure, ideal for today’s fast-paced lifestyles. The widespread promotion of T20 cricket through commercial events like the Indian Premier League (IPL) in India and the Big Bash League (BBL) in Australia has further fueled its allure. Each T20 match, characterized by its brevity, delivers nail-biting excitement, leaving fans on the edge of their seats until the last ball. In this electrifying atmosphere, fans often engage in predicting the winner before or during the match, intensifying their anticipation. This study introduces a systematic approach to predict the winners of T20 cricket matches. Focusing on the 8th edition of the ICC Men’s T20 Cricket World Cup, where 12 teams vied for supremacy, the research delineates the journey of these teams, which included an initial Super12 stage and the subsequent emergence of semi-finalists. The winners of the semi-finals eventually battled in the grand finale to secure the championship for the next two years. By harnessing data-driven methodologies and predictive analytics, this study seeks to unveil the secrets behind predicting the winning team in T20 cricket matches, adding an analytical layer to the excitement of this beloved sport. In contrast to many existing papers that focus on individual player performance metrics, such as career statistics and recent participation, as seen in Jhanwar et al. [6], Awan et al. [24], and Prakash et al. [16], our proposed study takes a distinctive approach. Recognizing cricket as a team sport, our study places emphasis on evaluating and predicting team performance as a whole, rather than relying on individual player statistics. This unique perspective allows us to consider the collective dynamics and factors that impact team success in T20 cricket, providing valuable insights into team-based predictions. The outcome of T20 games is dependent on different factors, which we have considered in this work,
The novelty of this work lies in its comprehensive and rigorous comparative analysis of various machine learning models for predicting T20 cricket match winners. This research breaks new ground by evaluating diverse data sources, incorporating statistical testing, considering execution time, and employing comprehensive evaluation metrics. Furthermore, its application of machine learning to cricket match prediction, particularly in the T20 format, represents a unique contribution to sports analytics. These novel aspects collectively advance the field by enhancing the precision and robustness of predictions while shedding light on the relative merits of different machine learning algorithms in the context of sports outcome forecasting. After rigorous data collection, extensive data cleaning, and organization efforts, this study employs a range of supervised learning algorithms, including Random Forest, Decision Tree, Gradient Boosting, Hist Gradient Boosting, Bagging Classifier, XGBoost, Voting Classifier, and K-Nearest Neighbors (KNN). These algorithms are harnessed to construct predictive models aimed at forecasting the winning team in international T20 cricket matches, using a separate testing dataset for evaluation. Among these models, the Random Forest Classifier stands out with an impressive accuracy rate of 84.06%. The predictive framework draws upon critical factors such as ICC T20 rankings and historical performance, specifically appearances in the final and semi-finals, for each participating team. Teams with higher ICC rankings and more frequent appearances in semi-finals or finals are identified as stronger contenders for championship victory. The prediction process unfolds in a multi-step fashion. Initially, predictions are made to identify the teams most likely to qualify for the playoffs. Subsequently, among the qualified playoff teams, predictions are made to determine which teams are likely to advance to the final. Finally, using the aforementioned predictive criteria, the study forecasts the ultimate winner between these two finalist teams. This methodical approach aims to provide comprehensive insights into the dynamics of T20 cricket match outcomes. This study makes several notable contributions that significantly advance the field of sports analytics and cricket match prediction.
The paper is organized into various sections, each serving a specific purpose. Section 2 delves into a comprehensive review of pertinent literature related to this study. Section 3 provides essential background information necessary for constructing our predictive models and conducting experiments. In Section 4, we present our proposed models and their applications for predicting the winner of the T20 World Cup. Section 5 offers a detailed analysis of the results and comparisons, shedding light on the outcomes of our research. Finally, Section 6 concludes the paper and outlines potential avenues for future research in this domain.
In this section, we delve into a body of research that pertains to the prediction of various factors within the realm of cricket. These studies serve as a source of inspiration and motivation for the development of prediction models tailored specifically for forecasting the winning team in T20 Cricket World Cup matches. A data mining approach to ODI Cricket Simulation and Prediction” by Sankaranarayanan, Sattar, and Lakshmanan [1] proposes a data mining approach to simulating and predicting the outcome of One Day International (ODI) cricket matches. The authors argue that the complex rules governing the game, along with the numerous natural parameters affecting the outcome of a cricket match, present significant challenges for accurate prediction. The model is trained on a dataset of historical match data, and it uses a combination of linear regression and nearest-neighbor clustering algorithms to predict the number of runs that will be scored in the remaining overs of the match. The authors evaluated the performance of their model on a test dataset of 100 matches, and they found that it was able to predict the winner of the match with an accuracy of 70%. They also found that the model was able to predict the number of runs scored with an accuracy of 65%. Gagana [2] has given a brief analysis of T20 matches with the help of Machine learning algorithms. The model is capable of predicting the runs scored on each ball based on some pre-labeled data. The data is collected from previous matches, and the problem is considered to be of Classification. The Naïve Bayes model is applied with 90% train and 10% test, and the accuracy obtained is 42.50 %, using Decision Tree and Random Forest on the same split of data, the accuracy obtained is 82.52 % and 90.88% respectively. There is also a scope to improve the accuracy using the Recurrent Neural Network (RNN) and Hidden Markov Model (HMM). Predicting the Winner in One-Day International Cricket” by Ananda Bandulasiri [3] investigates the factors that affect the outcome of One Day International (ODI) cricket matches. The author uses a logistic regression model to analyze a dataset of 200 ODI matches played between 1996 and 2007. According to the findings, the model has an accuracy rate of 80% when predicting the outcome of a cricket match. The study also showed that the most important predictor of the match outcome is the average score of the team batting first. The research thus demonstrated the potential for using statistical models to predict the outcome of cricket matches.
Score Prediction and Player Classification Model in the Game of Cricket Using Machine Learning” by S. Kumar and S. Roy [4] proposes a machine learning approach to predicting the score of a cricket match and classifying players into different categories. The authors use a dataset of historical match data to train a decision tree model to predict the score of a match. They also use a support vector machine model to classify players into different categories, such as batsmen, bowlers, and all-rounders. The authors evaluated the performance of their models on a test dataset of matches, and they found that the decision tree model was able to predict the score of a match with an accuracy of 80%. They also found that the support vector machine model was able to classify players into different categories with an accuracy of 90%. The authors conclude that their models are a promising approach to cricket score prediction and player classification. They suggest that the models could be used to improve the decision-making of coaches and players, and they could also be used to develop betting strategies. A Survey on Team Selection in the Game of Cricket Using Machine Learning” by I. Technology and S. MS [5] surveys the literature on the use of machine learning for team selection in cricket. The authors discuss the different machine learning techniques that have been used for team selection, the challenges of team selection, and the future directions of research in this area. The authors conclude that machine learning has the potential to be a powerful tool for team selection in cricket. However, they also note that more research is needed to develop more accurate and robust models. To predict ODI cricket matches, Jhanwar [6] presented a Cricket Outcome Predictor. A dataset of matches was used to test the model, and the findings revealed that it can predict matches’ outcomes with an average accuracy of 92.6%. The potential of squad composition-based machine learning models for forecasting the results of one-day international cricket matches is thus highlighted by this work. To forecast the results of a one-day international cricket match while it was taking place, Bailey and Clarke [7] undertook a study. A dataset of matches was used to test the model, and the findings revealed that it can predict matches’ outcomes with an average accuracy of 85.2%. This study thus highlights the potential of machine learning models for predicting the outcome of one-day international cricket matches while the game is in progress. According to N. Pathak [8], the chance of winning or losing an ODI cricket match is predicted using a variety of classification approaches, including Naive Bayes, Support vector machines, and Random Forest. A COP (Cricket Outcome Predictor) is then constructed based on these results. A dataset of matches was used to test the model, and the findings revealed that it can predict matches’ outcomes with an average accuracy of 87.3%. This study demonstrates how effective contemporary classification methods may be at forecasting the results of one-day international cricket matches. S. Kampakis [9] used a variety of machine learning models to forecast the results of English County Twenty Over Cricket Matches. Here, characteristics are added to the model to improve both its performance and its accuracy. The accurate result is provided by Naive Bias (64.9%). Here, a straightforward prediction technique is paired with intricate hierarchical characteristics to create the model. K. Passi [10] analyzed the performance of individual teams using machine learning algorithms. Different types of classification models like Naïve Bayes, Multilevel SVM, and Random Forest are applied which give the best result. Here different features like batting performance and the number of wickets gained by a bowler of an individual team are used to get desired outcomes. Random Forest gives the best result: 90.74% (Batting Performance) and 92.25% (Bowling Performance) of a player of an individual team. M. Yasir [11] presented a multi-level perception model that is used to predict the result of an ongoing t-20 international match and evaluate the model on the historical balls by ball datasets. For prediction, several variables are considered, including the commencement and duration of the match. Models are created using information from previous team performances, the match’s location, and player performance. This produces results that are 85% accurate before the match and 89% accurate after it (after the match). Applications of Machine Learning in Cricket, A Systematic Review” by I. Wickramasinghe [12] conducts a systematic review of the literature on the applications of machine learning in cricket. The author identifies 72 relevant articles published between 2001 and 2021. Manoj S. Ishi and J.B. Patil [13] surveys the literature on the use of machine learning for team formation and winner prediction in cricket. The authors discuss the different machine-learning techniques that have been used for these tasks, the challenges of these tasks, and the future directions of research in this area. The authors conclude that machine learning has the potential to be a powerful tool for team formation and winner prediction in cricket. However, they also note that more research is needed to develop more accurate and robust models. The paper is a good overview of the state of the art in machine learning for team formation and winner prediction in cricket. The authors do a good job of summarizing the different machine-learning techniques that have been used in this area and the challenges that need to be addressed. Overall, the paper is a valuable contribution to the literature on machine learning for team formation and winner prediction in cricket. It provides a good starting point for researchers who are interested in this area. F. Nasim [14] presented that the prediction of a batsman’s performance can be done using a model named HMM or Hidden Markov Model. Here the dataset is taken from the CricInfor website. Using the first-order Markov chain, it can predict how many runs the batsman can make on the next ball they face. This can help to select the best players based on their performance. Some other factors like weather, the nature of the wicket, the performance of the opposing team, the crowd of the stadium, the venue of the game, etc., affect the batsman’s performance. D.G.T.L. Karunathilaka [15] analyzed in this paper that IPL annotations will be used in the future by the scientific community. Here a model that can forecast the win probability of a team in every cricket over in real time is developed. That model uses many features from the player statistics. These features can be individual teams’ performances (both batting and bowling performances), the venue of the matches, and many other factors. For this case, the Adaboost and Multi-layer Perceptron model is used to predict the winning probability of a cricket match. According to an article by C. Deep Prakash [16], the Deep Player Performance Index i.eDPPI, can be used to evaluate a T20 Cricket player’s performance index in both bowling and batting. Its work is to capture a player’s present performance and position in the team. DPPI helps to make it possible for researchers and T20 cricket fans to compare players played on various teams who perform similar roles. Also, it determines the approximate team strength by the combined DPPI values of players in various positions on a team. The deep Player Performance Index is based on K-Means clustering and the Random Forest algorithms. Apart from other indexes, DPPI has a better player’s performance holding capability and it is a helpful index for cricket fans, coaches, and managers to get a better knowledge of players and their performances of past matches. According to a study by S. Sarangi [17], all four teams’ chances of winning are greatly impacted by the number of fielding mistakes and bowler economy. However, none of the teams were impacted by the umpire’s country of origin, but other factors had a distinct impact on each team’s performance that are the number of 4 s and 6 s scored, extras conceded, umpire’s nationality, fielding mistakes, bowling economy, number of debutants from each team, pitch condition, etc. For determining these parameters, the binary logistic regression model is used and these parameters are fully independent of each other. The proposed models in the research can be used by team management and trainers to build match strategy and player selection for higher win outcomes because they are based on a mixture of historical pattern data for certain variables and real data for others.
In a paper by A. Singhal [18], prediction of the winner of an Indian Premier League (IPL) match has been done by using various machine learning algorithms for classification. Python simplifies data analysis by providing visual representations of results. Here four classification algorithms – decision tree classifier, K-nearest neighbor classifier, support vector machine classifier, and random forest classifier are used and out of the four, the best model was selected for prediction, and results are visualized as graphs. According to a study by T. Mahmood [19], PSL data from pertinent sources is gathered and created as a validated data set for machine learning studies. They are trying to implement the solution for “PSL Eye”, which predicts the match-winning team using neural networks (NNs). At first, the data in the dataset was preprocessed to remove any extraneous variables before fine-tuning the NN hyper-parameters. The accuracy of PSL Eye is 82%, based on the testing dataset. The final results are obtained by running our NN-based PSL Eye after obtaining the hyperparameter’s ideal values. According to a paper written by A. Sahu [20], the prediction of outcomes of IPL cricket matches has been done using machine learning techniques. The dataset which is used for this work is taken from Kaggle which has two factors – wind speed and humidity. For data preprocessing of data in the dataset, manual encoding and label encoders are used. After removing all irrelevant things from the dataset, feature selection, and
In this study, historical data encompassing IPL matches held between 2008 and 2017 serves as the training dataset for our predictive models. Among the six models employed, the Random Forest Classifier emerges as the top-performing model, excelling in terms of prediction accuracy, precision, recall, F-score, and various statistical parameters.
Background details
Supervised learning techniques
Supervised learning is a subset of machine learning wherein machines make predictions based on well-labeled training data that has been utilized to train the models. The term ‘labeled data’ denotes input data for which the corresponding output is known in advance [26, 27]. In supervised learning, the model is provided with both the input data and the corresponding output data to learn and make predictions. For the completion of this study, four data sets are used which are:
Fixtures of the T20 World Cup of 2022. ICC T20 ranking of all international cricket teams. All about information like previous appearances, previous titles, number of semifinals, and number of finals played by each team. All sort of match details of previous T20 World Cup along with last 5 years international T20 matches.
The dataset utilized in this study is sourced from ESPN Cricinfo, the ICC website, and Wikipedia. Initially, label encoding was employed to convert the dataset into numerical values. To address the challenge of imbalanced data, the Synthetic Minority Oversampling Technique (SMOTE) algorithm was adopted. SMOTE is particularly effective in enhancing accuracy when dealing with smaller dataset proportions. While various oversampling techniques exist, SMOTE is considered a contemporary and advanced method. This research encompasses the development of six distinct models, each constructed using the aforementioned machine learning algorithms and the training dataset, as depicted in Fig. 1.
Proposed methodology for predicting winners of T20 cricket match.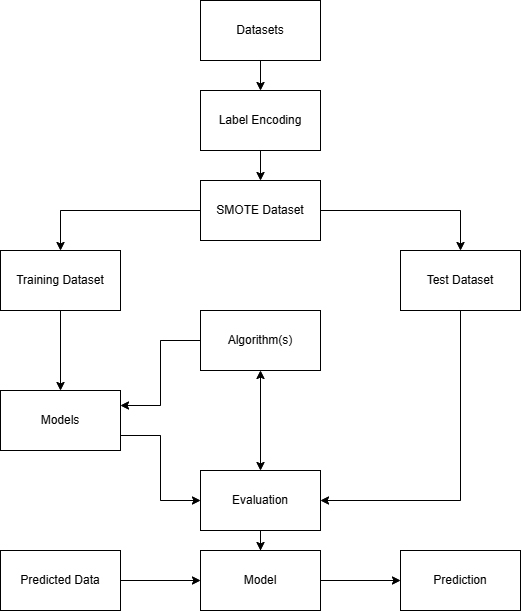
The decision tree is a well-known, powerful, and famous model for classification and prediction. A decision tree is typically structured as a tree-like data structure, featuring root and leaf nodes as decision points and intermediate nodes as potential outcomes (representing many possible, albeit unknown, results). Edges within the tree depict potential outcomes. In problems involving classification and regression, the CART (Classification and Regression Trees) method is frequently applied. CART divides a node into sub-nodes using the Gini Index criterion. The CART algorithm commences by considering the training set as the root node and attempts to split it into two sub-nodes. This process is executed recursively, with the algorithm continuously dividing nodes until it reaches a predefined maximum number of leaves or achieves pure sub-nodes. The Eq. (1) below represents a decision tree classifier, where ‘Pi’ denotes the probability of class ‘i’ and ‘C’ represents the total number of classes in the classification problem.
Random Forest is a widely used supervised machine learning model which is used for classification as well as regression problems. The Random Forest model is a widely embraced supervised machine learning technique applicable to both classification and regression tasks. The Random Forest flowchart typically comprises two segments: the first involves the training set, and the latter pertains to the test set. In this process, the root node, or initial node, represents the training data, and intermediate nodes symbolize individual decision trees. Following this, a majority vote is taken for classification tasks, while for regression problems, the average vote is considered for the output. In classification problems, the model calculates both entropy and the Gini index. Equation (2) assists in determining how nodes branch within a decision tree, while Eq. (3) aids in computing the Gini index for each branch at a given node.
The Histogram Gradient Boosting Algorithm is a member of the ensemble machine learning family. Ensemble learning refers to the practice of combining multiple models to create a single model that delivers improved accuracy compared to individual models. This algorithm bears similarities to the Gradient Boosting Classifier, but it distinguishes itself by reducing the number of features utilized in predictions. This reduction not only enhances the overall speed of the algorithm but also augments its predictive accuracy.
In Eq. (4),
In Eq. (3.1.3),
Maximizing the log-likelihood function is the objective. Therefore, if the log (likelihood) is used as our loss function and smaller values indicate better-fitting models. Below Eq. (6) is shown the mathematical representation.
Generally, the Bagging Classifier serves as an ensemble meta-estimator. Its methodology involves the selection of random subsets from the original dataset to train the base classifier independently on each of these subsets. The final prediction is then determined through a collective decision, typically involving voting or averaging of the individual predictions. The Bagging Classifier can be applied to a wide range of machine learning algorithms, including but not limited to Artificial Neural Networks (ANN), Support Vector Classifiers (SVC), and decision stumps. Additionally, it can be adapted for regression problems, extending its utility beyond classification tasks. The mathematical expression for a bagging classifier can be represented as,
In the Eq. (7),
Gradient Boosting is a powerful technique primarily employed for solving classification problems. It falls under the ensemble learning category, which involves amalgamating multiple decision trees to construct a more accurate predictive model. This algorithm operates through an iterative process where decision trees are successively trained on the residuals, i.e., the errors, of the preceding tree. Each subsequent tree aims to rectify the mistakes made by its predecessors. In the Gradient Boosting Classifier, decision trees are trained using a gradient descent optimization algorithm, which is geared toward minimizing the loss function of the model. The loss function quantifies the disparity between the model’s predicted values and the actual values within the training dataset. By minimizing this loss function, the algorithm endeavors to create a model that exhibits strong generalization capabilities when applied to new, unseen data. Equation (8) encapsulates the mathematical representation of the Gradient Boosting Classifier (GBC) within this context.
Where
The XGBoost Classifier is an implementation of the Gradient Boosted Decision Trees methodology. Within this classifier model, weights play a crucial role as decision trees are constructed sequentially. The incorporation of weights allows independent variables to contribute to the final prediction, with the understanding that if the weights increase beyond a certain threshold, the initial prediction might be incorrect, necessitating the construction of a subsequent decision tree. Each individual tree in the ensemble is designed to make predictions that enhance the overall accuracy of the model. Equation (9) provides the mathematical expression that characterizes the XGBoost Classifier model within this context.
Where
The Voting Classifier operates as an ensemble machine learning algorithm that harnesses the collective wisdom of multiple models to make predictions. It assesses the likelihood of each class being the final outcome and anticipates the output class based on this likelihood. By aggregating the results of the classifiers provided as parameters to the voting classifier, it determines the output through majority voting. Equation (10) provides a mathematical representation that encapsulates the essence of the Voting Classifier, illustrating its methodology for arriving at a final prediction.
Where
Input:
Collect a performance dataset where previous appearances, previous titles, previous finals, and semi-finals played in the T20 World Cup are there. This dataset is collected from Wikipedia.
Collect a ranking dataset where the ICC ranking of major teams in T20 is given. The source of this dataset is the ICC official website.
Collect most of the international T20 matches from 2007 to 2020 from ESPN Cricinfo.
Fixtures of the 2022 T20 World Cup are collected from ICC’s official website.
Criteria (Factors):
This study takes into consideration the following factors which act as indirect inputs,
Previous Title: This indicates the number of times the team has won the titles. A team with more previous titles indicates that it is a formidable team and has a high chance of winning the tournament. Kampakis S. [9] analyzed 500 team and player performance statistics to predict outcomes from the English T20 game. Under team statistics, they considered the frequency of titles won by individual teams.
Previous Finals: This indicates the teams that have played the finals in the past years, which indicates the team’s capability to outplay all the rest teams and gain a good position. A team that qualified for the final, has a good enough chance to qualify for the finals this time as well.
Previous Appearances: This indicates the previous matches of the two teams and who had won between them. This helps to understand the winning probability of that team when they play against some particular team. Sankaranarayanan [1] used previous match fixtures for analysis of previous appearances to predict for ODI team winner prediction.
Semi-Finals Played: This indicates the number of times each team has played the semi-finals and their wins or losses. This helps to predict which of the two teams that are playing in the semi-finals has a higher probability of winning the game and qualifying for the finals.
ICC Rankings: This contains the ICC T20 rankings of the different teams. This indicates that the team with a higher position in the ranking has a higher probability of securing a good position or even winning the tournament. Yasir M. [11] took the ICC T20 ranking for the prediction of the winning team during the ongoing T20 game.
Output:
Predicted winner of the T20 World Cup.
Procedure:
Clean the T3 dataset by dropping some columns (Date axis, Margin axis, and Ground axis).
From T3, Team_1 and Team_2 columns are chosen as separate data frames with name features1 and features2. At the same time, the winner column is set to a new data frame with the name class_value.
In the next step, class_value is converted into label value as well and features1 and features2 values are transformed into a numeric value with the help of label encoding.
For better performance and balanced class distribution, the SMOTE method is used on numeric features1, features2, and class_value.
Two features value and class_value are split into two datasets. 20% dataset is used for the test dataset and the rest part is used for training data.
Then CART, random forest, Hist gradient boosting classifier, bagging, XGB, and voting techniques are applied for training the model.
Random Forest is applied with the parameters n_estimator
Similarly Decision Tree is used with the parameters criterion
Next, the Hist Gradient Boosting Classifier is used and fitted with training features and training class value as well.
The Hist Gradient Boosting Classifier is one of the popular classifier models. This model is applied in this study for a better accuracy rate. The parameter max_iter
A Bagging Classifier is also applied in this study. Bagging Classifier also gives a good accuracy rate.
Gradient Boosting Classifier is used in this study. It also gives a significant performance rate.
Another important classifier is the XGB Classifier. This classifier model is also used in this research to predict output as the winning team.
The last classifier is a hybrid classifier which is a voting classifier that combines logistic regression, SVC, and CART classifier. Then the model is fitted with training features and training class value.
Result:
The Random Forest classifier shows the best accuracy which outperforms compared to other models. The testing accuracy and training accuracy for Random Forest is 83.03% and 82.06%.
Other datasets like ranking datasets are tested with the model mentioned above. The winner is England.
Initially, our dataset is sourced from multiple online platforms, including the ESPN Cricinfo website, the ICC website, and Wikipedia. The data is collected and structured in CSV format. Since much of the data is in textual form, a crucial step involves transforming this textual data into a numerical format to facilitate the application of various machine learning algorithms. To achieve this conversion, we employ label encoding, which effectively transforms the textual data within the dataset into a numerical representation. Figure 1 provides an encompassing flowchart that illustrates the methodology employed for predicting the winning cricket team, outlining the key steps in this process.
This study and analysis consider four types of datasets in this work.
Dataset description
The first one contains the previous appearances, previous titles, previous finals, and semifinals played in the T20 World Cup. The dataset is named world_cup_t20_dataset.csv. Not to mention that the dataset is in CSV format. The data is collected from Wikipedia and public open media. No preprocessing is applied for the data set and it is used as it is. The considered attributes are Team, Group, Previous appearances, previous titles, previous finals, previous semifinals, and Current rank. The second dataset contains the ICC rankings of the teams. This dataset plays a main role in predicting the winner. The dataset is named icc_rankings.csv. This dataset is also in CSV format. The data is collected from the ICC official Website. No preprocessing is applied for the data set and it is used as it is. The considered attributes are Position, Team, and Points. The third dataset contains most of the international T20 matches from 2007 to 2020. The dataset is named final.csv. This dataset is in CSV format. The data is collected from ESPN Cricinfo. During the preprocessing of the dataset phase, the Margin and Ground columns are dropped from the dataset. All the rows that had Null of NaN values are eliminated, as they might create imbalance during model training and testing accuracy. The considered attributes are Date, Team_1, Team_2, and Winner. The fourth dataset contains the fixtures of the matches to be played for the T20 cricket World Cup in 2022. The dataset file is named fixtures.csv. The data is collected from the ICC official website. No preprocessing is applied to the data set and used as it is. The considered attributes are Round, Date, Stadium, Venue, Team_1, Team_2, Group, Result.
The chosen problem in this study revolves around multi-class classification, a domain where various machine learning models prove effective. Among the ensemble of classifiers suitable for such tasks, we have explored Logistic Regression, Random Forest, Decision Tree, Support Vector Machine, K-Nearest Neighbor, Gradient Boosting, Histogram Gradient Boosting, AdaBoost, XGBoost, Voting Classifier, and Bagging Classifier. Our study encompasses predictions conducted on all of these models, yielding promising outcomes. In this research, we focus on a comparative analysis of the top-performing eight classifiers that have exhibited the most promising results. These classifiers include Random Forest, Decision Tree, Gradient Boosting, Histogram Gradient Boosting, Bagging Classifier, XGBoost, Voting Classifier, and K-Nearest Neighbor. Among these models, Random Forest has emerged as the most accurate, surpassing other state-of-the-art classifiers. The study provides a comprehensive performance assessment and comparative insights for each of these models, presenting the results through informative tables and illustrative figures, which are detailed in the subsequent sections.
Table 1 offers a concise comparison of the training and testing set accuracies, along with loss metrics, for the diverse classifiers applied to our dataset. These metrics, including training accuracy, testing accuracy, and the loss function, are pivotal in comprehending the performance of the models. Figure 2 visually depicts the contrast in loss functions and their corresponding accuracies among different models. The loss function serves as a vital evaluation metric, shedding light on the functioning of the applied models. Figure 3 provides an insightful comparison of the performance of various machine learning algorithms, including Random Forest, Decision Tree, Gradient Boosting, Histogram Gradient Boosting, Bagging, XGBoost, and Voting Classifier. Among these models, Random Forest emerges as the leader, achieving an impressive training accuracy of 83.03% and testing accuracy of 84.06%, all while maintaining generalization performance (without overfitting).
Training and testing accuracy comparison of different classifiers
Graphical comparison of the loss function and the accuracy of different models.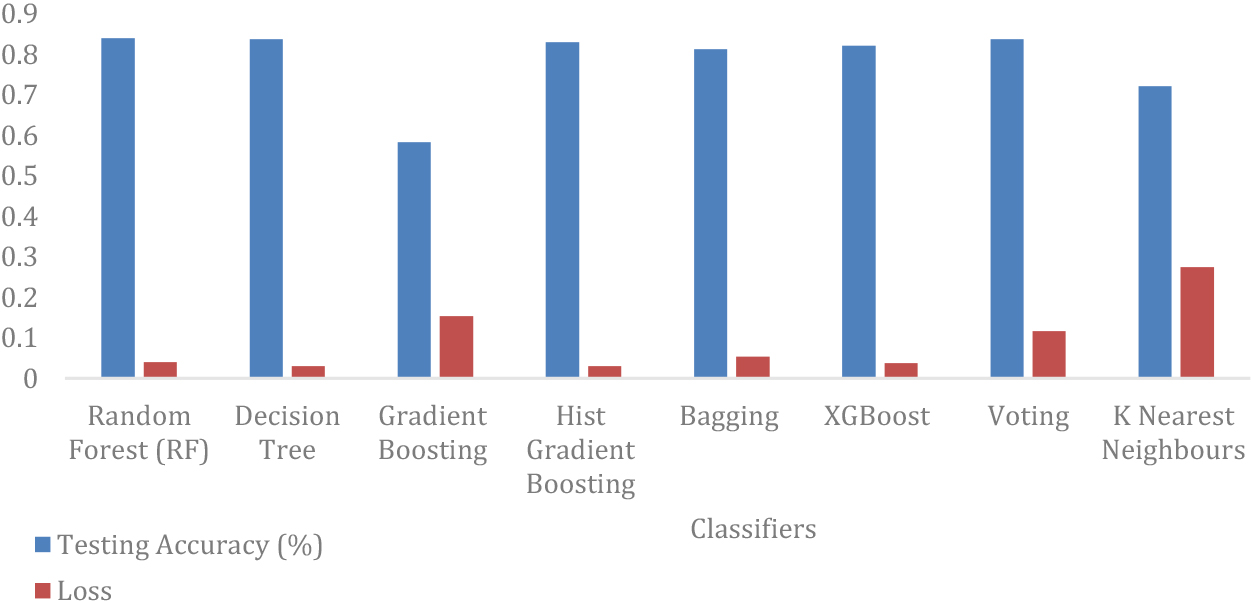
Graphical comparison of training and testing accuracy of different models.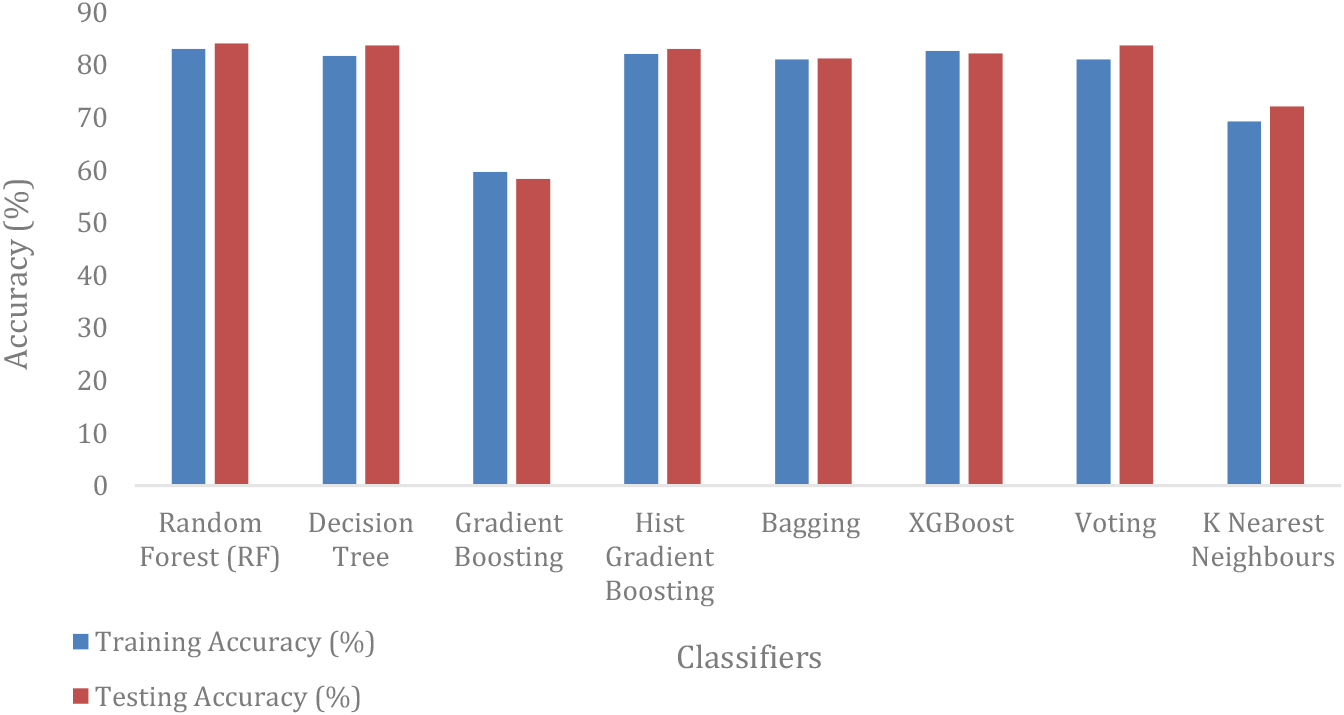
Table 2 presents important statistical inferences about the models used, including the Chi-Square test and
Chi-square test and
Execution time (sec) details of the various applied models
Decision-making analysis at each stage of the tournament.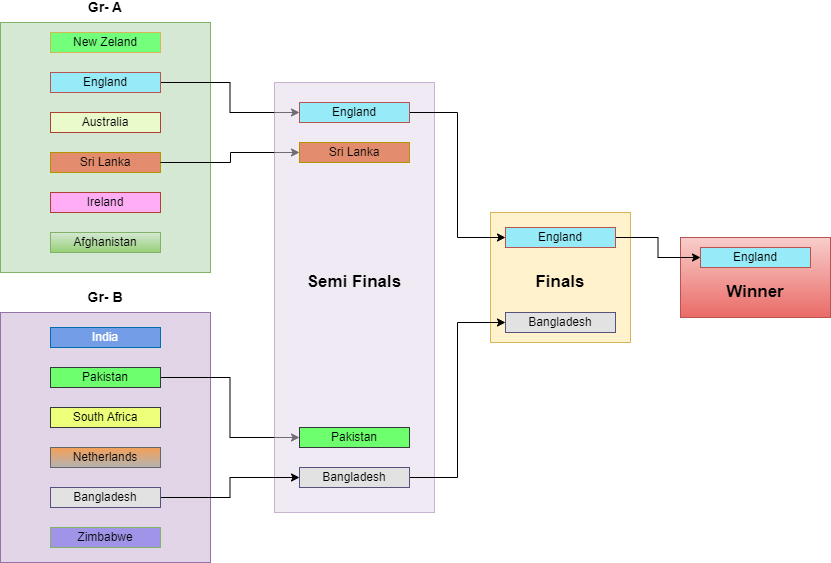
Precision, recall and F1 score analysis of different models
Execution time (sec) comparison.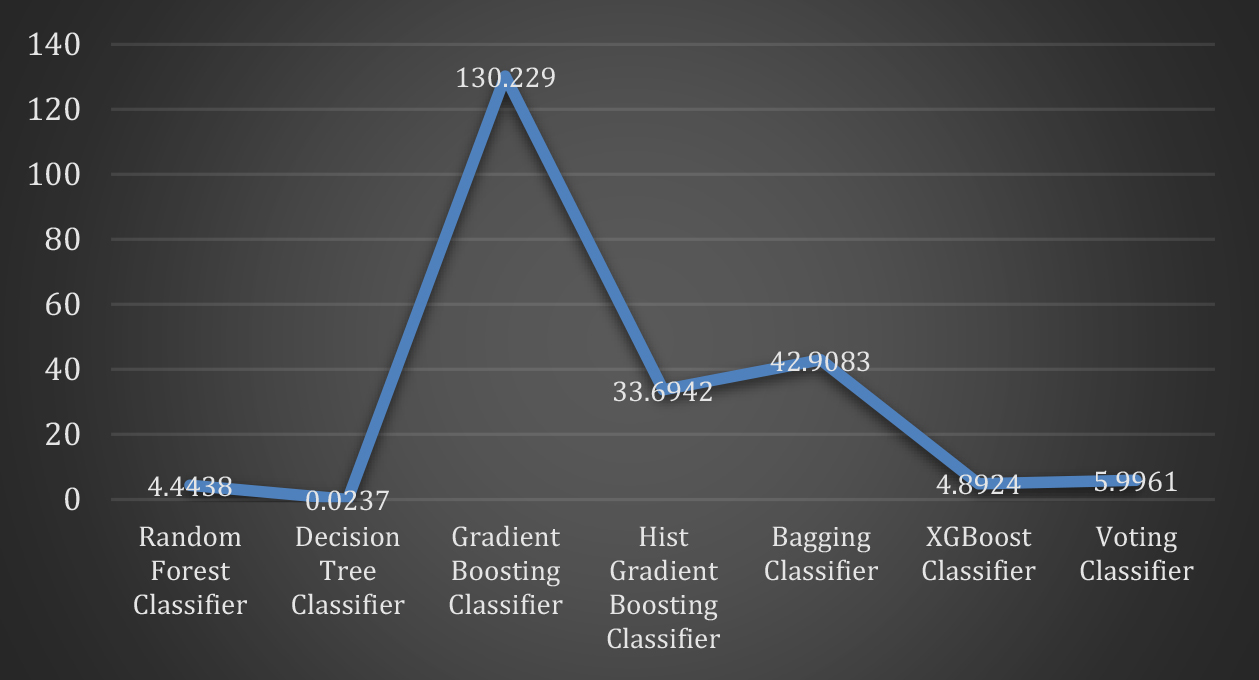
Graphical comparison among precision, recall, and F1 scores of different models.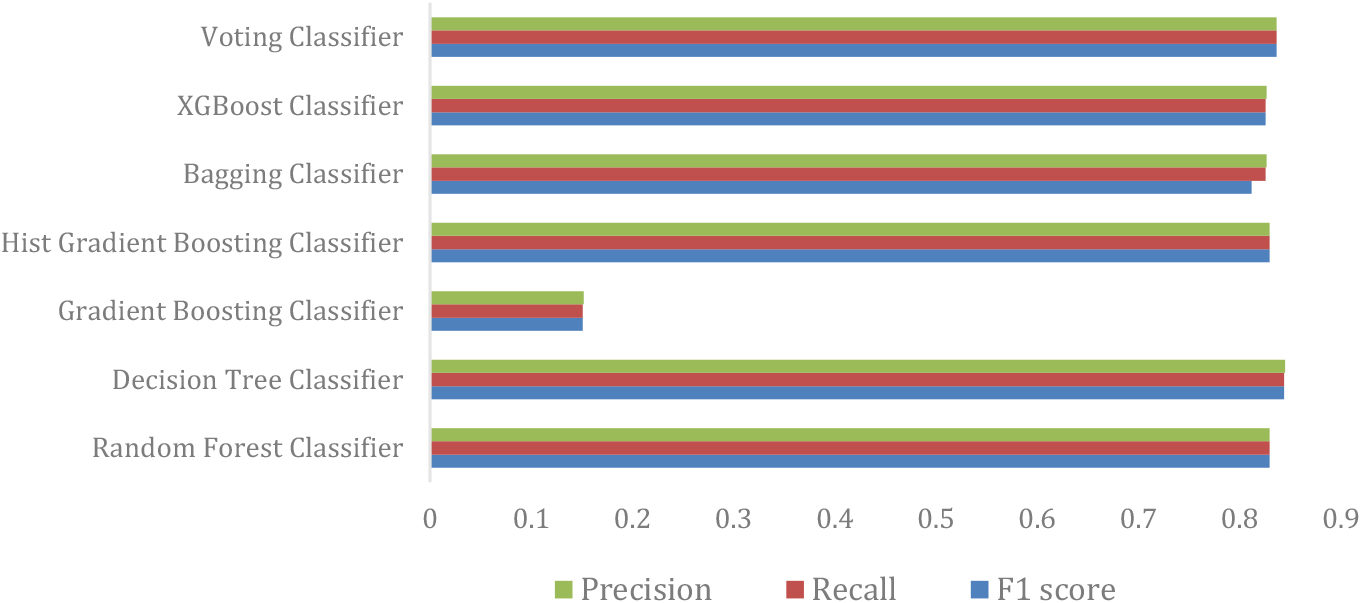
Figure 3 offers a visual representation of the entire T20 Cricket World Cup in 2022, from the Super 12 stage to the participating teams in the championship match. Throughout the Super 12 stage, the Random Forest algorithm is employed to predict the winner of each match. The study and model predict the semi-finalists as England, Sri Lanka, Pakistan, and Bangladesh, with the top two teams from each group advancing to the semi-finals. Subsequently, two semi-final winners are determined to vie for the championship title. As per the model’s predictions, England and Bangladesh are expected to compete in the 2022 T20 World Cup finals. The model’s forecast for the winner of the T20 Cricket World Cup 2022 is England. The decision analysis at each stage of the tournament is visualized in Fig. 4.
Table 3 provides insights into the execution times of various models employed in this study. The time
Comparison Analysis with some popular works
module is utilized to calculate these execution times. The process involves initializing a variable ‘start’ with time.time() before running each model, subsequently running the model, and finally initializing another variable ‘end’ with time.time(). The execution time is determined as ‘end-start,’ and these times are measured in seconds. Figure 5 visually represents the execution times, offering a graphical overview of the model runtimes.
Table 4 furnishes the precision, recall, and F1 scores for the various machine-learning models employed in this study. These scores are vital indicators of model performance and are graphically visualized in Fig. 6. Precision is defined as the ratio of True Positives (correctly classified positive samples) to the total number of classified positive samples (True Positives
We have conducted a comprehensive comparison of several models, considering various parameters such as the prediction objective, dataset, essential features, technology utilized, best accuracy model, and overall accuracy. Notably, this study goes beyond existing research by including additional critical metrics, including loss function, execution time, Chi-Square test results, and
In this study, we employ a diverse array of machine learning algorithms and methodologies to predict the winner of the T20 Cricket World Cup. As a case study, we utilize data relevant to the 2022 T20 World Cup for prediction purposes. The selected learning models include Random Forest, Decision Tree, Gradient Boost, Histogram Gradient Boost, Bagging Classifier, XGBoost, and Voting Classifier. Notably, among these well-established models, the Random Forest Classifier stands out, achieving a commendable accuracy of 83.03% during the training phase and further improving to 84.06% during the testing phase. The culmination of our predictive analysis revealed that England, Sri Lanka, Pakistan, and Bangladesh emerged as the top four T20 teams, securing their positions in the semi-finals of the T20 Cricket World Cup. Subsequently, England and Bangladesh advanced to the finals, with England ultimately emerging as the triumphant team in the championship match. The set of future works are listed below,
While our study primarily focuses on the T20 format, future researchers have the opportunity to extend this work to predict outcomes in other forms of cricket, including One-day Matches and Test Matches. The methodologies and insights gained from our study can serve as a valuable foundation for exploring predictive analytics in a broader spectrum of cricket formats In the future, Kabaddi, and more. It’s important to note that the implementation of these techniques may vary significantly from one sport to another researchers may explore the application of classification techniques in various other sports such as Football [30], Basketball, as each sport possesses its own unique set of characteristics and dynamics. To obtain more reliable results and accurate prediction, we can include more useful features for the training purpose of the models in the future. In the future, we have the potential to incorporate additional parameters such as weather conditions and humidity, which are known to influence the performances of both teams. These supplementary factors can enhance the accuracy of our predictions, offering a more comprehensive and precise outcome forecast.
In conclusion, this work contributes significantly to the field of sports analytics and cricket match prediction by advancing prediction accuracy, conducting comparative analyses, utilizing diverse data sources, employing statistical testing, analyzing execution times, and offering comprehensive evaluation metrics. These contributions enhance the understanding and application of machine learning in the domain of sports prediction.
Footnotes
Conflict of interest
The authors declare no conflict of interest.
Funding
There is no funding involved for this work.