
Abstract
BACKGROUND:
The Stephen Beck Jr. Achieving a Better Life Experience Act of 2014 (ABLE Act) authorized state-administered tax-preferred savings programs for individuals with a disability called ABLE accounts.
OBJECTIVE:
Examine ABLE account participation rates and amounts held by Supplemental Security Income (SSI) recipients who are eligible for ABLE accounts and use the findings to identify methods to improve ABLE account participation.
METHODS:
Descriptive analysis using Social Security program data on the population of SSI recipients eligible for ABLE accounts to quantify: the prevalence of ABLE account use; participation rates among those eligible for ABLE accounts by demographic and socio-economic characteristics, state of residence, and state-level tax incentives; and amounts accumulated in ABLE accounts.
RESULTS:
As of December 2021, 36,610 SSI recipients owned ABLE accounts with a median value of $3,222, and the participation rate is 1.1 percent among SSI recipients whose disability occurred before age 26. We document substantial differences in participation rates by demographic and socioeconomic characteristics, across states, and by the availability of state-level tax incentives.
CONCLUSION:
ABLE account use among SSI recipients is relatively low. Differences in participation rates indicate that evidence-based methods to increase participation can improve savings and economic well-being.
Introduction
Americans with disabilities are more likely to be poor or near poor than those without a disability (Brucker et al., 2015; Paul et al., 2020). While the Supplemental Security Income (SSI) program and Medicaid provide important sources of income and healthcare for people with disabilities, the benefits and eligibility rules can discourage the work activity and savings needed to achieve economic mobility (Hubbard et al., 1995; Powers, 1998; Stapleton et al., 2006; Duggan et al., 2015). For example, the SSI program uses income and resource limits to determine eligibility, and the resource limits (including financial assets) of $2,000 for individuals and $3,000 for couples have not changed in over 30 years. Assets above these levels will generally lead to the loss of SSI eligibility and may affect access to Medicaid, which can be a disincentive to accumulating savings.
We examine the use of programs to promote savings among people with disabilities that are specified in the Stephen Beck Jr. Achieving a Better Life Experience Act of 2014 (ABLE Act). The ABLE Act authorized state-administered tax-preferred savings programs, similar to 529 plans available for college savings, for individuals with a disability called ABLE accounts. The law specified two purposes of ABLE accounts. One is to encourage individuals and families to set aside funds that individuals with a disability may use to maintain their health, independence, and quality of life. The other is for the accounts to be a secure source of funding for disability-related expenses such that the funds supplement, and not replace, benefits provided through other sources including private insurance, Medicaid, and the SSI program.
The ABLE Act includes provisions that allow an individual with a disability, as well as family members and friends, to make large contributions to the individual’s ABLE account that do not count against SSI eligibility. SSI is a means-tested program that provides monthly cash payments, and, in most states, it also provides eligibility for Medicaid to people with a disability or blindness, or who are 65 and older. 1 To be eligible for SSI, one must also have limited income and resources. Individuals whose disability began before age 26 may accumulate up to $100,000 in ABLE accounts that do not count toward the SSI resource limits of $2,000 for individuals and $3,000 for couples. 2 Thus, ABLE accounts allow SSI recipients to save financial resources to use later for qualified disability expenses while maintaining eligibility for SSI monthly payments and Medicaid. Qualified disability expenses are defined broadly to include basic living expenses and are not limited to items for which there is a medical necessity, or which solely benefit a person with a disability.
ABLE account holders may qualify for tax breaks at both the federal and the state levels. While contributions to an ABLE account are not tax deductible for federal income tax purposes, the earnings from the account are not taxed if distributions are used for qualified expenses. Since tax year 2018, individuals may potentially receive a non-refundable federal tax credit, called the Saver’s Credit, of up to $1,000 (or $2,000 if married filing jointly). 3 Those eligible for an ABLE account may rollover funds from Section 529 qualified tuition plans into an ABLE account without incurring penalties. As of December 2021, 21 states offer state-level tax incentives.
Our examination of ABLE accounts focuses on SSI recipients and relies on Social Security Administration (SSA) program data. We find that 58,110 SSI recipients owned an ABLE account since they were first available in 2016 through December 2021. As of December 2021, 36,610 SSI recipients receiving SSI cash payments (in current pay status) held ABLE accounts with a median value of $3,222. The median amount for an additional 5,630 individuals, whose income is sufficiently high to have become ineligible for an SSI payment, is higher at $5,280. We show that the participation rate for SSI recipients in current pay status who are eligible for ABLE Accounts is 1.1 percent, and that there are substantial differences by demographic and socioeconomic characteristics, across states, and by the availability of state-level tax incentives.
We use the results of our analysis, as well as findings from other research, to assess potential strategies for increasing ABLE account use among SSI recipients, while acknowledging that a limiting factor preventing some SSI recipients from ABLE participation is not having sufficient funds to set aside in a savings account. The strategies include developing more effective outreach materials, changing the financial incentives to contribute to ABLE accounts, and implementing program simplification and technical assistance.
The paper is organized as follows: We provide background information about the SSI program, summarize the rules for establishing ABLE accounts and provide additional summary information on the ABLE account programs. Next, we describe the data and analytical methods, and summarize the results for this study. Finally, we describe the implications of our findings for research on improving ABLE account participation rates.
The SSI program
The SSI program provides monthly payments to adults and children with a disability, or who are blind, and who have limited income and resources. 4 For adults, a disability is defined as “the inability to do any substantial gainful activity by reason of any medically determinable physical or mental impairment which can be expected to result in death or which has lasted or can be expected to last for a continuous period of not less than 12 months.” Substantial gainful activity (SGA) refers to a person’s capacity to work and is generally determined by a person’s ability to earn above a specified monthly amount that in 2021 is $1,310 for the non-blind and $2,190 for the blind. These earnings amounts are indexed each year by the national average wage index. 5 A different disability definition is used for children. A child must have “a medically determinable physical or mental impairment or combination of impairments that causes marked and severe functional limitations, and that can be expected to cause death or that has lasted or can be expected to last for a continuous period of not less than 12 months.” In 2019 about 53 percent of SSI applicants under age 18 with a medical decision met the disability standard and about 45.7 percent of SSI applicants ages 18-64 met the disability standard (Social Security Administration, 2021b).
The SSI limits for “countable resources” are $2,000 for individuals and $3,000 for couples. These amounts are not indexed and have not changed since 1989. Resources are items that one owns such as cash, bank accounts, stocks, land, life insurance, vehicles, and personal property. Sometimes, resources that belong to a spouse, parent, or other people are deemed to be counted as a resource for the person who applies for or is receiving SSI. Some resources are not counted when determining eligibility. In addition to ABLE accounts with amounts less than or equal to $100,000, some of the other resources not counted include: the home one lives in and the land it is on; one vehicle, regardless of value, if used for transportation; household goods and personal effects; life insurance policies with a combined face value of $1,500 or less; burial spaces for self or immediate family; burial funds for self or spouse, each valued at $1,500 or less; property used by self or spouse in a trade or business, or on a job if working for someone else; special needs trusts; Individual Development Accounts (IDAs); and if disabled or blind, money or property set aside under a Plan to Achieve Self-Support (PASS). 6
The amount of a person’s countable income is used to determine the SSI payment amount. The SSI payment amount is also determined by the Federal Benefit Rate (FBR), which in 2021 are monthly amounts of $794 for individuals and $1,191 for couples. The FBR is indexed each year by the Consumer Price Index for Wage Earners and Clerical Workers (CPI-W). Some states offer additional payment amounts called state supplements. The types of income that are used to determine SSI countable income include: unearned income, earned income, in-kind income, and deemed income. Some types of earned and unearned income are not counted. A $20 income exclusion is subtracted from unearned income sources that are countable to determine the amount of countable unearned income. Countable earned income is determined by subtracting from earned income a $65 earned income exclusion amount plus any remainder of the $20 unearned income exclusion amount, and then counting only $0.50 for each $1 from the remaining amount. The SSI payment amount is computed as the applicable Federal Benefit Rate minus the total amount of countable income from each source, and then added to any applicable state supplement amount.
The SSI program includes several special provisions called work incentives that are designed to support SSI recipients who want to work. 7 Among them, one is noteworthy for our analysis. Section 1619(b) of the Social Security Act allows an individual to maintain Medicaid eligibility when earnings are high enough to preclude any SSI payment but are not sufficient to provide a reasonable equivalent of the SSI, social services, and Medicaid benefits that the individual would have in the absence of earnings, and whose ability to continue working would be seriously inhibited by the loss of social services and Medicaid benefits. Individuals who are in 1619(b) status are not counted as “in current pay” because they are not receiving an SSI payment, but they maintain an attachment to the SSI program, and they regain payments in months when earnings fall to a point where countable income is below the FBR.
SSI recipients who receive income or obtain resources that preclude an SSI payment, or who medically recover from their disabling health condition, are no longer considered to be SSI recipients “in current pay.” Those classified as “in non-pay status” due to excess income are people who qualify for the 1619(b) provisions or whose other income exceeds the income limits. Those classified as “in non-pay status” due to excess resources are those whose resources exceed the resource limits. There are a variety of other reasons a person may be classified “in non-pay status,” which we refer to as “other.” For those in non-pay status, SSI payments to the recipient are reinstated beginning the first month that SSA determines the person meets all requirements for eligibility within a 12 consecutive month period. If the nonpayment status has continued for 12 consecutive months, the record will be terminated unless an appeal is pending, or an appeal decision has recently been made. Once a final unfavorable decision is made on a person’s eligibility status, they have their SSI eligibility terminated and are classified as “terminated”.
ABLE accounts
ABLE accounts are designed to help people with disabilities and their families save and pay for disability-related expenses. An ABLE account holder may choose among different investment options that provide different rates of return. 8 Distributions, including earnings, are tax-free to the designated beneficiary if used to pay for qualified disability expenses. Qualified disability expenses are expenses that relate to the blindness or disability of the designated beneficiary of the ABLE account and are for the benefit of maintaining or improving his or her health, independence, or quality of life. Qualified disability expenses include basic living expenses and are not limited to items for which there is a medical necessity, or which solely benefit an individual with a disability. Such expenses include but are not limited to: the beneficiary’s education; housing; transportation; employment training and support; assistive technology and related services; personal support services; health, prevention, and wellness; financial management and administrative services; legal fees; expenses for oversight and monitoring; and funeral and burial expenses.
ABLE accounts mitigate some of the barriers for people with disabilities to save. SSI recipients may have up to $100,000 in an ABLE account without it counting as a resource to determine SSI eligibility. It may also preserve their Medicaid eligibility, as ABLE account amounts never count as a resource for Medicaid and other means-tested programs even if the amounts are above $100,000. Prior to the ABLE Act, people with financial resources risked having to forfeit eligibility for government programs like SSI and Medicaid unless their family could set up a special needs trust which can be costly to create and administer, or a PASS plan. 9 Special needs trusts have some advantages such as no limit on the amount of funds that can be gifted to the trust; however, income generated by the trust not paid to the trust beneficiary could be subject to high tax rates. 10 Income earned on ABLE accounts is not taxed and distributions are not taxed if spent on qualified disability expenses, which include a broad range of expenses. ABLE accounts are easier to create, and the individual can access funds directly, unlike a trust where trustee approval is needed.
ABLE accounts are available for all qualified United States citizens and legal residents. To be eligible for an account, the account owner must have a disability that began before age 26. The requirements for proving the disability began before age 26 vary by state. Proof could be receiving Social Security Disability Insurance (DI) or SSI based on disability or blindness and the established onset date is before age 26. 11 For some State plans, one can self-certify their disability or have a physician complete a form certifying that the disability began before age 26.
A qualified individual can have only one account at a time. The eligible person with a disability is the owner of the account; however, an authorized legal representative can set up an account for a beneficiary. The beneficiary and others can contribute money to the account up to the $15,000 annual 2021 contribution limit; and up to a maximum account value ranging from $250,000 to $550,000 over the life of the account depending upon the state program. 12 The annual contribution limit is tied to the federal gift tax exclusion. A qualified individual who works can contribute funds from their earnings in addition to the $15,000 annual contribution limit. A qualified individual who works can contribute any amount of their current tax year’s compensation up to a maximum amount that is equal to the poverty line for a one-person household. For 2021, the maximum amount is $12,760 for residents of the 48 contiguous states; $15,950 for Alaska; or $14,680 for Hawaii. However, individuals who work are not eligible to make such additional contributions if they or their employers contributed to: (1) a 401(a) defined contribution plan or 403(a) annuity contract; (2) a 403(b) annuity contract; or (3) a 457(b) eligible deferred compensation plan.
There are two situations where qualified individuals may rollover funds from other accounts: (1) all or some funds from one ABLE account can be distributed, or rolled over, to another ABLE account of the original beneficiary’s family, and (2) a limited amount from a qualified tuition plan (also called a 529 plan) can be rolled over into an ABLE account. Amounts rolled over from a qualified tuition plan count toward the $15,000 annual contribution limit that applies to the ABLE account.
As of December 2021, 46 states and the District of Columbia have implemented ABLE account programs. Four states do not have their own ABLE account programs: Idaho, North Dakota, South Dakota, and Wisconsin. Residents of these four states may enroll in ABLE account programs administered by other States whose rules permit non-residents to participate. 13
For some people with a disability, there are additional financial incentives to participate in ABLE accounts. Those with low to moderate incomes are eligible for a non-refundable federal tax credit referred to as the Saver’s Credit. 14 The Saver’s Credit varies by adjusted gross income (AGI), and those in the lowest income bracket may receive a credit equal to 50%of their ABLE contribution. The rate declines for those with higher AGI, and in 2021 it is phased out completely for married filers with AGI above $66,000, head of household filers with AGI above $49,500, and all other filers with AGI above $33,000. In addition, 21 States include state-level tax incentives for participation as of December 2021. In October 2021, Nevada allocated $5,000,000 to a newly established grant program in the state called Transforming Opportunities for Toddlers and Students (TOTS) designed to increase ABLE account participation by providing generous “seed money.” Those eligible for a TOTS grant can receive $5,0000 for their ABLE account, where eligibility includes being a resident of Nevada, under the age of 18, have a disability that qualifies for ABLE accounts, and have been negatively impacted by the COVID-19 pandemic.
Another innovative feature of ABLE accounts is that other individuals can contribute to another individual’s account. Some States’ plans provide an online gifting option for an ABLE account, where a beneficiary may set a financial goal and ask friends and family to contribute towards their goal. Anyone with the link to the beneficiary’s gifting web page can contribute online to the account until the goal is met. For some states with an income tax, the individual’s contributions could be eligible for a state income tax deduction or a state income tax credit.
When ABLE account funds exceed $100,000, and the excess ABLE funds plus other resources exceed the SSI resource limits, SSI payments will be suspended until resources are at or below the limit. Although the IRS considers housing to be a qualified expense for ABLE accounts, the ABLE Act specifies an exception that ABLE account distributions for housing cannot be disregarded when determining eligibility for SSI. Under normal SSI rules, the amount of resources counted toward the limits is the amount as of the first moment of each calendar month. Therefore, a distribution for housing expenses would not be counted only if the distribution was received and spent during the same month.
Upon a beneficiary’s death, any ABLE account funds that remain after paying outstanding qualified disability expenses and funeral expenses could be required to pay back Medicaid for all Medicaid benefits received. This would reduce the remaining amount available to be distributed to the account holder’s legal beneficiaries. However, some states are not applying this payment. For example, effective November 13, 2020, Nebraska will not file a claim against an estate to pay back Medicaid.
Method
We use data from SSA’s Modernized SSI Claim System (MSSICS) to identify SSI recipients who own an ABLE account. For over 88 percent of the ABLE accounts recorded in MSSICS, SSA obtains the data directly from States via a monthly data exchange and automatically stores the data in MSSICS. SSA employees obtain data directly from an SSI applicant or recipient for a little under 12 percent of ABLE accounts recorded in MSSICS. 15 The data is considered pending until an SSA employee makes an SSI eligibility determination, either at the initial award or during an SSI redetermination, at which point it is classified as cleared. For both cleared and pending cases, MSSICS includes the date the account was opened, the date it was closed, and the state where the ABLE account is administered. It also includes data on the excluded amount held within the ABLE account, defined as the amount that does not count against the SSI resource limits. In our analysis, we include both cleared and pending cases, and we use the excluded amount held in the ABLE account.
We merge the MISSICS data on ABLE accounts with data from the Supplemental Security Record (SSR) to identify SSI recipients in different payment status categories as of December 2021. The SSR maintains data on the date of birth, date of disability onset, the primary diagnosis identified for SSI eligibility, current payment status, the monthly payment amount, the state of residence, and other data needed to administer the SSI program. We also merge in data from the SSA Numident file which contains data on sex, race, and ethnicity that is collected on a voluntary basis as part of the process of issuing social security number cards. 16 We obtain additional data on race and ethnicity from the Race and Ethnicity Collection System (RECS). 17
For our descriptive analysis, we document the number of SSI recipients with an ABLE account by year. We construct participation rates by restricting the population to SSI recipients who are either in current pay status or who are in non-payment status due to excess income as of December 2021 and with an age of disability onset that is used for determining SSI program eligibility that is under 26 years old. This is generally consistent with the age requirements for ABLE account eligibility, and almost 90 percent of SSI recipients with an ABLE account have an age of onset that is under age 26. 18 The participation rate is computed as the number of SSI recipients with an ABLE account in our ABLE eligible population divided by the total number of SSI recipients in our ABLE eligible population. We estimate participation rates within subgroups of the SSI recipients in our ABLE eligible population using the same formula for each defined sub-population.
We examine the association between state-level income tax incentives and ABLE account participation rates by examining differences in ABLE account participation rates and the distribution of amounts held within ABLE accounts as of December 2021. To do so, we compute the participation rates for SSI recipients who reside in a state with state income tax incentives and for SSI recipients who reside in states without such incentives. We also examine whether there is an association between state tax incentives and the distribution of amounts held in ABLE accounts. We compare differences in the average (mean) amounts held within ABLE accounts between individuals residing in states with state-level ABLE account tax incentives and those residing in states without such incentives, and we also compare differences by decile in the ABLE account amounts distribution. We interpret the difference as purely correlational and we emphasize the need for additional studies to identify whether there is a causal relationship and the relative importance of the mechanism (e.g., financial incentive versus informational).
We build on our descriptive statistics using logistic regression models where our dependent variable is set equal to 1 if the person has an open ABLE account as of December 2021 and 0 otherwise. Our explanatory variables include demographic characteristics, primary diagnoses, socioeconomic characteristics, and an indicator for residing in a state with state-level tax incentives. We estimate odds ratios to assess the influence of state income tax incentives on ABLE account participation, as well as the other explanatory variables in our model. Our logistic regression results account for the relationships between the explanatory variables in our model and ABLE account participation.
Results
We find that the use of ABLE accounts among SSI recipients has increased over time from 7,760 accounts opened during the 2016–2017 period to a total of 58,110 accounts opened by December 2021. The column labeled ABLE Accounts Opened (column 1) in Table 1 shows the increase in the number of new ABLE accounts opened each year. 19 From 2020 to 2021, the number of newly opened ABLE accounts increased from 13,444 to 16,528, or by about 23 percent. The percentage change in ABLE accounts between 2020 and 2021 exceeds the percentage change in SSI recipients, indicating an increase in the ABLE account participation rate among SSI recipients during the period.
Only 5,140 SSI recipients closed their most recent account by the end of the period, as shown in the last row of the column labeled Able Accounts Closed (column 2) in Table 1. The cumulative number of SSI recipients with an open ABLE account rose from 7,667 at the end of 2016–2017 period to 52,970 as of December 2021 (column 3). From 2020 to 2021, the total number of SSI recipients with an open account increased by 37 percent from 38,579 to 52,970. The 52,970 SSI recipients with an open ABLE account make up nearly half of the 112,021 individuals with a disability who own an ABLE account as of December 31, 2021. 20
Incidence and prevalence of ABLE accounts among SSI recipients
Incidence and prevalence of ABLE accounts among SSI recipients
Source: Authors’ calculations from Social Security Modernized SSI Claim System (MSSICS) data.
Of the 52,970 individuals with a record of receiving SSI who have an open ABLE account as of December 2021, Table 2 shows that 36,610 (69.1%) are eligible to receive a monthly SSI payment (i.e., are in “current pay”), 7,779 (14.7%) are temporarily ineligible to receive a monthly SSI payment but have not had their SSI eligibility terminated (i.e., are in “non-payment status”), and 6,498 (12.3%) have had their SSI eligibility ceased (i.e., are in “terminated status”). 21 For the two groups that we will focus on in the remainder of the paper, those in current pay status and those who are in non-pay status due to excess income, the percentage whose ABLE account participation is identified through an automated data exchange with SSA is 88.6 percent and 89.7 percent, respectively.
ABLE account use by SSI payment status as of December 2021
Note: Indented rows are subsets of in non-pay status. Source: Authors’ calculations from Social Security Modernized SSI Claim System (MSSICS) data linked to the Supplemental Security Record (SSR).
Most individuals with ABLE accounts have an SSI disability onset before the age of 26, which is consistent with the ABLE account eligibility rules. While the definition of disability used for ABLE accounts is not limited to an SSI disability determination, the fact that almost 90 percent of SSI individuals with an ABLE account have an SSI disability onset age that is consistent with the ABLE rules, as shown in the last three columns of Table 2, indicates that there is a significant overlap. For our participation rate analysis, we restricted the study population to those whose SSI disability onset occurred before turning 26 years old. 22
The amounts held in ABLE accounts are substantial. The lower half of Table 3 shows that for SSI recipients in current pay status and with a disability that began before age 26, 62.1 percent have ABLE account amounts that exceed the $2,000 SSI limit for individuals and 52.3 percent have amounts that exceed the $3,000 SSI limit for couples. The mean amount for SSI recipients in current pay status is $6,802.07 which is lower than the mean amount for all ABLE account owners of $9,321. 23 We also show the amounts held at each decile of the distribution, which range from $30.00 at the 10 percentile to $3,254.69 at the 50th percentile (median) to $16,311.26 at the 90th decile. The amounts held are larger for those in non-payment status for any reason, and they are even larger for the subset of those in non-pay status due to excess income. For those in non-pay status due to excess income, Table 3 shows that 70.0 percent have amounts that exceed the SSI limit for individuals and 63.5 percent have amounts that exceed the SSI resource limit for couples. Table 3 also shows that the mean amount held within ABLE accounts is $9,442.32 for those in non-pay status due to excess income which is slightly larger than the mean amount reported for all ABLE account owners of $9,321. The amounts held by those in non-pay status due to excess income are $79.86 at the 10th percentile of the distribution, $5,358.63 at the 50th percentile (median), and $23,155.50 at the 90th percentile.
ABLE account amounts as of December 2021 for SSI recipients
Source: Authors’ calculations using SSA program data from the Modernized Supplemental Security Income Claims Systems (MSSICS) linked to the Supplemental Security Record (SSR).
The ABLE account participation rate for SSI recipients with a disability onset under the age of 26 and who are receiving SSI payments as of December 2021 is 1.1%(Table 4a). However, there is considerable variation in ABLE account participation rates within specific segments of the SSI recipient population, as shown in Table 4b. SSI recipients with a disability onset date of age 18 through age 25 have higher participation rates (2.2 percent) when compared to those whose onset occurred before age 18 (0.7 percent). This difference is consistent with the way that a disability onset date is determined. For those who do not receive SSI payments as children because their families do not meet the income and resource tests, the earliest onset date they are likely to have in SSA records is age 18, regardless of the age when their disabling health condition began. Thus, those who become eligible for SSI payments at age 18 or after because their parents’ income and resources are no longer counted toward SSI eligibility are more likely to have greater family resources that may be contributed to ABLE accounts. SSI recipients ages 18 through 25 as of December 2021 have the highest participation rates (2.5 percent) when compared to all other age groups, and those under age 18 as of December 2021 have the lowest participation rates (0.2 percent). Like the findings for disability onset date, this reflects the relatively more limited resources that families with an SSI recipient under age 18 must have to qualify for SSI child payments.
ABLE account participation rates for SSI recipients in current pay status in December 2021, disability onset under age 26
Source: Authors’ calculations from Social Security Modernized SSI Claim System (MSSICS) data linked to the Supplemental Security Record (SSR), Numident, and Race and Ethnicity Collection System (RECS).
ABLE account participation rates for SSI recipients in current pay status in December 2021 by primary diagnosis, disability onset under age 26
Source: Authors’ calculations from Social Security Modernized SSI Claim System (MSSICS) data linked to the Supplemental Security Record (SSR), Numident, and Race and Ethnicity Collection System (RECS).
While there are no differences in ABLE participation rates between males and females, our exploratory analysis of the limited race and ethnicity data shows substantial differences, and we also find substantial differences by preferred spoken language. Among the limited number of SSI recipients who report race and ethnicity, participation rates are much lower than 1.1 percent for those who report their race as Black (0.5 percent) and those who report their ethnicity as Hispanic (0.4 percent). The rates are even lower (0.2 percent) for those with limited English proficiency, defined as a spoken language preference that is not English, and it is only 0.1 percent for those who identify Spanish as their preferred spoken language. This analysis is considered exploratory because of the large proportion of SSI recipients (45.5 percent) and those with ABLE accounts (50.9 percent) that have an unknown race.
Over 70 percent of ABLE account participants have one of the following four primary diagnosis used to determine SSI eligibility: (1) congenital anomalies; (2) autism spectrum disorders; (3) intellectual disorders; and (4) diseases of the nervous system and sense organs. Table 4b shows that the participation rates for each of these groups are higher than the participation rate of 1.1 percent among SSI recipients receiving an SSI payment. These types of primary diagnoses are generally lifelong impairments with strong advocacy and parental support groups. Information and resources needed to establish ABLE accounts may be more readily available for these groups, which can contribute to the relatively high participation rates.
ABLE account participation rates are highest among those with relatively strong attachments to employment. Table 4c shows that for the 22.5 percent of SSI recipients with at least one occurrence of earned income in the SSI program data (i.e., at least one month with earnings counted against their SSI payment), the participation rate is 2.5 percent. Table 4c also shows that the participation rate increases with work experience, as measured by the number of earned income occurrences (i.e., generally amounting to months with recorded earnings) within the SSI program data. For the 1.9 percent of ABLE eligible SSI recipients currently receiving SSI payments and who have 61 or more occurrences of earned income (i.e., greater than five years-worth of earnings), the ABLE account participation rate is 5.0 percent.
ABLE account participation rates for SSI recipients in current pay status in December 2021 by socio-economic status, disability onset under age 26
Source: Authors’ calculations from Social Security Modernized SSI Claim System (MSSICS) data linked to the Supplemental Security Record (SSR), Numident, and Race and Ethnicity Collection System (RECS).
The positive relationship between ABLE account participation rates and earned income occurrences could be due to a positive relationship between ABLE account participation rates and SSI tenure, where SSI tenure is defined as the number of years between the date of SSI payment eligibility and December 31, 2021. This is because earned income occurrences generally only begin to be recorded around the time of SSI payment eligibility, and those within a year of SSI payment eligibility do not have over 60 occurrences of earned income in our data. However, we show an inverse relationship between SSI tenure and ABLE account participation for those with over one year of SSI tenure. ABLE account participation rates are 1.3 percent for those with less than a year of SSI tenure, rise to 1.7 percent for those with between one and three years of tenure, and then steadily decline to 1.0 percent for the 75.6 percent of SSI recipients who have more than 5 years of SSI tenure. Thus, the positive relationship between ABLE account participation rates and work experience does not appear to be driven by a positive relationship between ABLE account participation and program tenure.
We do not find large differences in participation rates across two other socioeconomic characteristics. Our results show that SSI recipients in current pay who are also receiving DI payments have a somewhat higher participation rate of 1.4 percent. We also find that those with between one and four occurrences of unearned income have a participation rate of 1.2 percent compared to 1.0 percent for those with no occurrences and 1.0 percent for those with 5 or more occurrences. For unearned income, the dollar reduction in SSI payments for every dollar of unearned income after a $20 unearned income exclusion may not leave significant additional income for savings. Thus, these findings are consistent with the different treatment of unearned income in the SSI program when compared to the treatment of earned income.
For SSI recipients who are in non-payment status in December 2021 due to excess income, the participation rate is 2.6 percent as shown at the top of Table 5a. The higher participation rate when compared to those who are currently receiving SSI payments is consistent with a greater capacity for savings among those with higher income levels. For almost all the subgroups, the participation rates are higher as shown in Tables 5a through 5c when compared to the corresponding rates for those in current pay status shown in Tables 4a through 4c. We note that the patterns are broadly like those in Table 4.
ABLE account participation rates for SSI recipients in non-pay status due to excess income in December 2021 by demographics, disability onset under age 26
Source: Authors’ calculations from Social Security Modernized SSI Claim System (MSSICS) data linked to the Supplemental Security Record (SSR), Numident, and Race and Ethnicity Collection System (RECS). Note: Other race category is combined with unknown race category due to small number of cases.
ABLE account participation rates for SSI recipients in non-pay status due to excess income by primary diagnosis, disability onset under age 26
Source: Authors’ calculations from Social Security Modernized SSI Claim System (MSSICS) data linked to the Supplemental Security Record (SSR), Numident, and Race and Ethnicity Collection System (RECS).
The participation rates among SSI recipients who are in non-payment status due to excess income increase with work experience. We find that for those with no work experience while receiving SSI payments the participation rate is only 1.0 percent, but that the rate steadily increases with work experience and reaches 7.2 percent for those with 61 or more months of earnings. The average among SSI recipients in non-payment status due to excess income and with earnings in at least one month is 4.1 percent. We note that Table 5c also shows a positive relationship between ABLE account participation rates and SSI tenure, which may explain part of the positive relationship between ABLE account participation rates and occurrences of earned income in SSI records.
ABLE account participation rates for SSI recipients in non-pay status due to excess income by socio-economic status, disability onset under age 26
Source: Authors’ calculations from Social Security Modernized SSI Claim System (MSSICS) data linked to the Supplemental Security Record (SSR), Numident, and Race and Ethnicity Collection System (RECS). Note: Other race category is combined with unknown race category due to small number of cases.
Other economic characteristics are also associated with relatively higher ABLE account participation rates for those in non-pay status due to excess income. Individuals who concurrently receive DI payments have an ABLE account participation rate of 4.0 percent. ABLE account participation rates are also positively related to occurrences of unearned income in SSA program records.
There are differences in ABLE account participation rates across states, as illustrated in Fig. 1. The participation rates among SSI recipients in current pay status range from a low of 0.2 percent in Mississippi to a high of 5.4 percent in North Dakota. The fact that North Dakota has the highest participation rates might be related to it being the only state in the country with a state-owned, state-run bank (the Bank of North Dakota) that is charged with promoting commerce, agriculture, and industry in the state, and by state law must promote the use of ABLE accounts within the state. Figure 1 also highlights participation rates in states with and without state-level tax incentives for ABLE account holders and shows that participation rates in 13 of the 21 states (62 percent) with tax incentives are above the overall participation rate of 1.1 percent compared to only 15 of the 32 states (47 percent) without tax incentives. We note that Oregon, which is the only state that offers a refundable tax credit, has the fourth highest ABLE participation rate at 4.1 percent and it is over three times higher than the national average of 1.1 percent. The high participation rate in Nevada coincides with the implementation of the TOTS grant program that provides $5,000 in ABLE account seed money to eligible children.
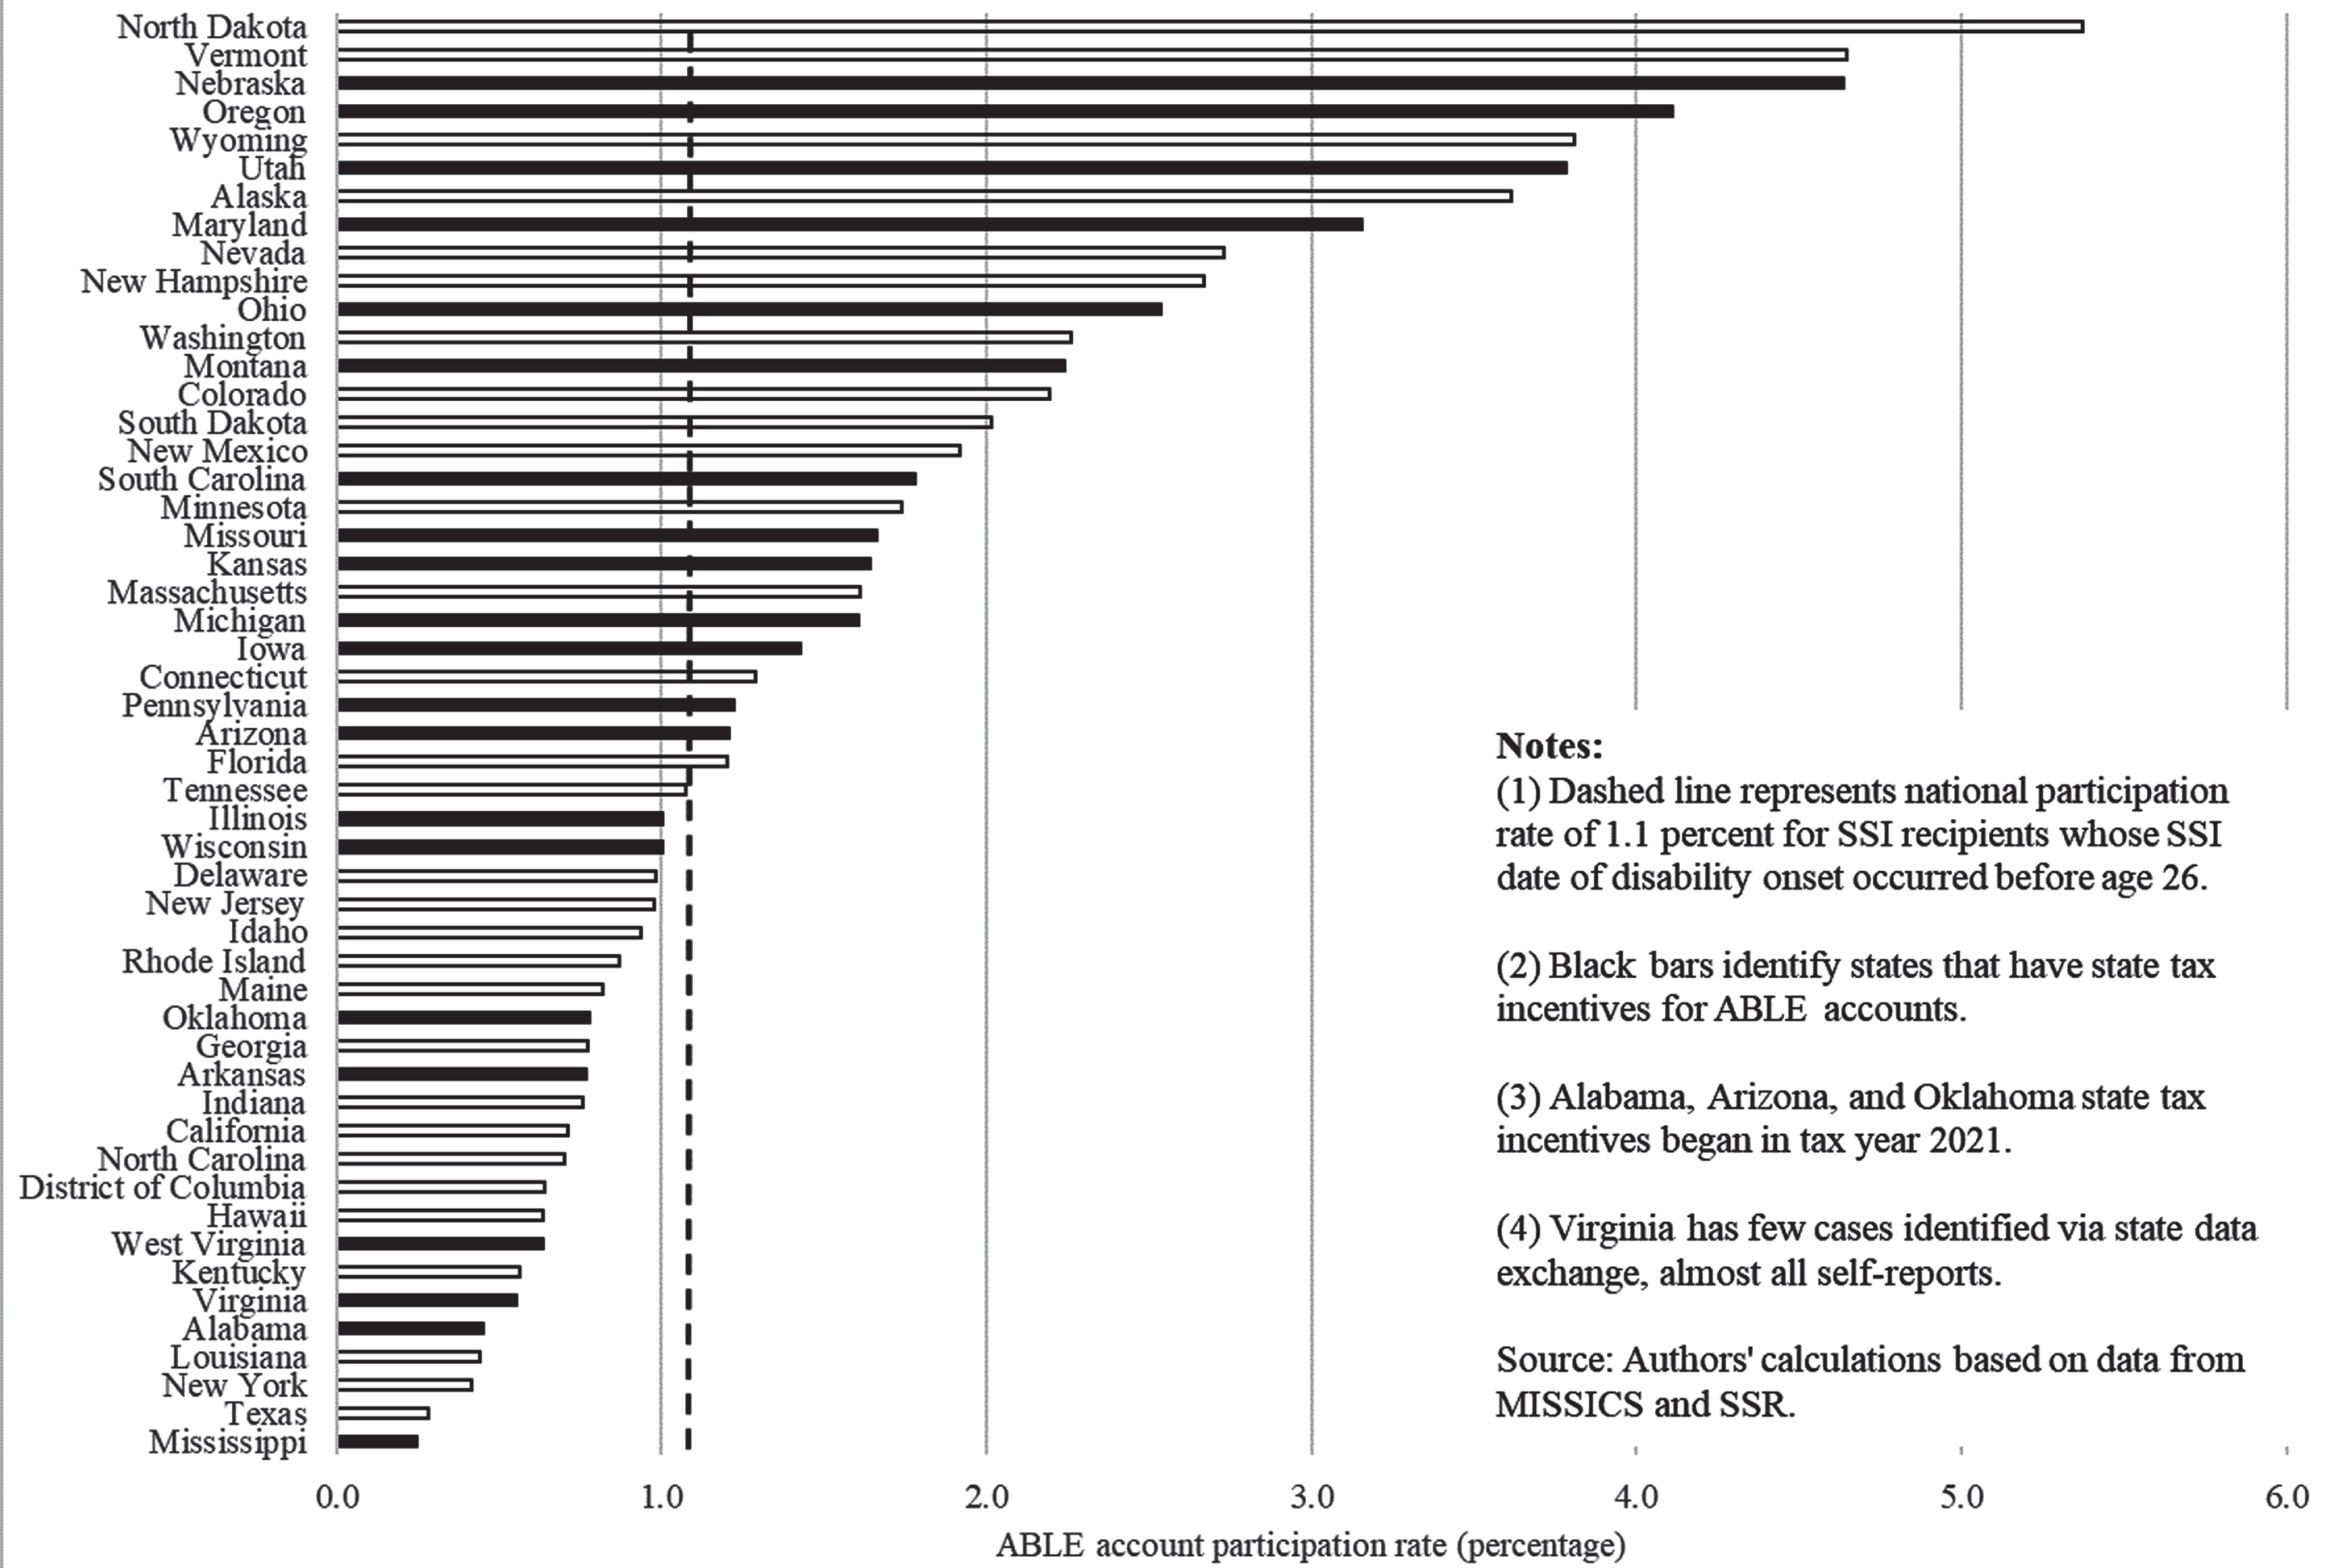
ABLE account participation rate (percentage) for SSI recipients in current pay status. Source: Authors’ calculations from Social Security Modernized SSI Claim System (MSSICS) data linked to the Supplemental Security Record (SSR). Numbers are in Supplementary Table 1.
The differences in ABLE account participation rates across states are more pronounced when we focus our analysis on SSI recipients in non-payment status due to excess income, as shown in Fig. 2. Figure 2 shows that Mississippi has the lowest participation rate of 0.5 percent and North Dakota has the highest participation rate of 10.7 percent. It also shows that states with state income tax incentives are more likely to have at or above average participation rates, with 13 of the 21 (63 percent) state greater than or equal to the overall rate, when compared to states without (13 of 32, or 41 percent). Oregon, the only state with a refundable tax credit, has a participation rate of 8.6 percent which is over three times the overall participation rate of 2.6 percent.
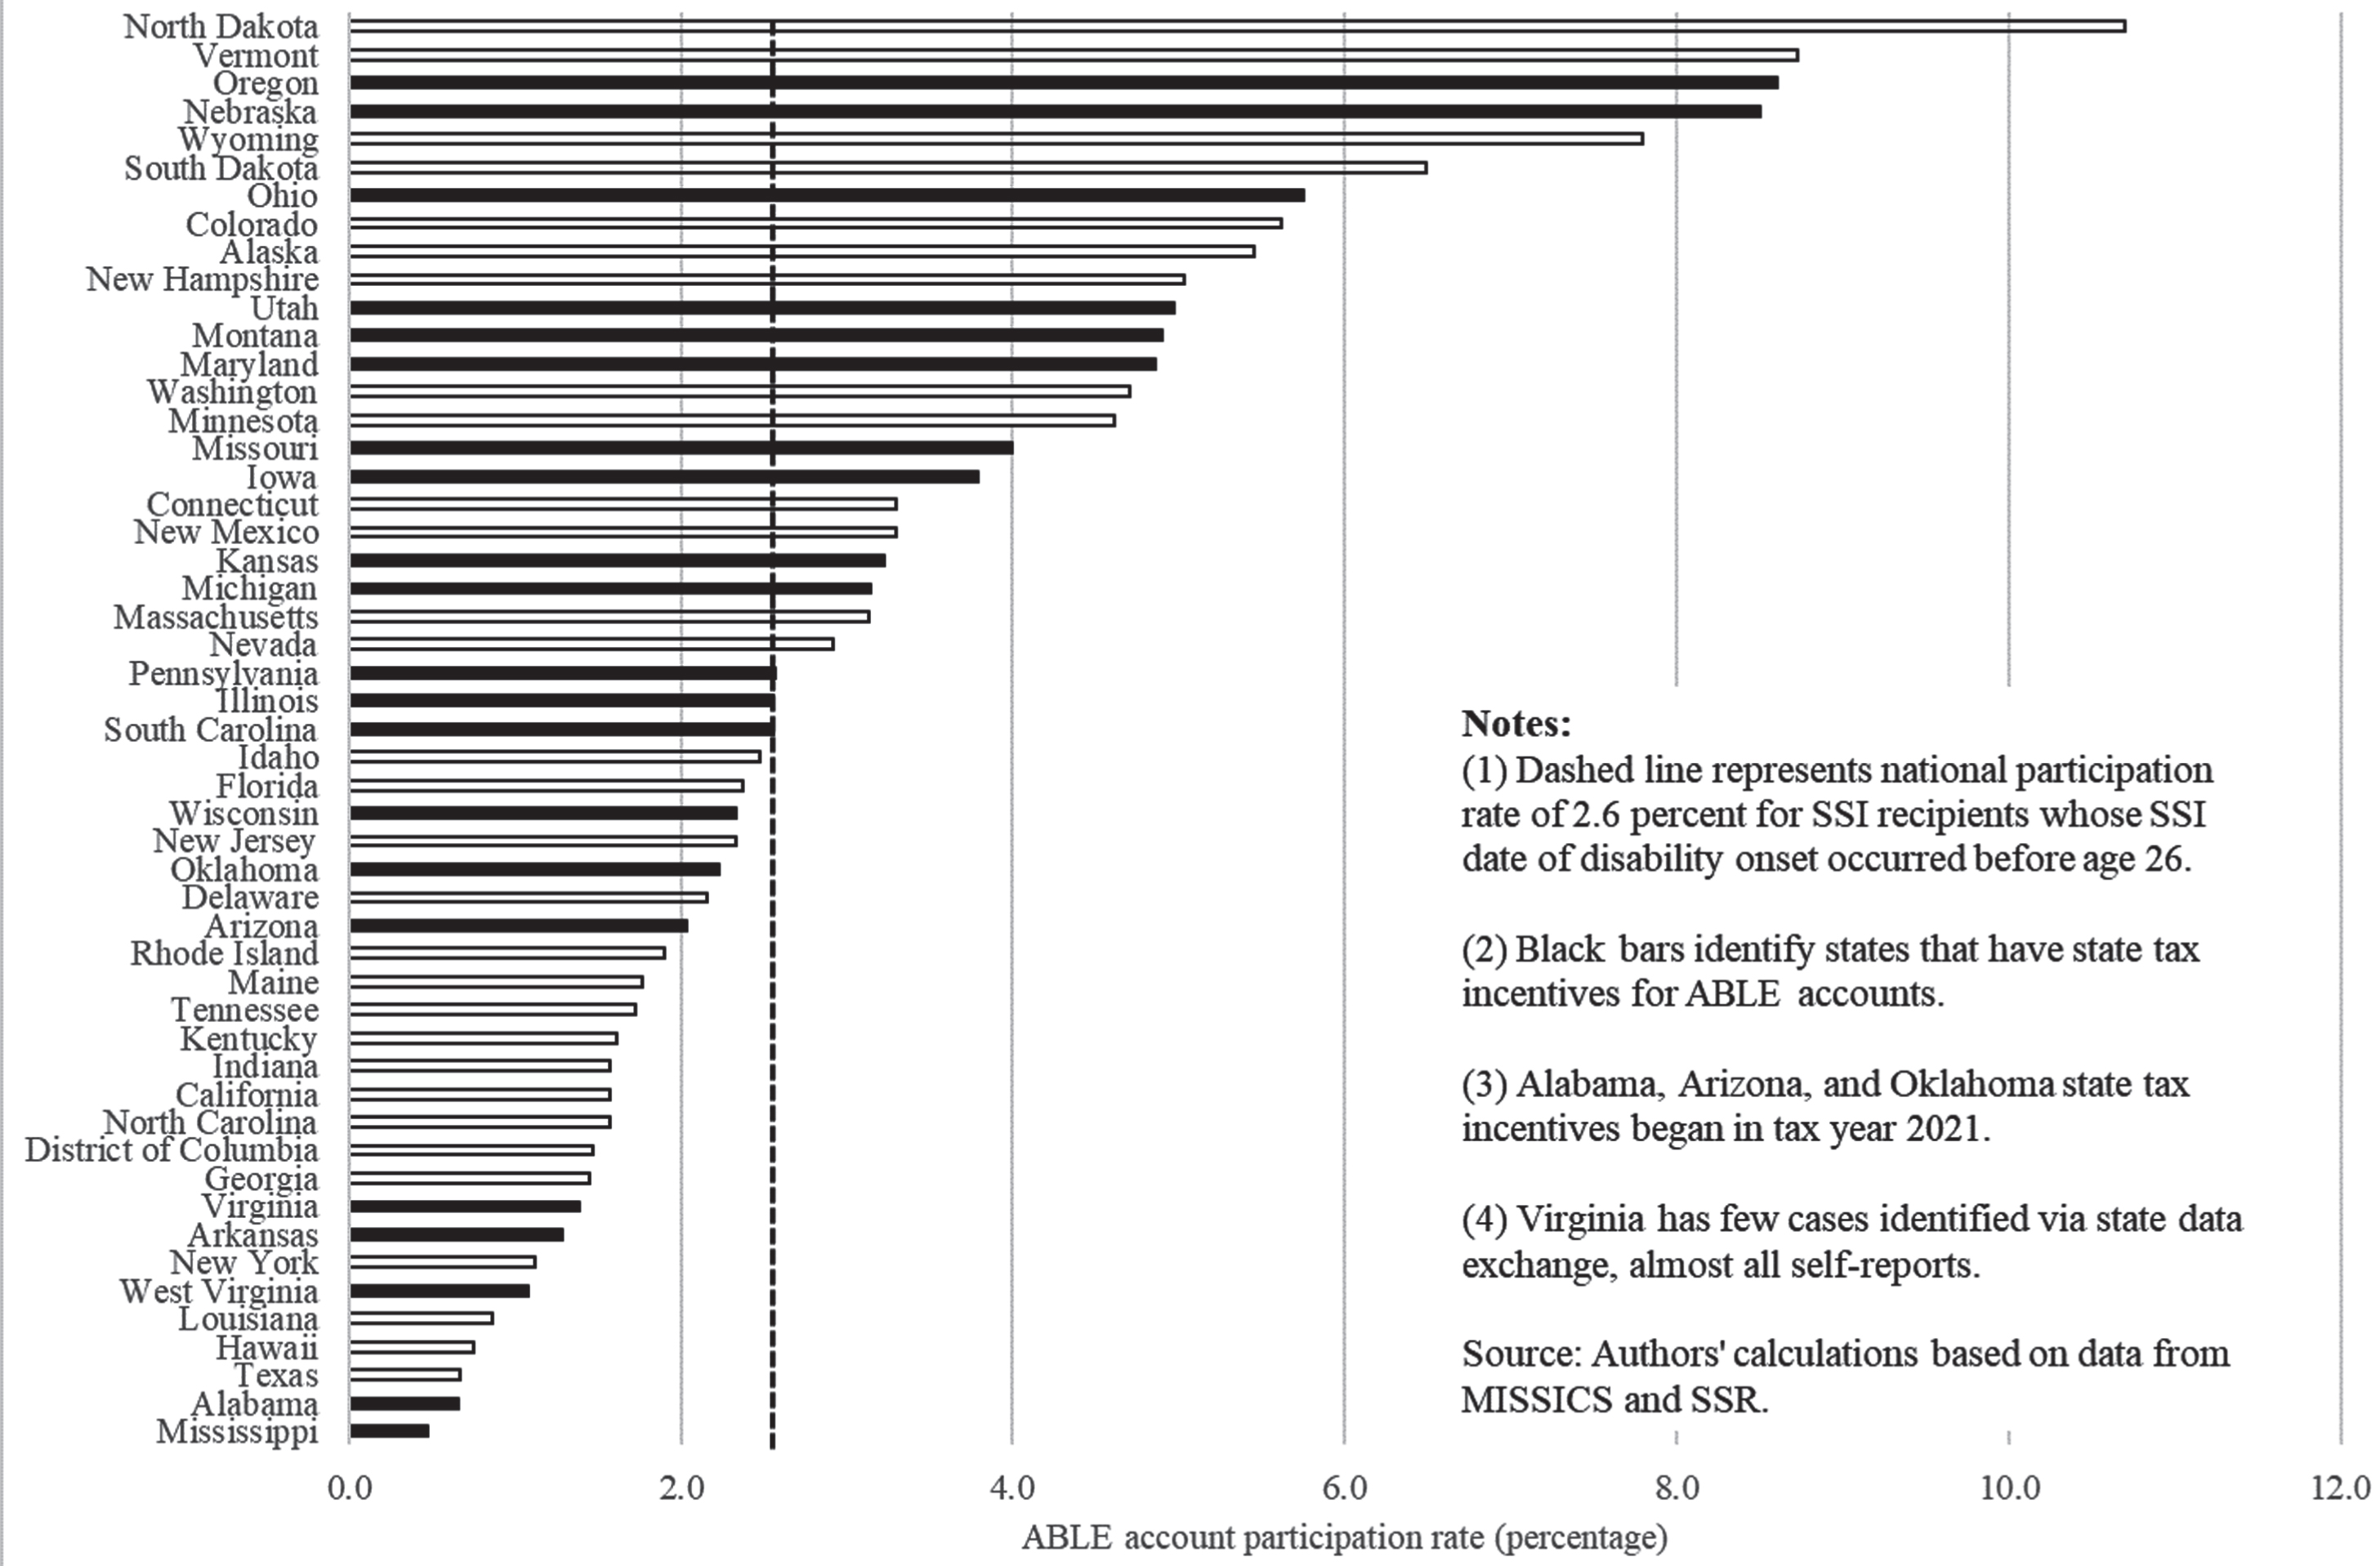
ABLE account participation rate (percentage) for SSI recipients in non-pay status due to excess income. Source: Authors’ calculations from Social Security Modernized SSI Claim System (MSSICS) data linked to the Supplemental Security Record (SSR). Numbers are in Supplementary Table 1.
We find higher participation rates for those who reside in a state with state-level tax incentives (1.5 percent) than those residing in states without such incentives (0.9 percent), as shown near the top of Table 6. While this difference is large, we are unable to identify the extent to which this is caused by the tax incentives, the additional information on ABLE accounts from state tax forms, or whether the differences are attributed to other factors that make the comparison group a poor counterfactual. We also examine differences in the distribution of amounts held within ABLE accounts for the two groups. While the average (mean) amount held within ABLE accounts are larger for SSI recipients residing in states without state-level tax incentives ($7,049.96) when compared to those residing in states with tax incentives ($6,562.21), we find that the mean masks differences in the opposite direction at the median of the distribution and at deciles below the median. The median amounts held in ABLE accounts is larger for those residing in a state with state-level ABLE account tax incentives ($3,314.99 v. $3,193.19), as well as at the 40th ($2,330.82 v. $2,052.93), 30th ($1,478.36 v. $1,175.72), 20th ($642.52 v. $407.31), and 10th ($40.78 v. $25.03) percentiles. Thus, there is a positive association between state-level tax incentives and amounts held at the median and at lower deciles of the distribution. ABLE account participation for individuals in non-pay status due to excess income is also higher for those residing in states with state-level tax incentives (3.3 percent) when compared to those who reside in states without tax incentives (2.1 percent), as shown in Table 6.
ABLE account participation rates and amounts as of December 2021, by availability of state-level tax incentives
Source: Authors’ calculations using SSA program data from the Modernized Supplemental Security Income Claims Systems (MSSICS) linked to the Supplemental Security Record (SSR) and to the data on state-level tax incentives shown in Supplementary Table 1.
The results from our logistic regression model show that the heterogeneity in participation rates is substantial after accounting for the relationships between the explanatory variables in our model and ABLE account participation. Table 7 shows the odds ratios, which describe the likelihood of owning an ABLE account relative to a reference group. For example, SSI recipients receiving an SSI payment and residing in a state with state-level tax incentives have a statistically significant estimated odds ratio of 1.65, indicating that the likelihood of owning an ABLE account is about 1.6 times the likelihood among SSI recipients residing in states without such incentives. This estimate is smaller than the estimated odds ratio implied by the participation rates for each group shown in Table 7 (1.6/0.9 = 1.78), and the smaller estimated odds ratio from the logistic regression indicates that other factors in the model may account for some of the difference in ABLE account participation rates across the two groups. Notably, for SSI recipients who obtain non-pay status due to excess income the estimated odds ratio for those residing in states with state-level tax incentives is 1.35 and statically significant, indicating that their likelihood of owning an ABLE account is also about 1.35 times the participation rate among SSI recipients residing in states without such incentives.
Logistic regression results for ABLE account participation among SSI recipients
Source: Authors’ calculations from Social Security Modernized SSI Claim System (MSSICS) data linked to the Supplemental Security Record (SSR). *Indicates statistically significant at 10 percent level, **indicates statistically significant at 5 percent level, ***indicates statistically significant at 1 percent level.
The likelihood of owning an ABLE account is higher among SSI recipients with an SSI disability onset age of 18 through 25 when compared to those with an onset date between ages 0 through 17. Our estimated odds ratio is 1.65 for those in current pay and 1.56 for those in non-pay status due to excess income. For those who do not receive SSI payments as children because their families do not meet the income and resource tests, the earliest onset date they are likely to have in SSA records is age 18, regardless of the age when their disabling health condition began. Thus, those with an onset date of ages 18 through 25 are more likely to come from families with higher income and resource levels that may contribute to ABLE accounts. The odds ratios relative to those ages 55 and older as of December 2022 are lower at about 0.27 for those under age 18 indicating an estimated likelihood of ABLE participation of about 27 percent of the participation rate of the reference group and is highest among those ages 18 through 25 at 1.63 for those in current pay (and about 1.49 for those in non-pay due to excess income).
The differences in the likelihood of ABLE account participation between males and females are small, the differences across race and ethnicity groups are significant, the differences by English proficiency are large and significant, and the differences by disabling health conditions are significant. Males have a slightly lower likelihood of ABLE account participation relative to females, and for those in current-pay status the difference is not statistically significant. Those who report their race as Black or who report their ethnicity as Hispanic have estimated odds ratios below 0.5 that are statistically significant, indicating a likelihood of ABLE participation that is less than half the likelihood of those who report their race as white. The odds ratios for those who report their race as Asian or whose race is not reported in our data indicate a higher likelihood of ABLE account participation for the two groups. The odds ratios for those whose preferred language is not English is 0.27 for those in current pay and 0.25 for those in non-pay status due to excess income, indicating the likelihood of using an ABLE account is about 27 percent and 25 percent of those whose preferred language is English. The differences in the likelihood of ABLE account participation by disabling health conditions show similar results to those reported in Tables 4 and 5. SSI recipients with disabling health conditions that are congenital anomalies or autism spectrum disorders have higher estimated odds ratios indicating that they are more likely to have ABLE accounts.
SSI recipients who also receive disability insurance benefits and those who have earned income have odds ratios that indicate a greater likelihood of using an ABLE account. The estimated odds ratio for those receiving DI benefits is 1.28 relative to those who are not receiving DI benefits for those in current pay, and it is 1.80 for those in non-pay due to excess income. The likelihood of ABLE account use increases with the number of months of earned income, with estimated odds ratios for those in current pay increasing from 1.83 for those with 1 through 12 occurrences of earnings to 5.94 for those with 61 or more months of earnings. For those in non-pay due to excess income, the estimated odds ratios increase from 1.59 for those with 1 through 12 occurrences of earnings to 4.28 for those with 61 or more months of earnings. We note that tenure on the SSI program does not appear to explain the estimated odds ratio for those in current pay with 61 or more months of earnings as the estimated odds of ABLE account use are greater than 1 for all the tenure groups relative to those with 60 or more months since SSI payment eligibility. For those in non-pay, we note that the estimated odds ratio is 0.60 for within 1 year of SSI payment eligibility indicating that they have a lower likelihood of ABLE account participation relative to those with 61 or more months since SSI payment eligibility. After accounting for those also receiving DI benefits, the odds ratios for unearned income occurrences indicate lower odds for those with unearned income relative to those without among those in current pay. For those in non-pay due to excess income, the estimated odds ratios are not statistically significant.
The number of SSI recipients with an ABLE account has steadily grown since 2016 and over 58,000 SSI recipients had opened an account as of December 2021. The ABLE account participation rate reached 1.1 percent of SSI recipients who are receiving an SSI payment as of December 2021 and whose SSI disability began before age 26. We show that there is substantial heterogeneity in participation rates by geographic location, by the availability of state-level tax incentives within the state that the SSI recipient resides, by demographic characteristics, and by the number of months of earnings from work. The heterogeneity in participation rates suggests that there might be opportunities to increase ABLE account participation rates among SSI recipients.
Outreach efforts or informational campaigns are one opportunity to increase ABLE account participation. We find high participation rates for those with primary health impairments that include congenital anomalies (e.g., downs syndrome, spina bifida) and autism spectrum disorders. For these two impairment types, there are strong advocacy organizations and networks that provide information on ABLE accounts which might contribute to the high participation rates. We also document higher participation rates within states that offer state-level tax incentives, and the information provided through the state tax system may contribute to higher participation rates. Our findings show low participation rates among groups who prefer communications in Spanish or who prefer communications in other languages, and information on ABLE accounts may not be as readily available to those with limited English proficiency. Thus, one possible explanation for the low participation rates among those who prefer communications in languages other than English is an informational barrier. These findings suggest a potential for outreach and informational campaigns to increase ABLE account participation among SSI recipients.
Our assessment of other research on outreach efforts targeting SSI recipients further supports the potential for such efforts to increase ABLE account participation. For example, a randomized controlled trial of an information letter sent to a group of Social Security beneficiaries who might also be eligible for an SSI payment showed a significant effect on SSI applications and SSI awards (Hemmeter et al., 2021). Another example is a randomized controlled trial of informational letters sent to SSI recipients on their SSI wage reporting responsibilities that showed a significant increase in wage reporting (Zhang et al., 2021). The State agencies responsible for administering ABLE account plans might be able to adopt such an approach to provide individuals with the information they need to determine whether they might benefit from establishing an ABLE account. Designing the roll-out of an outreach effort in a way that would support a rigorous evaluation could provide evidence on how outreach efforts increase the ABLE account participation rate.
Enhancing the financial incentives to contribute to ABLE accounts may be another opportunity to increase participation. While our results are only suggestive, the larger participation rates among states that offer a tax incentive indicate a potential for incentives to increase participation. Our findings also show that Oregon, which is the only state that offers a refundable tax credit to its residents who contribute to ABLE accounts, has participation rates that are over three times the corresponding national participation rates. We also find a high participation rate in Nevada, and that the high participation rate in the state is driven by a very large increase in ABLE accounts that coincided with the introduction of the TOTS grant program. Pilot projects that have offered low-income tax filers with matching funds to accompany Individual Retirement Account contributions have proven to be effective at increasing savings among low-income households (Duflo et al., 2006). Recent evidence from the Assets to Independence demonstration shows that a specialized savings program for low-income households that included financial incentives and assistance resulted in a significant increase in asset ownership and a significant reduction in the percentage of participants reporting they were worse off financially ( Mills et al., 2019; McKernan et al., 2020). Taken together, these findings make a compelling case for conducting more rigorous evaluations on the effects of enhancing financial incentives on ABLE account participation. For example, randomized controlled trials that test the effects of financial incentives similar to refundable tax credits could provide a stronger evidence base to inform policy.
A third opportunity to increase ABLE account participation rates is through simplification, technical assistance, or some combination of the two. The rules for ABLE accounts can be complex and some of the information on state programs could be burdensome to understand. Some state program descriptions are as long as 130 pages with complex information about program requirements and investment risks. Many SSI recipients might not have enough technical knowledge to understand the risks of investing and that might deter them from opening and contributing to an ABLE account. Others have identified such “knowledge gaps” as an explanation for under-saving among low-income households (Karlan et al., 2014). It is possible that simplifying the information on ABLE accounts combined with additional technical assistance from a trusted source could increase ABLE account participation among SSI recipients. Formative evaluations of small pilot programs designed to bridge the knowledge gap would be useful to identify promising programs. The results from such formative evaluations would help determine how to proceed toward implementing ongoing programs that could increase ABLE account participation among those who are eligible for them.
Our exploratory analysis on the differences in ABLE account use by race, ethnicity, and limited English proficiency indicate that structural barriers may affect the use of ABLE accounts. Examples of such barriers may include discrimination in administrative practices and information sharing (Ray et al., 2022), as well as labor market discrimination that leads to lower income levels among individuals, family members, or members of social networks who may contribute to the individual’s ABLE account (Bertrand and Duflo, 2017). Our exploratory analysis is limited to Social Security program data, and we do not have the information needed to assess the relative importance of different structural barriers on the use of ABLE accounts. Community-engaged research would be required to gain a fuller understanding of any structural barriers and potential solutions (Brown et al., 2020).
Conclusion
Our findings represent a first step toward gaining a better understanding of ABLE account use among SSI recipients. Only 1.1 percent of SSI recipients in current pay who are definitely eligible for ABLE accounts have an account, and there may be informational barriers, financial barriers, or barriers associated with the complexity of the program that prevent individuals and families from using ABLE accounts to help them maintain their health, independence, and quality of life. Taking the next step by using our results to develop pilot projects or demonstrations can provide the evidence needed to remove barriers to savings and increase economic mobility among low-income households.
Footnotes
Acknowledgments
The authors are grateful to Betsy Blair, John Jankowski, Michael Levere, Lucie Schmidt, Chelsea Shudtz, and Chris Tino for their review and suggestions on earlier versions of this paper. The views expressed herein are those of the authors and are not necessarily those of the Social Security Administration.
Conflict of interest
The authors declare that they have no conflict of interest.
Ethics statement
Not applicable.
Funding
The authors report no funding.
Informed consent
Not applicable.
Thirty-five states and the District of Columbia provide Medicaid eligibility to people eligible for SSI payments, another seven states and the Northern Mariana Islands use the same eligibility criteria as in SSI, and nine states use their own eligibility rules for Medicaid, which are different from the SSI rules.
The $100,000 limit is only for SSI; amounts can be higher than $100,000 and not affect Medicaid eligibility or eligibility to other means-tested programs. Beginning in tax year 2026, individuals whose disability began before age 46 will be eligible for ABLE accounts.
ABLE account provisions related to the Saver’s Credit are set to expire after 2026.
SSI also provides monthly payments to people ages 65 and older with income or resources below specific limits, regardless of whether they have a disability.
For more information on the national average wage index, see: National Average Wage Index (ssa.gov).
The SSI work incentives are described in more detail in the Social Security Administration (2020a) Red Book.
This is likely one of the more challenging decisions that SSI beneficiaries have to make when opening these accounts, as there are often many investment options depending on the State ABLE account program.
PASS plans are rarely used within the SSI program. Only 401 SSI recipients had a PASS plan in December 2020, and only 821 SSI recipients had a PASS plan in December 2015 (the year before ABLE accounts began).
We note that there are strict rules when it comes the distribution of assets from special needs trusts. For example, funds can’t be spent on things like food or shelter, which an ABLE account can cover.
Social Security Disability Insurance benefits and Medicare benefits are also important sources of income and health care, but the programs have different rules and are not subject to resource limits. Unlike the SSI program, SSA does not need information on ABLE accounts to administer the DI program.
The maximum amount allowed ranges from a low of $250,000 in Mississippi to a high of $550,000 in Virginia.
Additional summary information on state-run ABLE accounts, including the year that the state initiated an ABLE account program, whether the state allows non-residents to participate, and whether there are state-level tax incentives for participation is available at Home - ABLE National Resource Center (ablenrc.org). Individuals must reside in the 50 states, DC, or the Northern Mariana Islands to be eligible for SSI. We exclude residents of the Northern Mariana Islands from our analyses.
ABLE account provisions related to the Saver’s Credit are set to expire after 2026.
We examined the extent to which the percentage of ABLE accounts reported through a State Data Exchange differs across states, and found relatively low percentages in Virginia (7 percent), Texas (52 percent), and California (46 percent). For Virginia, the low rate was associated with a technical problem with the data exchange that is being resolved.
The data collected by SSA is voluntary and self-reported. It is missing in almost 50 percent of cases within our data. We do not have information on the reliability of the self-reported data. While the data is the best available in SSA’s administrative records, it should be interpreted with caution based on these two caveats.
A data appendix is available from the corresponding author upon request.
Individuals may have disabilities that began before age 26 but which, for SSI eligibility purposes, were not identified in the record for unknown reasons.
The vast majority of SSI recipients only opened one account during the period.
SSI recipients’ payment status may change monthly based on their income and resources. A recipient must be in non-pay status for 12 continuous months before their record is officially terminated and they need to reapply for benefits to resume payments.
Individuals may have older onset ages in their SSI record for a variety of legitimate reasons, including, but not limited to, differences between self- or doctor- stated date of onset and the date of onset used to establish SSI eligibility. SSA’s definition of disability is not necessarily used by other programs or the private sector.
The mean amount for all ABLE account owners is from the national association of state treasurers at https://nast.org/able-advocacy/ as of December 31, 2021. It includes 112,021 ABLE account owners who are either SSI recipients with a disability or individuals with a disability who do not collect SSI payments.