
Abstract
BACKGROUND:
Ensuring that job seekers with disabilities receive high-quality supported and customized employment services is key for increasing their chances of achieving their career aspirations.
OBJECTIVE:
To draw attention to the need for better support of employment consultants in the delivery of quality services.
METHODS:
Nine employment programs piloted ES-Coach, a tool designed to help employment consultants and managers visualize the implementation of supported and customized employment, reflect, set goals, and take action for continuous quality improvement
RESULTS:
The nine employment programs invested an estimated 1:19 to 4:10 hours per day on getting to know job seekers, finding jobs, and any other support leading to hire combined. A large amount of their time was invested in administrative activities, ranging from 2:11 to 4:12 hour per day. ES-Coach helped the participants reflect on the quality of their employment support services and set goals for quality improvement.
CONCLUSION:
Supporting employment consultants with data-enabled feedback is key for improving the quality of supported and customized employment services, a key step toward improving job seekers’ employment outcomes.
Introduction
Employment consultants —also known as employment specialists, career coaches, or job developers —are professionals who specialize in supporting job seekers with disabilities achieve their career aspirations. In the US, there are an estimated 32,000 employment consultants supporting job seekers with intellectual disabilities, autism, and developmental disabilities (Haines, et al., 2013; Migliore et al., 2010). These employment consultants have access to a wealth of information about best practices in supported and customized employment that emerged from over 40 years of research (Wehman et al., 2021). In 2001, the Association for Persons Supporting Employment First (APSE) consolidated this knowledge into the APSE Universal Employment Competencies, a set of 74 standards organized in four domains (APSE, 2020). These standards are the basis for certifying employment consultants’ competencies through the Certified Employment Support Professional (CESP) program and for certifying a training curriculum available to employment consultants through the Association for Community Rehabilitation Educators (ACRE). Several state agencies that fund employment programs require that their employment consultants hold either CESP status or have received ACRE-certified training (APSE/ACRE, 2020). Knowledge about supported and customized employment is also disseminated through national conferences, peer-reviewed journal articles, and webinars, often for free (Barwick et al., 2020; Grimshaw, et al., 2012; Ham et al., 2022).
Based on these premises, employment consultants have access to the information they need to deliver quality supported and customized employment services. Yet, evidence shows a gap between theory and practice. For example, Inge et al. (2022) found that only 28% to 60% of experts agreed that discovery and customized job development activities were implemented well. In another study, researchers found that although networking is recommended for finding jobs (Darling, 2010; Owens & Young, 2008), employment consultants invested only about 24% of their job search efforts in networking, with most of their efforts (74%) invested in browsing ads, cold calling, and other strategies not known to be as effective (Migliore et al., 2021). The implementation challenge is shared across industries. Researchers in the medical field found that it takes about 17 years for evidence-based research to reach clinical practice (Institute of Medicine, 2001): “ … there is a large gap between what is known and what is consistently done … ” (Bhattacharyya, et al., 2009, p. 491).
A possible explanation for the gap between knowledge and practice comes from adult learning theory. Based on this theory, adult learners are not great at transferring abstract concepts from training into their daily practices. In contrast, adult learners perform better when knowledge focuses on solving specific problems and is delivered in the workflow (EDC, 1998; Gottfredson & Mosher, 2021; Knowles et al., 2015; Stolovitch & Keeps, 2011). Therefore, there is an urgent need for tools to support employment consultants in the workflow to implement supported and customized employment. Without these tools, supported and customized employment are at a higher risk of not being fully implemented, and thus job seekers are at a higher risk of not fully achieving their career aspirations (Becker et al., 2015; Bond et al., 1997; Drake, et al., 2011; Hall et al., 2016; Hall & Keeton, 2022). The purpose of this article is to describe ES-Coach (Employment Support Coach) and a pilot that used this tool to support employment consultants implement supported and customized employment. We presented this content at the 2022 APSE conference in Denver, CO.
Methods
The tool: ES-Coach
The ES-Coach is a web-based software application that allows for data collection, data visualization, and microlearning for the purpose of supporting employment consultants to reflect, set goals, and take action for quality improvement (Fig. 1).
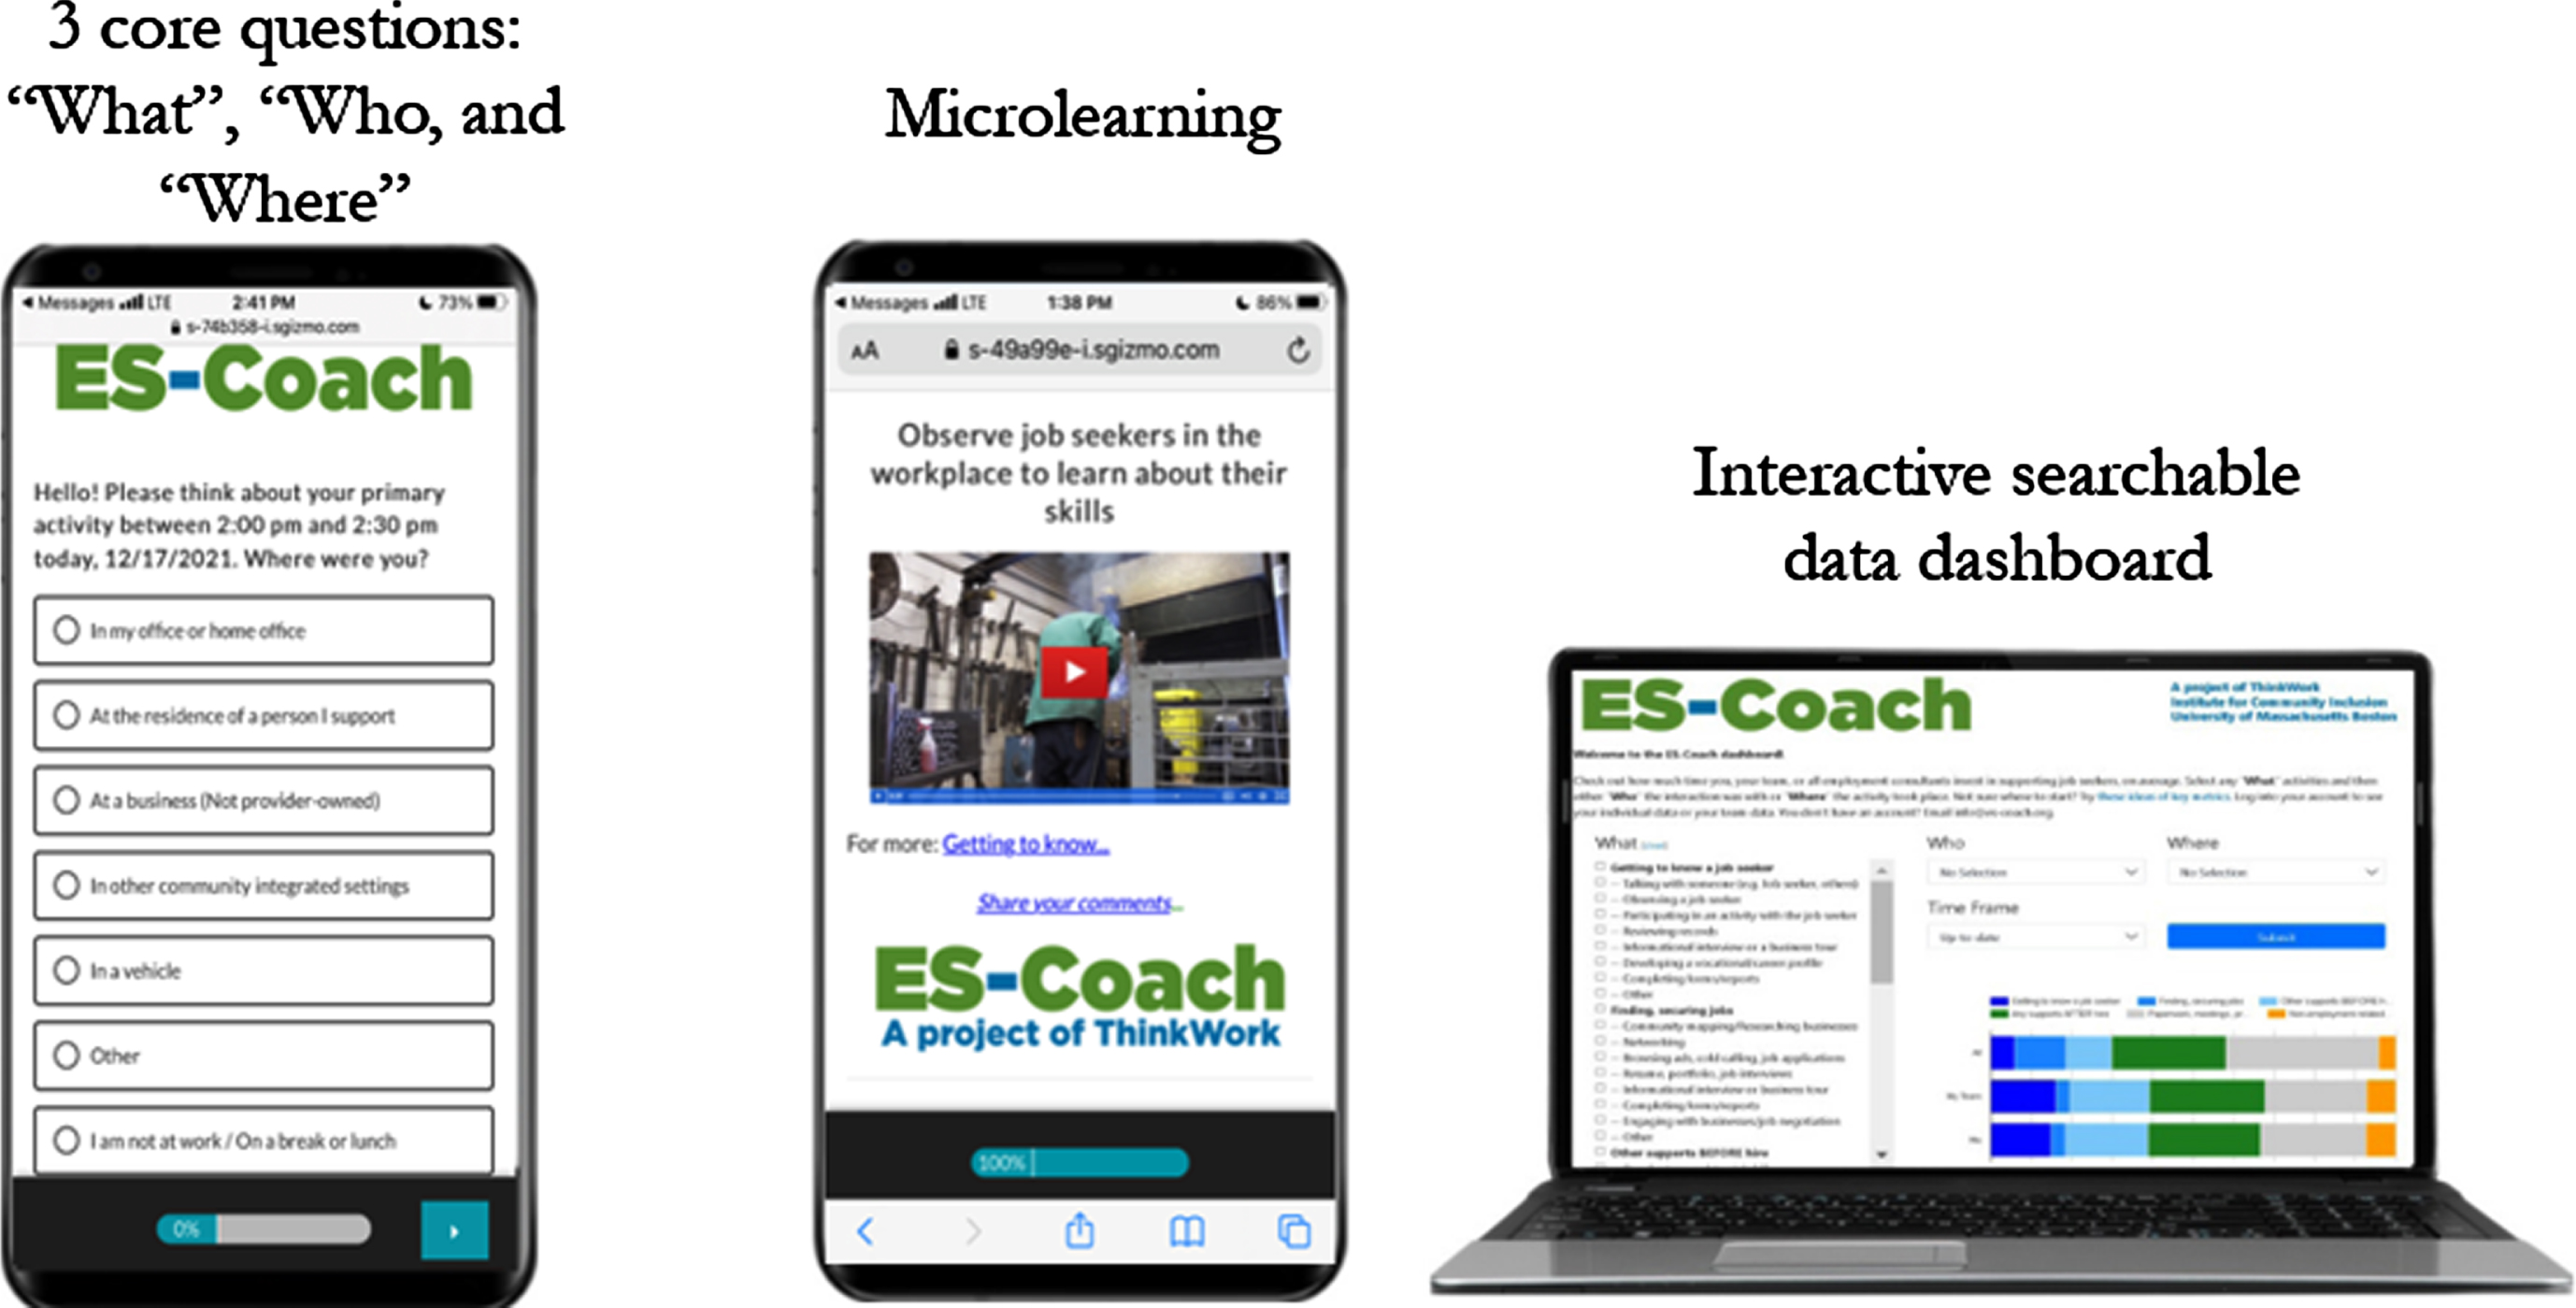
ES-Coach data collection, microlearning, and visualization. Three screenshots show a page of the daily survey, an example of closing screen featuring a video, and the desktop data dashboard.
ES-Coach sends a text to the phones of employment consultants daily, asking three core questions: What primary support activity was carried out during the 30 minutes before receiving the text? Who was the primary interaction with? Where did the activity take place?
The drop-down menu of responses for the “What” question includes: a) getting to know a job seeker; b) finding, securing jobs; c) other supports BEFORE hire; d) any supports AFTER hire; e) paperwork, meetings, program business; and f) non-employment related, e.g. day programs. A follow-up question asks to specify which support was provided. For example, if employment consultants select “getting to know a job seeker” as the primary support activity, a follow-up question asks to select which “getting to know” activity was primarily implemented from a drop-down menu that includes: a) talking with someone; b) observing a job seeker; c) participating in an activity with the job seeker; d) reviewing records; e) informational interview or a business tour; f) developing a vocational/career profile; g) completing forms/reports; or h) other.
The drop-down menu of responses for the “Who” question includes: a) a person I support; b) family, friends, acquaintances; c) disability professionals; d) someone from a business; e) other; and f) none. Finally, the drop-down menu of responses for the “Where” question includes: a) in my office or home office; b) at the residence of a person I support; c) at a business; d) in other community integrated settings; e) in a vehicle; and f) other. See www.es-coach.org/dashboard for the complete list of response items.
All questions and response items were developed by our team in consultation with our partners at the University of Minnesota and validated through focus groups with employment consultants (n = 3) and managers (n = 3), feedback from subject matter experts (n = 3) and a self-advocate, cognitive interviewing with employment consultants (n = 6), and field testing with employment consultants (n = 11) and experts in supported and customized employment (n = 19).
The texts with the link to the questions are sent at a different random time each day, between 9:00 a.m. and 4:00 p.m. local time. Up to two reminders are texted before the survey expires at the end of the day. If not at work or on a break, the employment consultants can pause the survey until they return to work. This approach to data collection is based on the Ecological Momentary Assessment (EMA) methodology using mobile devices. An advantage of EMA, compared to traditional one-time retrospective data collection, is that EMA minimizes recall bias because data collection focuses on repeated measures of current behavior in real time. As a result, this approach to data collection allows for greater data accuracy. Moreover, by capturing data over a longer period of time, this technique provides data that better represent the overall profile of the services provided (Shiffman, et al., 2008; Walz et al., 2015).
Data visualization
The daily survey data populate a dashboard, refreshed daily, allowing the employment consultants to explore their estimated average hours per day invested in a range of supported and customized employment practices. The individual employment consultants can compare their implementation of best practices with the aggregated anonymous data from their teams and with everyone else involved in the project. The managers can see their teams’ aggregated anonymous data and compare it with all other participants involved in the project. However, the managers cannot see the employment consultants’ individual data. Finally, the aggregated anonymous data of all participants in the project is publicly available at www.es-coach.org/dashboard.
Microlearning
After responding to the ES-Coach daily survey, the employment consultants are exposed to microlearning content featured on the closing screen of the daily survey. This microlearning content consists of one-minute videos, 3–5 bullet point tips, and data that link to articles on best practices in supported and customized employment. Each week, the topic of microlearning focuses on a different aspect of supported and customized employment, including building trust with job seekers, getting to know job seekers, finding jobs, any other support before hire, and support after hire (Migliore, Nye-Lengerman et al., 2018; ThinkWork, 2020). The purpose of microlearning is to nudge the participants to implement supported and customized employment practices through daily reminders and action-based examples. According to the Association of Talent Development report (ATD, 2018), micro-learning is an effective learning strategy designed to reinforce and supplement formal training. The closing screens also allow the participants to share their success stories by clicking on a link where they can submit their comments.
The pilot
The purpose of this pilot was to field test the ES-Coach by recruiting managers of employment programs and coaching them to use ES-Coach with their teams of employment consultants as a quality improvement tool. The key components of the pilot included: a) recruitment, b) orientation, c) data collection and microlearning, d) data visualization, and e) coaching.
Recruitment
After our University Institutional Review Board (IRB) approved the study, we asked the state chapters of the Association of People Supporting Employment First (APSE) and other similar state associations in Minnesota and Massachusetts to distribute a call for participation to their members. We targeted employment programs in Massachusetts and Minnesota because the pilot was carried by the University of Massachusetts Boston in partnership with the University of Minnesota. To be eligible, employment programs had to have a team of three or more full-time employment consultants and serve primarily job seekers with intellectual and developmental disabilities. Sixteen managers expressed an interest in participating and were invited to join individual Zoom calls to learn more about the pilot and have their questions answered. Nine managers participated in the calls and confirmed interest in participating.
Orientation
The main purpose of the orientation Zoom call was to engage with the employment consultants by sharing with them the overall objectives of the pilot, how to sign up to receive the ES-Coach daily survey, how to respond to the daily survey, and the logistics of participating in the pilot. A total of 42 participants, including employment consultants and managers, attended the call in September 2021.
Data collection
After orientation, 56 employment consultants signed up for ES-Coach, 53 of them started submitting the ES-Coach daily survey, and 42 of them remained engaged until the end of the 6-month pilot. After excluding seven participants who changed jobs or took medical leave, the retention rate was 91%. The average response rate to the daily survey was 87% (min = 46%, max = 100%), with about 81% of the daily surveys submitted within two hours after receiving the first daily text. Based on responses to a baseline survey, the majority of the employment consultants (86%) and managers (89%) were female. The employment consultants tended to be younger (64% were 40 years old or younger) than the managers (66% were 41 years old or older). Most participants identified as white and non-Hispanic (93% among the employment consultants; 100% among the managers). Finally, only 12% of the employment consultants and 33% of the managers were Certified Employment Support Professionals (CESP).
Data visualization
As described in the previous section, the employment consultants could check the dashboard to visualize their estimated average hours per day invested in supported and customized employment and compare their individual data with their team’s aggregated data as well as with all participants’ aggregated data. The managers could also compare their teams’ aggregated data with all participants’ aggregated data. The purpose of data visualization was to provide employment consultants and managers with data that they could use during their staff meetings to reflect on their teams’ alignment with best practice, set goals, and identify actions for quality improvement.
Coaching
To help managers maximize the benefits of this pilot, two training specialists from our team scheduled individual monthly Zoom calls with them. The coaching calls were framed as “train the trainer” and had the goal of supporting the managers to engage their teams of employment consultants to reflect on the data, set goals, and take action for quality improvement. The two coaches helped the managers navigate the data dashboard and identify key metrics to be discussed with their teams. The managers were encouraged to document the goals and actions identified by their teams by filling in a 30-Day Team Action Plan. Each month, the managers discussed the successes and challenges with our coaches.
Results
Figure 2 gives an overview of the estimated average time distribution of key support activities as reported by the employment consultants over the six months of the pilot. Each bar of the chart represents one of the nine employment programs. The bottom blue section of the bars shows the estimated consolidated time invested in “getting to know job seekers,” “finding jobs/tasks,” and “any other support before hire.” These three activities combined are a first necessary step to help job seekers get jobs. The nine employment programs invested between 1:19 and 4:10 hours per day on these activities combined. The investment in support after hire (green segment of the bars) varied from 0:36 to 3:33 hours per day. All providers invested a large amount of time in administrative activities, ranging from 2:11 to 4:12 hour per day.
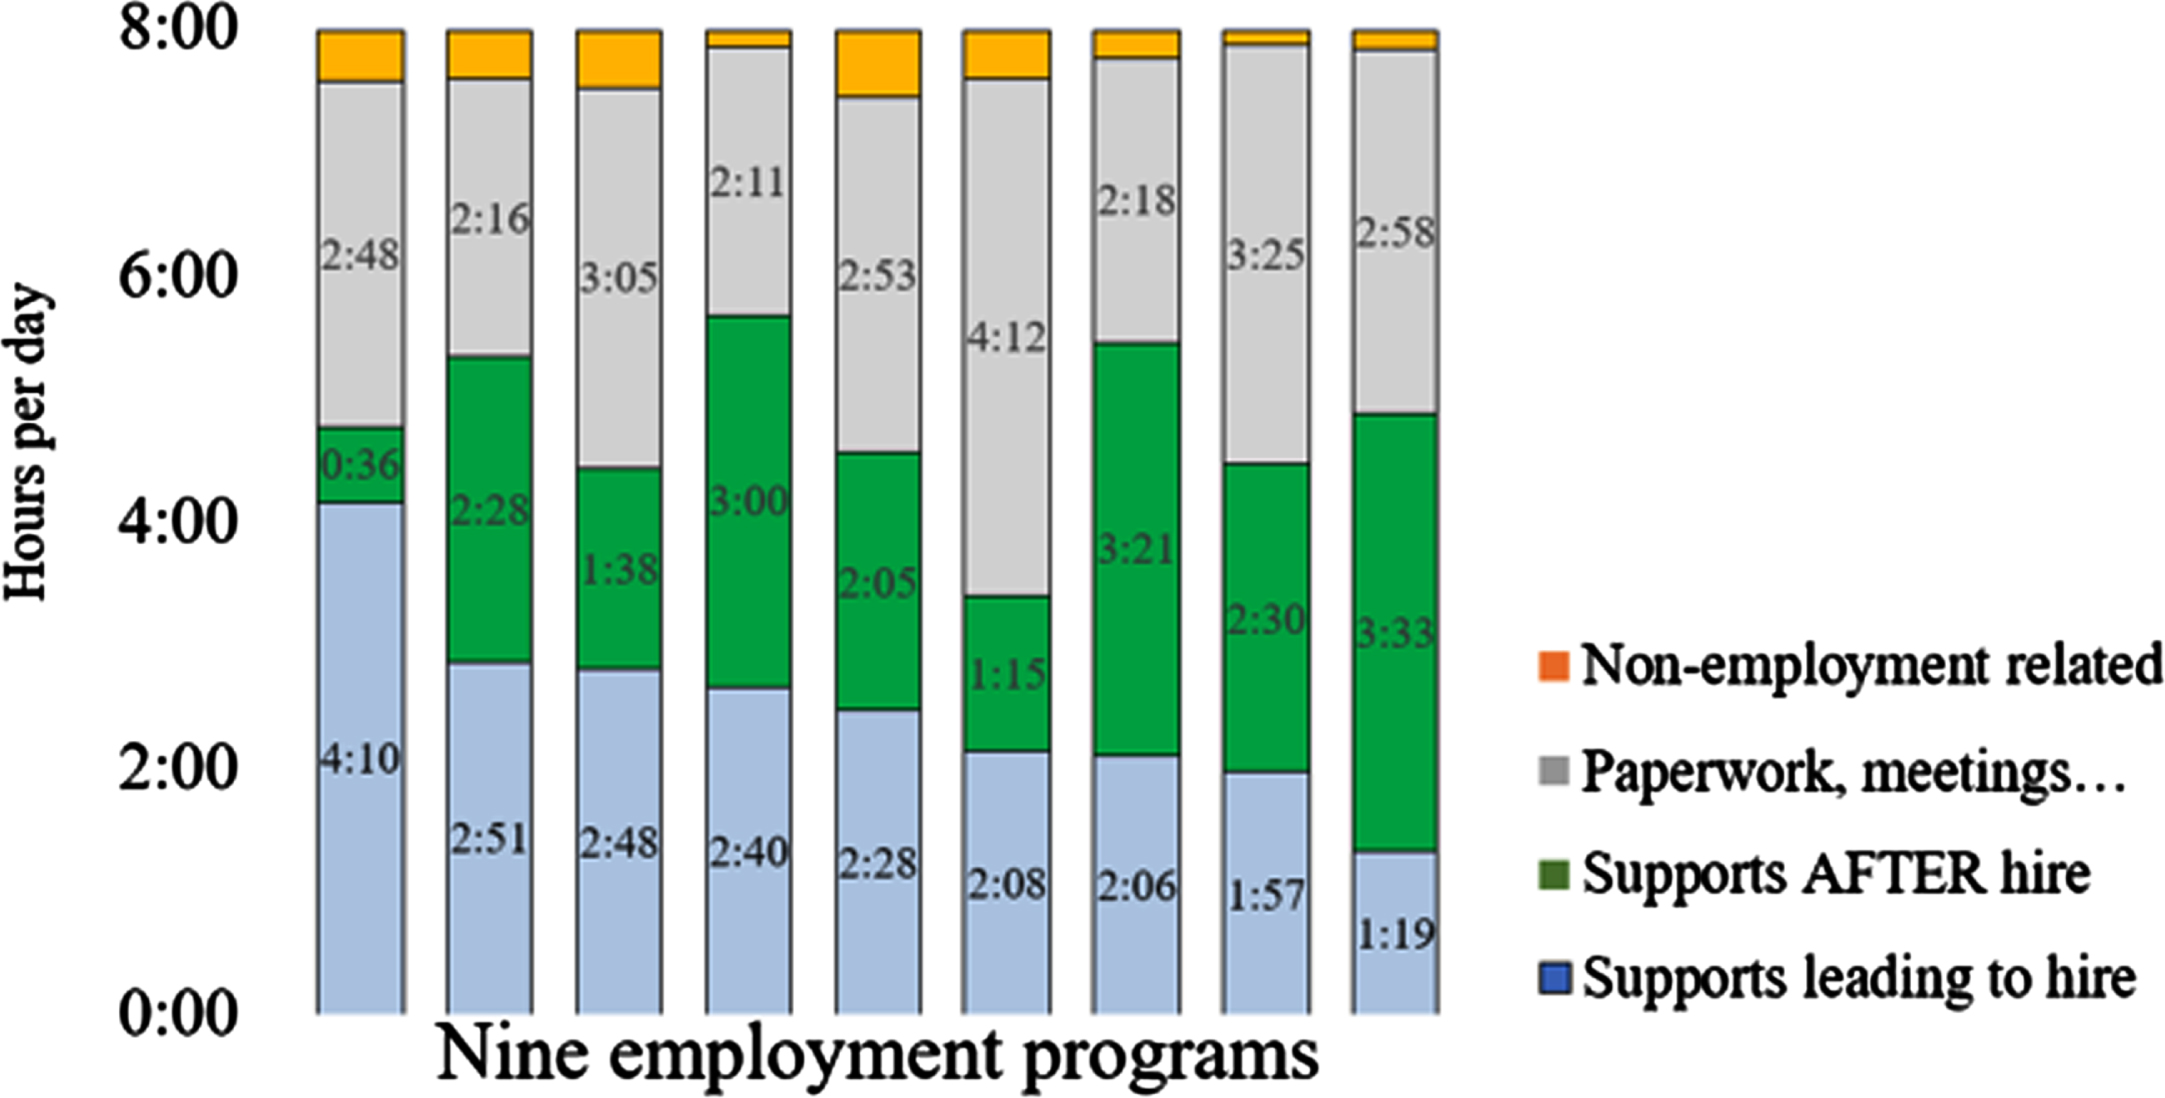
Estimated average hours/day invested across support activities. A 9-bar chart shows the distribution of time investment of each of the nine employment programs across supports leading to hire, supports after hire, paperwork/meetings, and non-employment related.
Investing a larger part of the day in getting to know job seekers, finding jobs, and any other support before hire is an important first step toward improving job seekers’ outcomes. However, it is not enough without looking more closely at the quality of those activities. Based on their ES-Coach data, for example, the managers and their teams made efforts to invest more resources in observing job seekers (n = 5 providers) and participating in activities with job seekers (n = 5 providers) as best practices to get to know the job seekers. To find jobs, they set the goal of increasing networking (n = 7 providers), engaging with businesses/job negotiation (n = 7 providers), and informational interviews/business tours (n = 6 providers). To improve support after hire, they set the goals of facilitating natural support (n = 5 providers) and facilitating career advancement (n = 3 providers). Finally, a few programs targeted reducing paperwork, meetings … (n = 4) as goals. Despite their efforts, however, the participants’ data did not show significant progress (Butterworth et al., submitted). Yet, ES-Coach helped employment consultants to increase their awareness about their practices, an important first step toward quality improvement. As an employment consultant stated:
I find that it [ES-Coach data] causes me to pause for a moment and reflect on how I am spending my time, energy, and resources.
At the teams level, employment consultants and managers appreciated visualizing their teams’ practices and using that information in their teams’ meetings to discuss alignment with best practices. A manager stated:
It’s very helpful to discuss things and, through that process, identify things that we didn’t think we were doing well that we didn’t realize we were doing as well.
Some managers felt that the categories used by ES-Coach to identify support services helped frame a language that they used at their team meetings, when interacting with senior leadership at their organizations, or when negotiating with funding agencies. This language allowed them to reframe the conversation less around billing activities and more around meaningful support activities. One manager reported:
I think one of the great things about ES-Coach is that it gives us the opportunity to really, in a very practical way, show people that inputs matter; and if they manage the inputs, a lot of times the outputs will take care of themselves.
Finally, the aggregated data across all employment consultants could be used by states or federal administrators and stakeholders to inform their state and national policy to better support employment programs and employment consultants to implement best practices in supported and customized employment supports. As a manager stated:
It’s hard to quantify in this field what we’re doing, and to have this data to back it up is just fantastic!
More details about ES-Coach and the findings from this pilot are available in Butterworth et al., submitted; Butterworth et al., 2020; and Migliore, Butterworth et al., 2018.
Conclusion
A key goal of the ES-Coach is to provide teams of employment consultants with a tool that helps them reflect on the implementation of supported and customized employment, set goals, and take action for quality improvement. Ultimately, the goal is to ensure that job seekers with disabilities receive high-quality supported and customized employment services and thus increase their chances to achieve their career aspirations. We also hope that ES-Coach contributes to the professionalization and recognition of employment consultants as a workforce that plays a key role in determining the quality of life of people with disabilities.
Footnotes
Acknowledgments
The authors would like to thank the employment consultants and managers of the nine employment programs in Minnesota and Massachusetts, without whom this project would not have been possible.
Funding
The development of this article was supported by grant nos. 90IFDV0009 and 90RTCP0003, National Institute on Disability, Independent Living, and Rehabilitation Research (NIDILRR), Administration for Community Living (ACL), and U.S. Department of Health and Human Services (HHS). The content of this article does not necessarily represent the policy of NIDILRR, ACL, or HHS.
Conflict of interest
The authors declare that they have no conflict of interest.
Ethics statement
The Institutional Review Board (IRB) at the University of Massachusetts Boston approved the pilot study described in this article (approval no. 2021031).
Informed consent
The participants signed an IRB approved consent form.