
Abstract
Background:
Adoption of new digital measures for clinical trials and practice has been hindered by lack of actionable qualitative data demonstrating relevance of these metrics to people with Parkinson’s disease.
Objective:
This study evaluated of relevance of WATCH-PD digital measures to monitoring meaningful symptoms and impacts of early Parkinson’s disease from the patient perspective.
Methods:
Participants with early Parkinson’s disease (N = 40) completed surveys and 1:1 online-interviews. Interviews combined: 1) symptom mapping to delineate meaningful symptoms/impacts of disease, 2) cognitive interviewing to assess content validity of digital measures, and 3) mapping of digital measures back to personal symptoms to assess relevance from the patient perspective. Content analysis and descriptive techniques were used to analyze data.
Results:
Participants perceived mapping as deeply engaging, with 39/40 reporting improved ability to communicate important symptoms and relevance of measures. Most measures (9/10) were rated relevant by both cognitive interviewing (70–92.5%) and mapping (80–100%). Two measures related to actively bothersome symptoms for more than 80% of participants (Tremor, Shape rotation). Tasks were generally deemed relevant if they met three participant context criteria: 1) understanding what the task measured, 2) believing it targeted an important symptom of PD (past, present, or future), and 3) believing the task was a good test of that important symptom. Participants did not require that a task relate to active symptoms or “real” life to be relevant.
Conclusion:
Digital measures of tremor and hand dexterity were rated most relevant in early PD. Use of mapping enabled precise quantification of qualitative data for more rigorous evaluation of new measures.
Keywords
INTRODUCTION
Current clinical outcome measures do not perform well in people with early Parkinson’s disease (PD), and there is an urgent need to develop more sensitive measures to support development of new therapeutics [1, 2]. Digital health technologies (DHTs) can capture finer variations in symptoms across a range of neurological conditions and hold great potential for monitoring disease progression and responsiveness to treatment [3–5], which has led to increasing use in clinical trials [6–8].
Although capable of detecting symptoms at more granular levels than standard clinical monitoring methods [9–11], these resources remain underutilized [12], with poor understanding as to whether new technologies are capturing aspects of disease that are meaningful from the patient perspective— which is a key consideration in regulatory approval of new devices [13–16]. This has led to increased emphasis on need for patient centric approaches to developing digital outcome measures (i.e., prioritizing sensor features relevant to patients’ functioning in everyday life) [13], and recommendations to define meaningful aspects of health [17, 18]. However, pursuit of actionable patient experience data has proved challenging, with quantitative approaches being generally inadequate to capture the depth of personal experiences, and qualitative approaches lacking the consistency and precision needed to determine prevalence of perspectives and experiences [13]. This has resulted in difficulty connecting patient experiences to digital measures in a way that is useful, scalable, and translatable to other contexts [19]. Thus, new approaches for identifying meaningful aspects of health and relevance of potential monitoring technologies are needed to support the selection of endpoints for clinical trials [8, 20]. This paper describes a mixed-methods study that utilized novel symptom mapping techniques to evaluate relevance of digital monitoring technology to people with early PD. The specific aims were to understand whether WATCH-PD smartphone and smartwatch measures were considered relevant to monitoring meaningful aspects of disease and disease progression from the patient perspective.
METHODS
Study background
This study was designed under guidance of the Critical Path for Parkinson’s Consortium, US Food & Drug Administration (FDA), industry and academic partners, and people with Parkinson’s. The study was conducted in follow up to the WATCH-PD (Wearable Assessments in The Clinic and at Home in PD) study [21], hereafter termed “parent study.” The WATCH-PD parent study was a 12-month multi-center observational trial that evaluated ability of smartwatch and smartphone applications to monitor PD symptoms and disease progression in people with early, untreated PD (≤2 years diagnosis, Hoehn & Yahr stage≤2). Eighty-two individuals with PD and 50 controls completed in-clinic visits at baseline, 1, 3, 6, 9, and 12 months, and in-home assessments of ten smartphone and smartwatch-based tasks related to motor and cognitive function (Table 1) bi-weekly for one year (IRB#00003002; NCT03681015).
WATCH-PD digital measures evaluated for relevance from the patient perspective
BrainBaseline application screenshots reprinted with permission from Clinical ink.
Setting, sample
Individuals with PD who completed their final parent study visit within 6 months [22] were eligible to participate (N = 54) as depicted in the enrollment flowchart (Fig. 1). All non-white participants (N = 4) were solicited, with purposeful sampling to otherwise mirror parent study demographics. Participants were screened by phone and incentives were offered for participation ($50/survey; $75/interview). IRB approval (University of Rochester IRB# 00006429) and digital informed consent was obtained.
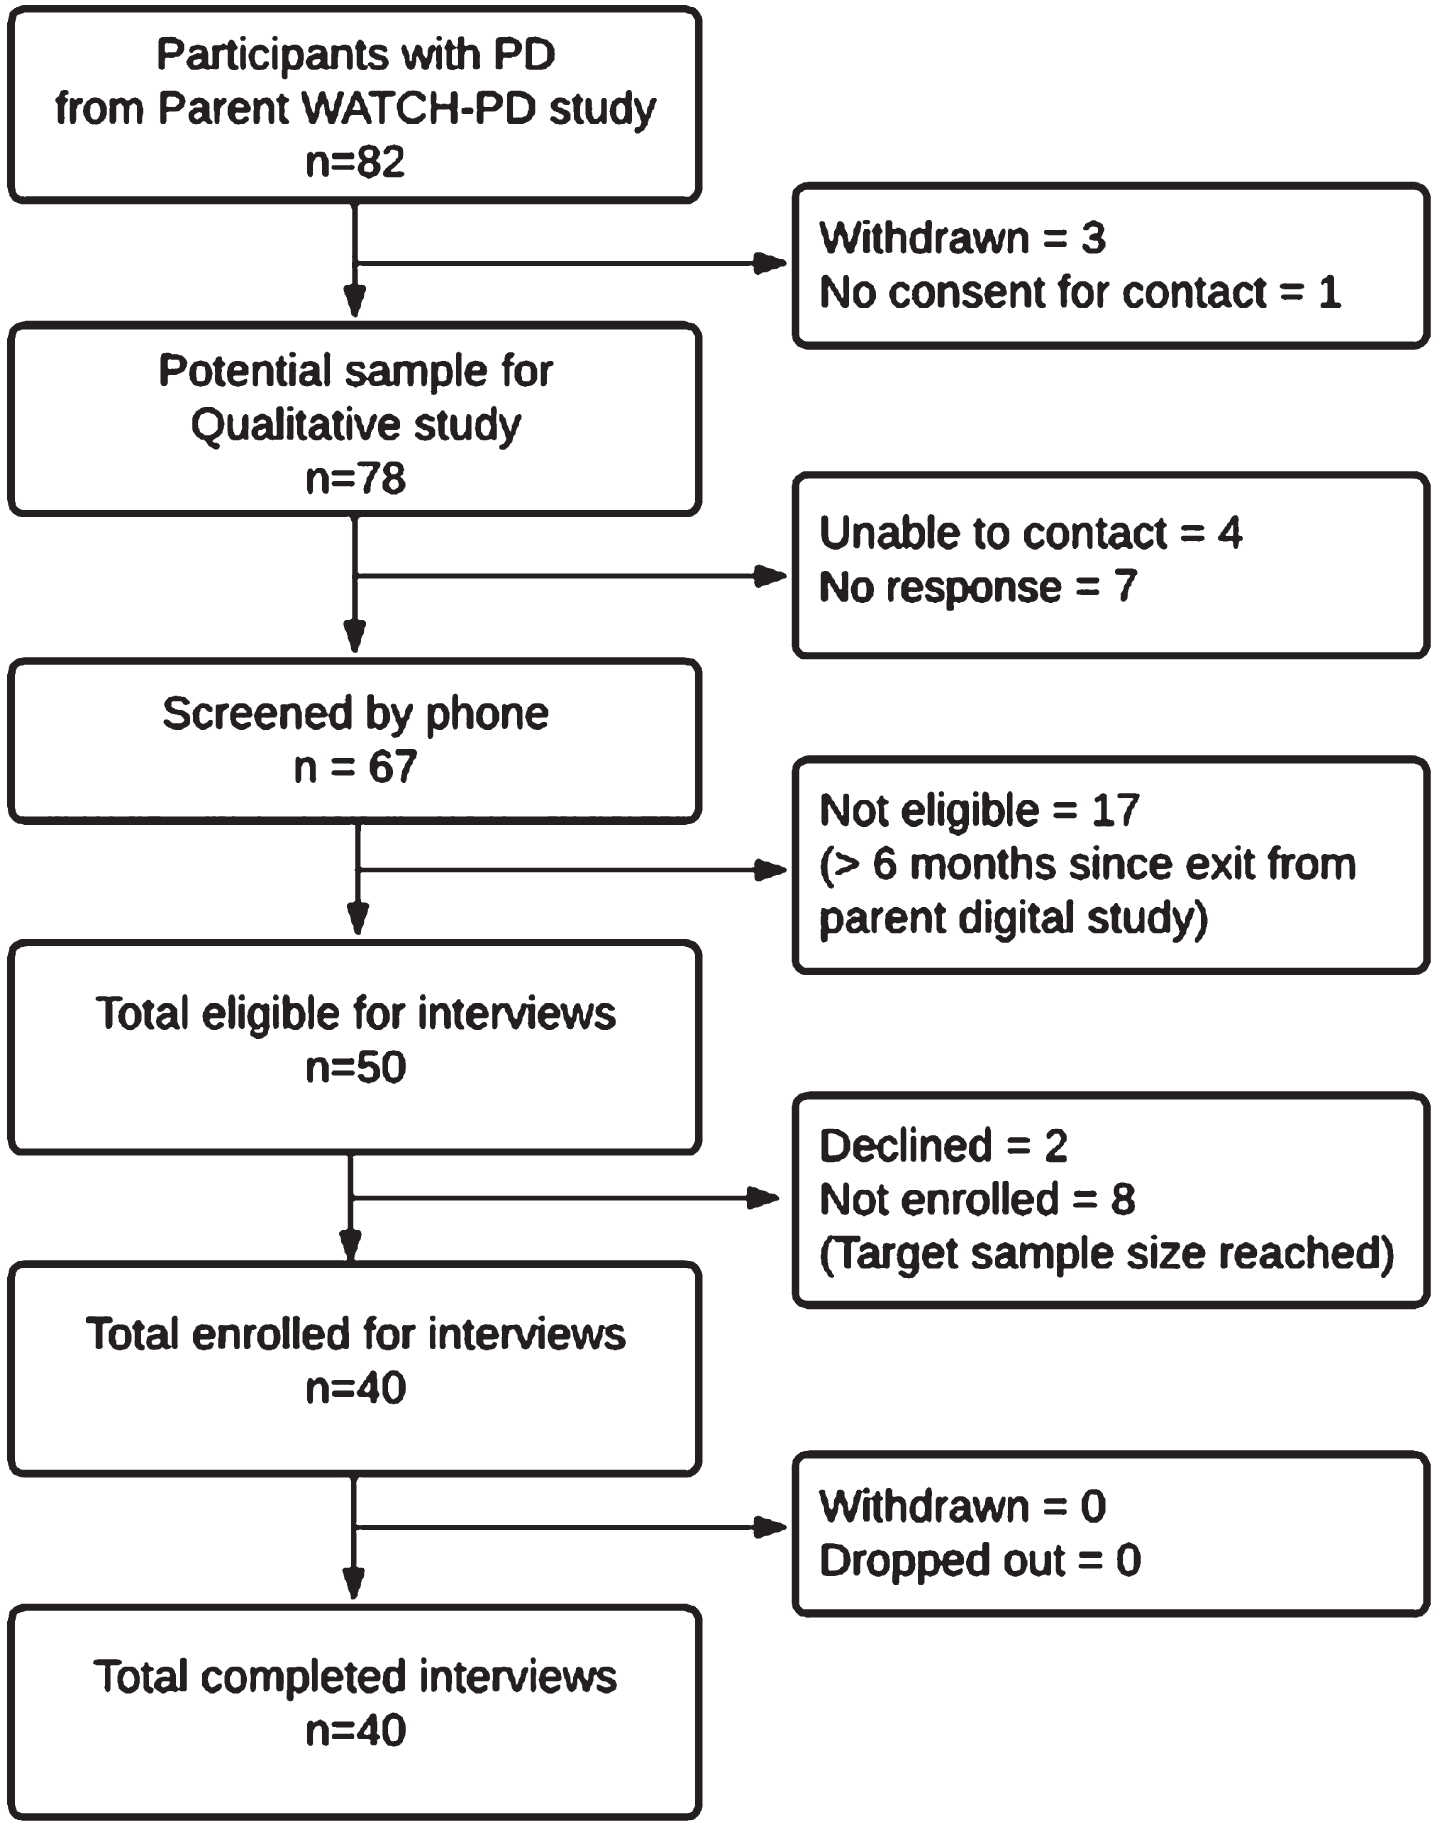
WATCH-PD qualitative study participant enrollment diagram.
Data collection
A integrated mixed-methods design was used. This consisted of (A) a web-based survey of current PD symptoms and perceptions of WATCH-PD tasks (Appendix A), followed 1-week later by (B) a 90-minute online interview with 1) symptom mapping to identify meaningful symptoms and impacts of disease; 2) cognitive interviewing to generate content validity evidence for the WATCH-PD digital monitoring technology; 3) mapping of digital measures back to meaningful symptoms; and 4) mapping hypothesized symptoms of interest targeted by the digital measures.
Redcap survey [23, 24]
Demographic information was collected for gender, race/ethnicity, years since PD diagnosis, and any PD medication use, along with current PD symptoms and personal relevance of WATCH-PD digital measures, which were used as a starting point to inform the mapping process.
Online interviews
In-depth interviews were conducted with each participant by JM (white, female, PhD prepared nurse practitioner, unacquainted with participants, and unaffiliated with parent study) via Zoom video-conferencing, and were recorded with permission (years 2021— 2022). A semi-structured protocol was used (Appendix B).
Interview Part 1: Symptom mapping
Part 1 focused on delineating symptoms and impacts of PD using new symptom mapping techniques. Symptom mapping (Fig. 2) is a digital extension of symptom-response card-sorting, which is a technique that has been successfully used in other chronic diseases to map symptom trajectories and self-management behaviors [25–27]. This qualitative technique enables participants to create an ordered visual representation (i.e., a “map”) of personal experiences using index cards to define symptoms and responses to or impacts of symptoms. For this study, mapping was accomplished using XmindTM software. Yellow nodes represented symptom “cards” and dependent line nodes represented impacts and details about symptoms [28]. Using screen sharing, the participant and interviewer jointly viewed and co-created the symptom map, with iterative discussion and revision to ensure the participant’s experience was represented accurately. A step-by-step diagram of the process is presented in Supplement A and Supplement B and summarized below.

Sample symptom map.
Part 1, Step 1: Pre-interview map (preparation for interview)
Each participant’s survey responses were reviewed prior to the online interview and a preliminary map using the survey data was developed by the interviewer as a starting point for discussion. Self-reported symptoms (yellow nodes) were tentatively entered into a blank map with the following quantitative categories: “Most bothersome;” “Somewhat bothersome;” “A little bothersome;” “Not bothersome,” “No current issues but personally important,” and “Not relevant to early PD.”
Part 1, Step 2. Mapping spontaneously reported symptoms
At the start of the interview, participants were oriented to the mapping process and shown the baseline map. Building on this, participants were asked to describe in detail all personally meaningful symptoms of PD, including correcting or redefining any symptoms entered from the survey. As directed and approved by the participant, symptoms and supporting details were entered into the map using concise summaries.
Next, participants were asked to explain what made specific symptoms bothersome and how these affected them on a day-to-day basis, with details about impacts entered as dependent nodes. For example, a participant with difficulty walking might define this as insufficient foot lift, causing tripping on uneven surfaces, resulting in decreased ability to go hiking. When finished describing a symptom, participants were asked to review for correctness. Once validated, sections were collapsed to show only the symptom node to minimize information on the screen. As needed, symptom nodes could be reopened to add additional details, enabling iterative correction and revision.
Part 1, Step 3: Mapping probed symptoms not spontaneously reported
After exploring spontaneously reported symptoms and impacts, participants were asked about common PD symptoms not reported (i.e., difficulties with tremor, walking, balance, fine motor, speech, thinking, mood, daytime sleepiness, tiredness/fatigue, depth-perception). If these symptoms were not experienced, they were categorized as “No current issues” if considered personally important, or “Not relevant to early PD” based on the participant’s viewpoint. When finished, the map was collapsed to show only symptoms in list view, with supporting details and impacts hidden.
Part 1, Step 4: Reordering and ranking symptoms by bothersomeness
Next, participants were asked to review the condensed map to ensure all personally meaningful symptoms were reflected. Symptoms were then reordered by bothersomeness from top to bottom and rank ordered inside each bothersomeness category as directed by the participant.
Part 1, Step 5: Identifying most important and most bothersome symptoms
Lastly, participants were asked to indicate which symptoms were personally most important versus most bothersome to them, and to explain rationales for any differences. These high-priority symptoms were identified via “call-out” brackets highlighting symptoms and rationales. The final map was saved and duplicated for Part 3 of the interview.
Interview Part 2: Cognitive interviewing on WATCH-PD tasks
Following a brief break, the interviewer performed cognitive interviewing on 10 digital measures completed during the WATCH-PD study (Table 1). The participant was shown an image of each measure via screen-sharing and was asked four standardized questions. Questions were designed to assess 1) if the participant understood how to perform the measure correctly (Table 1. Actions required to perform assessment), 2) if the measure related to personally important symptoms of PD, 3) if the measure related to personal impacts and activities of daily living, and 4) if the participant believed the measure was relevant to monitoring the progression of their PD. Additional questions exploring general perceptions of the digital measures were included (Appendix B).
Interview Part 3: Mapping tasks back to personally important symptoms
Next, participants were asked to integrate a small pictograph of each measure into their personal map next to the symptom(s) they felt it was relevant to. This was used to confirm whether the task captured meaningful aspects of disease or corresponded with bothersome symptoms.
Interview Part 4: Mapping symptoms of interests to personal symptoms
Lastly, participants reviewed and integrated symptoms of interest the WATCH-PD tasks were intended to measure. This final step was used to confirm the extent to which symptoms of interest to the research team aligned with personally important symptoms for the patient. The interview concluded with closing questions and a final opportunity to review and modify the personal symptom map. Participants were emailed images of their personal symptom maps at the conclusion of the interview, if desired.
Data analysis
This study used COREQ criteria to guide reporting of qualitative findings.
Content coding [29]
Coding was conducted by JM, PY, and RS (>97% convergence) as delineated in Table 2. Discrepancies were resolved by discussion with the analytic team who were diverse with regards to sex, age, race/ethnicity, background, and research expertise. Symptom maps were analyzed for types, frequencies, bothersomeness, and importance of symptoms and impacts, and association with digital measures. As seen in Fig. 3, each map level was assigned a Patient Reported Symptom Score (PRSS), representing the highest level of bothersomeness a symptom occurred at within a given map. Relevance of each digital measure was calculated based on association to symptoms. For example, if a participant placed the Tremor Task next to the symptom “Tremor” at the “most bothersome” position in the symptom map, it would be associated with a PRSS of 4. If associated with more than one symptom (e.g., Walking & Balance), digital measures were valued at the highest level they occurred at within a map and counted once per participant.
Coding cycles for analysis of maps and interviews
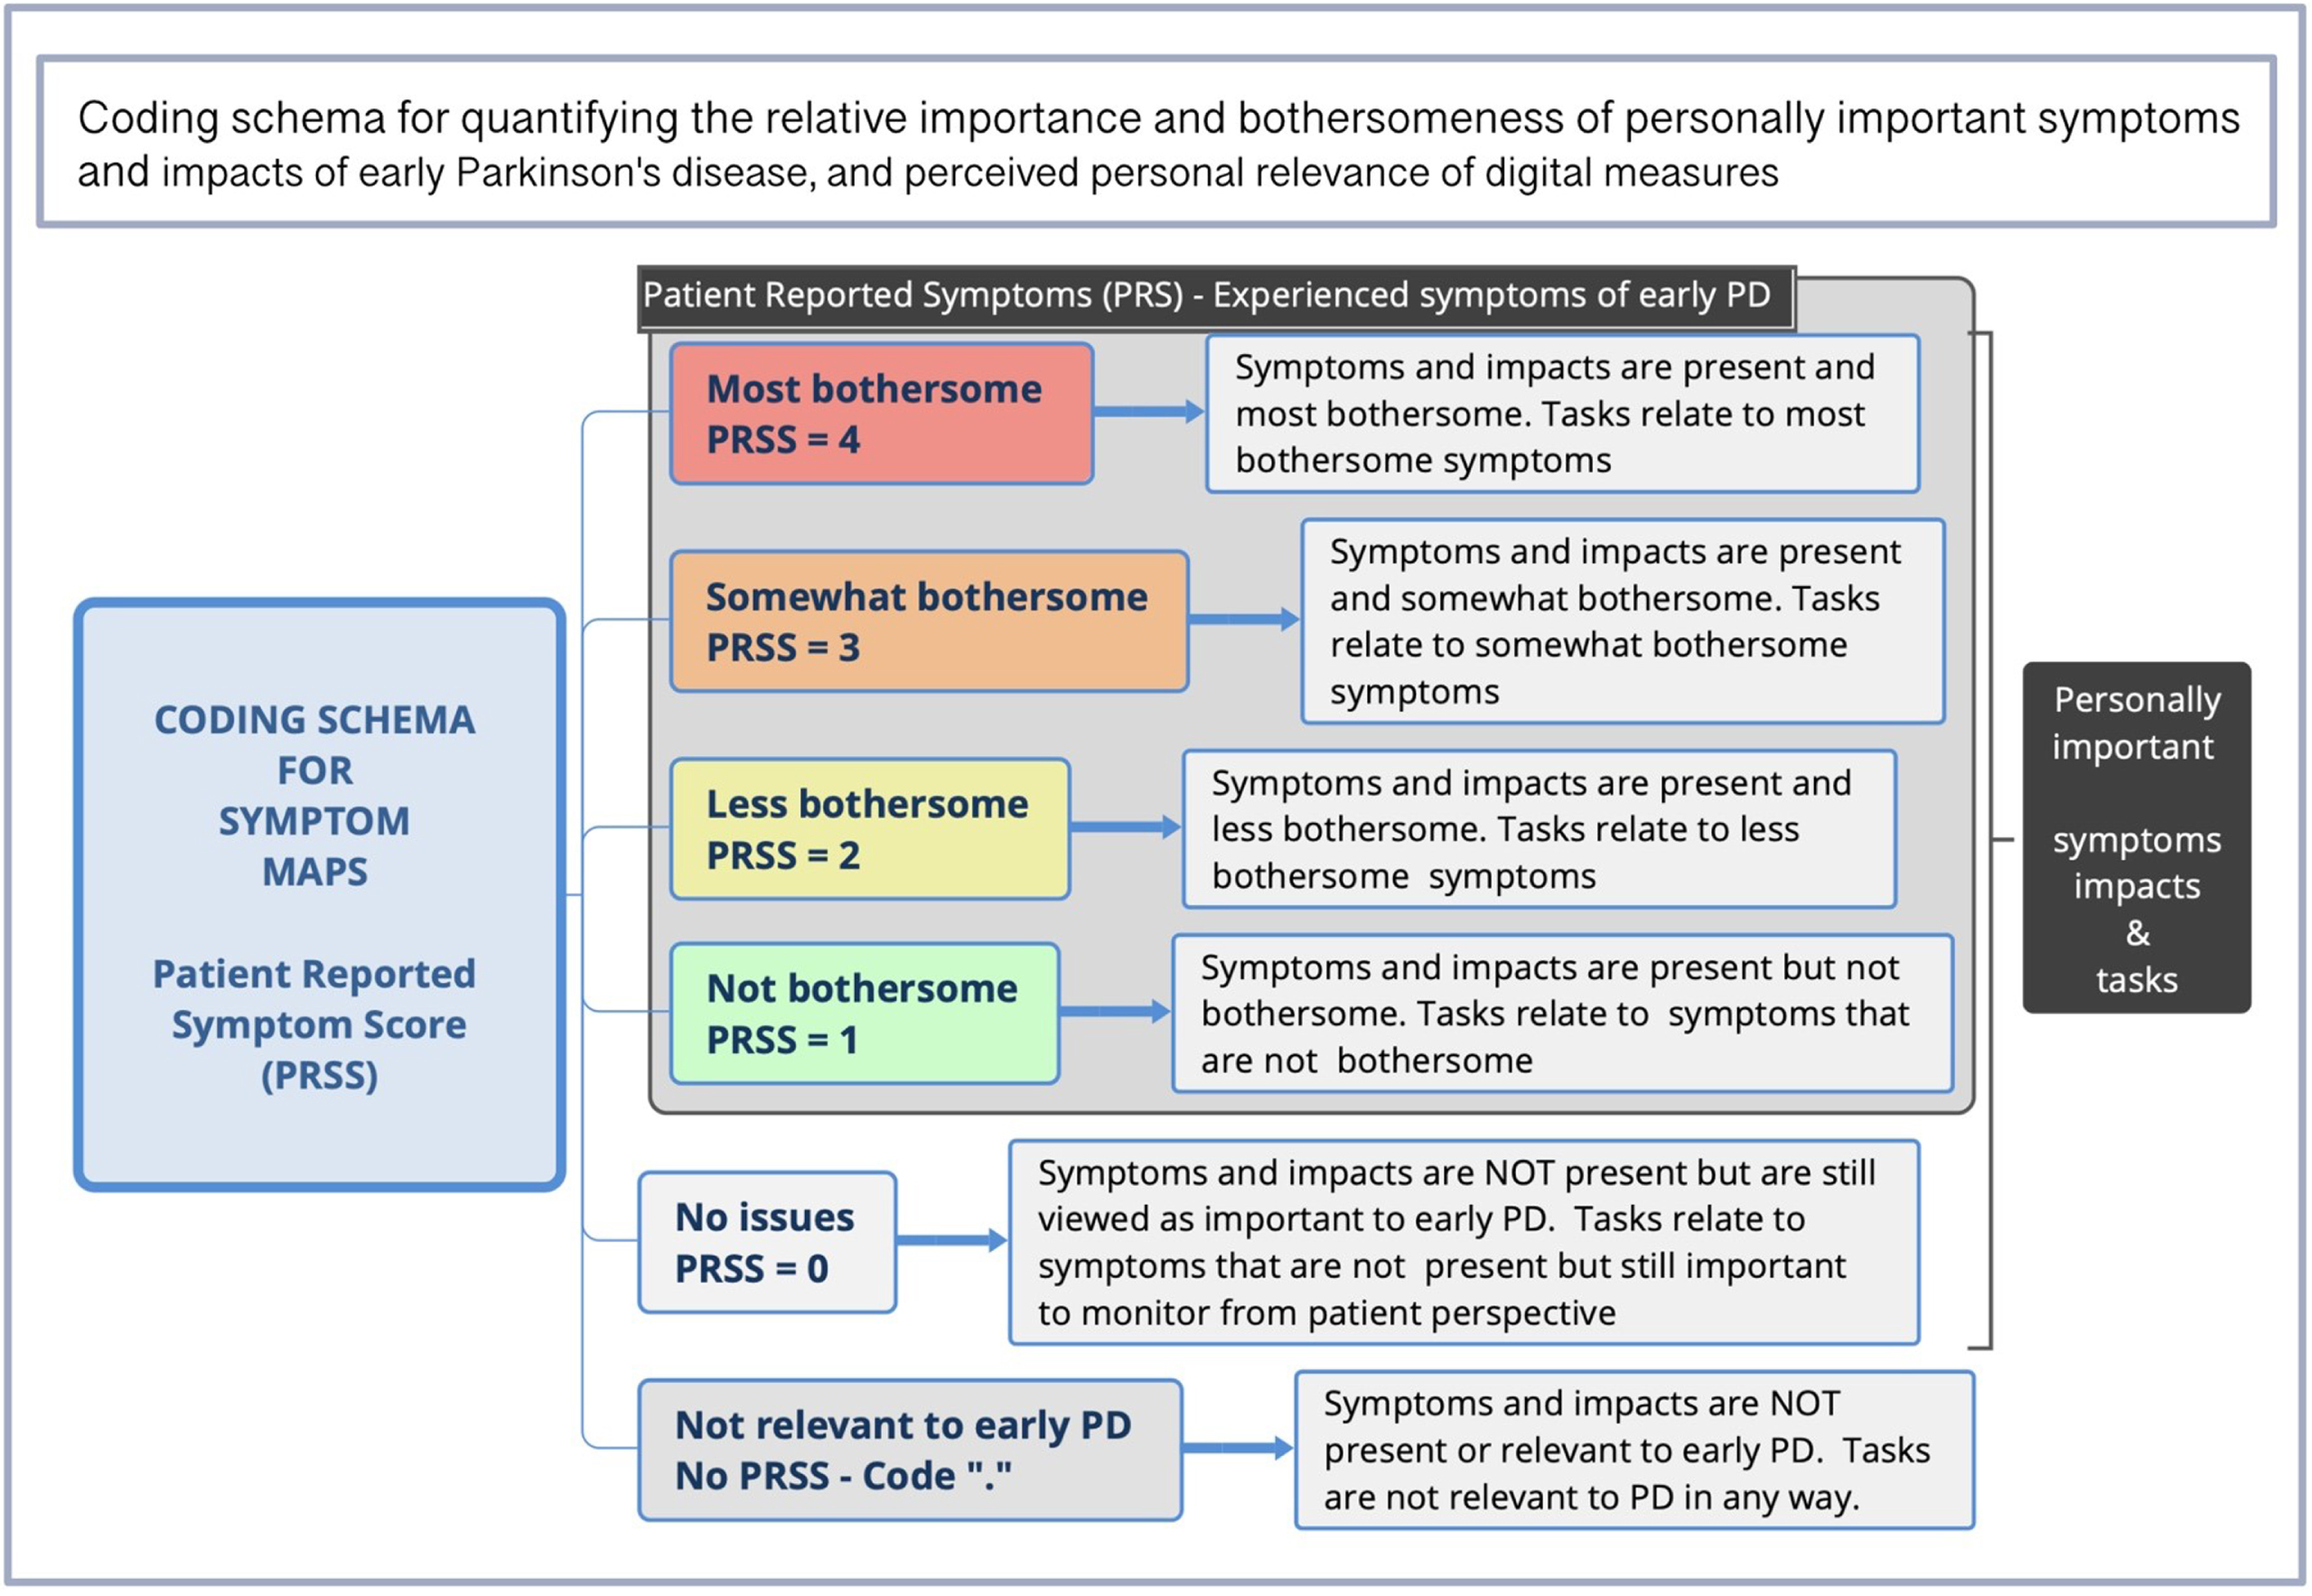
Coding schema for assessing relevance of digital measures to meaningful symptoms.
Statistical tests
Independent T-tests were used to assess for between group differences based on any/no PD medication use using SPSS28. Cramer’s V (effect size for Chi-square test of independence) was calculated to assess strength of relationship between cognitive interviewing and map ratings of relevance, with very strong relationship defined as > 0.25 [30]. Descriptive statistics were computed for survey items.
Thematic analysis [31, 32]
Narrative interviews were transcribed, deidentified, and thematically analyzed using Nvivo12, XmindTM and Excel as delineated in Table 2.
Rigor and validity
Data collection instruments and procedures were developed under advisement from the FDA and in collaboration with people with Parkinson’s disease (JC, JH). Two 90-min pretest interviews were conducted with people with PD prior to implementation, followed by observation of initial interviews to ensure consistency (RS). Data collection and analysis were performed by researchers unaffiliated with the parent study to minimize bias. Other measures to enhance validity included triangulated data collection, member-checking, peer-debriefing to refine emerging themes, use of multiple coders, and a formal audit trail [33]. Data saturation (i.e., point after which no new data was identified in subsequent interviews) was assessed in addition to stability ratings (point at which average of scores remained stable within +/–10% of the final mean) [34, 35]. Quotes throughout are presented with numeric identifiers to demonstrate representativeness.
RESULTS
Sample and Interview characteristics
Table 3 displays demographics comparative to the parent study. Recorded interviews lasted 102 min on average, with no substantive technological issues. Feasibility metrics and interview characteristics are presented in Supplement C. Data saturation for symptom types reported by > 10% of the sample was 100% by the 17th interview, and 100% for impacts by the 10th interview in this relatively homogenous sample (Supplement D). All major themes were observed within the first two interviews and measurable as expressed by the majority (>80%) by the 20th interview.
Demographic characteristics of the sample comparative to the parent WATCH-PD study
*PD duration represents the time since diagnosis with Parkinson’s disease at time of parent vs. substudy data collection.
Cognitive interviewing: Content validity of WATCH-PD digital measures
Frequencies and percentages of positive demonstration of understanding and relevance of WATCH-PD tasks are shown in Table 4. With the exception of Finger Tapping (1/40 incorrect answer), all participants demonstrated they understood what each of the 10 tasks was asking them to do for completion. The task most relevant to personal PD symptoms by cognitive interviewing was Shape Rotation (87.5%), followed by Tremor (85%) and Finger Tapping (85%). Less than half of participants found Visual Spatial Memory (47.5%), Phonation (42.5%), Reading (37.5%), Articulation (37.5%), and Verbal Symbol Swap tasks (35%) to be relevant to personal PD symptoms. Most participants were able to provide examples of how each task related to activities in their daily life (range 59% [Visual Spatial Memory] to 97.5% [Walking & Balance]) and believed tasks were important for measuring the progression of PD (52.5— 97.5%). Excluding Visual Spatial Memory and Phonation, all other tasks (8/10) were definitively endorsed as personally relevant by greater than 85% of participants.
Frequency and percentage of positive demonstration of understanding and relevance of WATCH-PD tasks during cognitive interviewing vs. mapping
aN = 39; bYes = definitive endorsement of relevance; No = definitive rejection of relevance; Qualified = marginal answer in which participant could not categorically endorse or reject personal relevance and gave a qualified answer (ex. “Yes, but only if they fixed the technical issues” or “No, but if I developed symptoms, I would want to monitor for it”). cCramer’s V is an effect size of Chi Square test of independence between categorical variables. Polychloric Correlation was not used due to non-normal distribution of data. dUnable to run Cramer V due to lack of heterogeneity in response to Tremor task on mapping. Cramer’s V effect sizes *>0.25 are considered to indicate a strong relationship and **>0.35 a very strong relationship (df = 2).
Symptom maps: Relevance of tasks to bothersome symptoms
As shown in Fig. 4 (Graph A), tasks that were most relevant to actively bothersome symptoms were the Tremor task (92.5%; relevant to tremor), Shape Rotation, Finger Tapping, (82.5%, 77.5% respectively; relevant to fine motor) and Trails A&B (65%; perceived as relevant to fine motor and thinking), Walking & Balance (55%; relevant to general mobility), and Verbal Symbol Swap (52.5%; relevant to cognitive function). Speaking tasks (Reading, Phonation, Articulation) and Visual Spatial Memory were less often relevant to active symptoms (<50%).
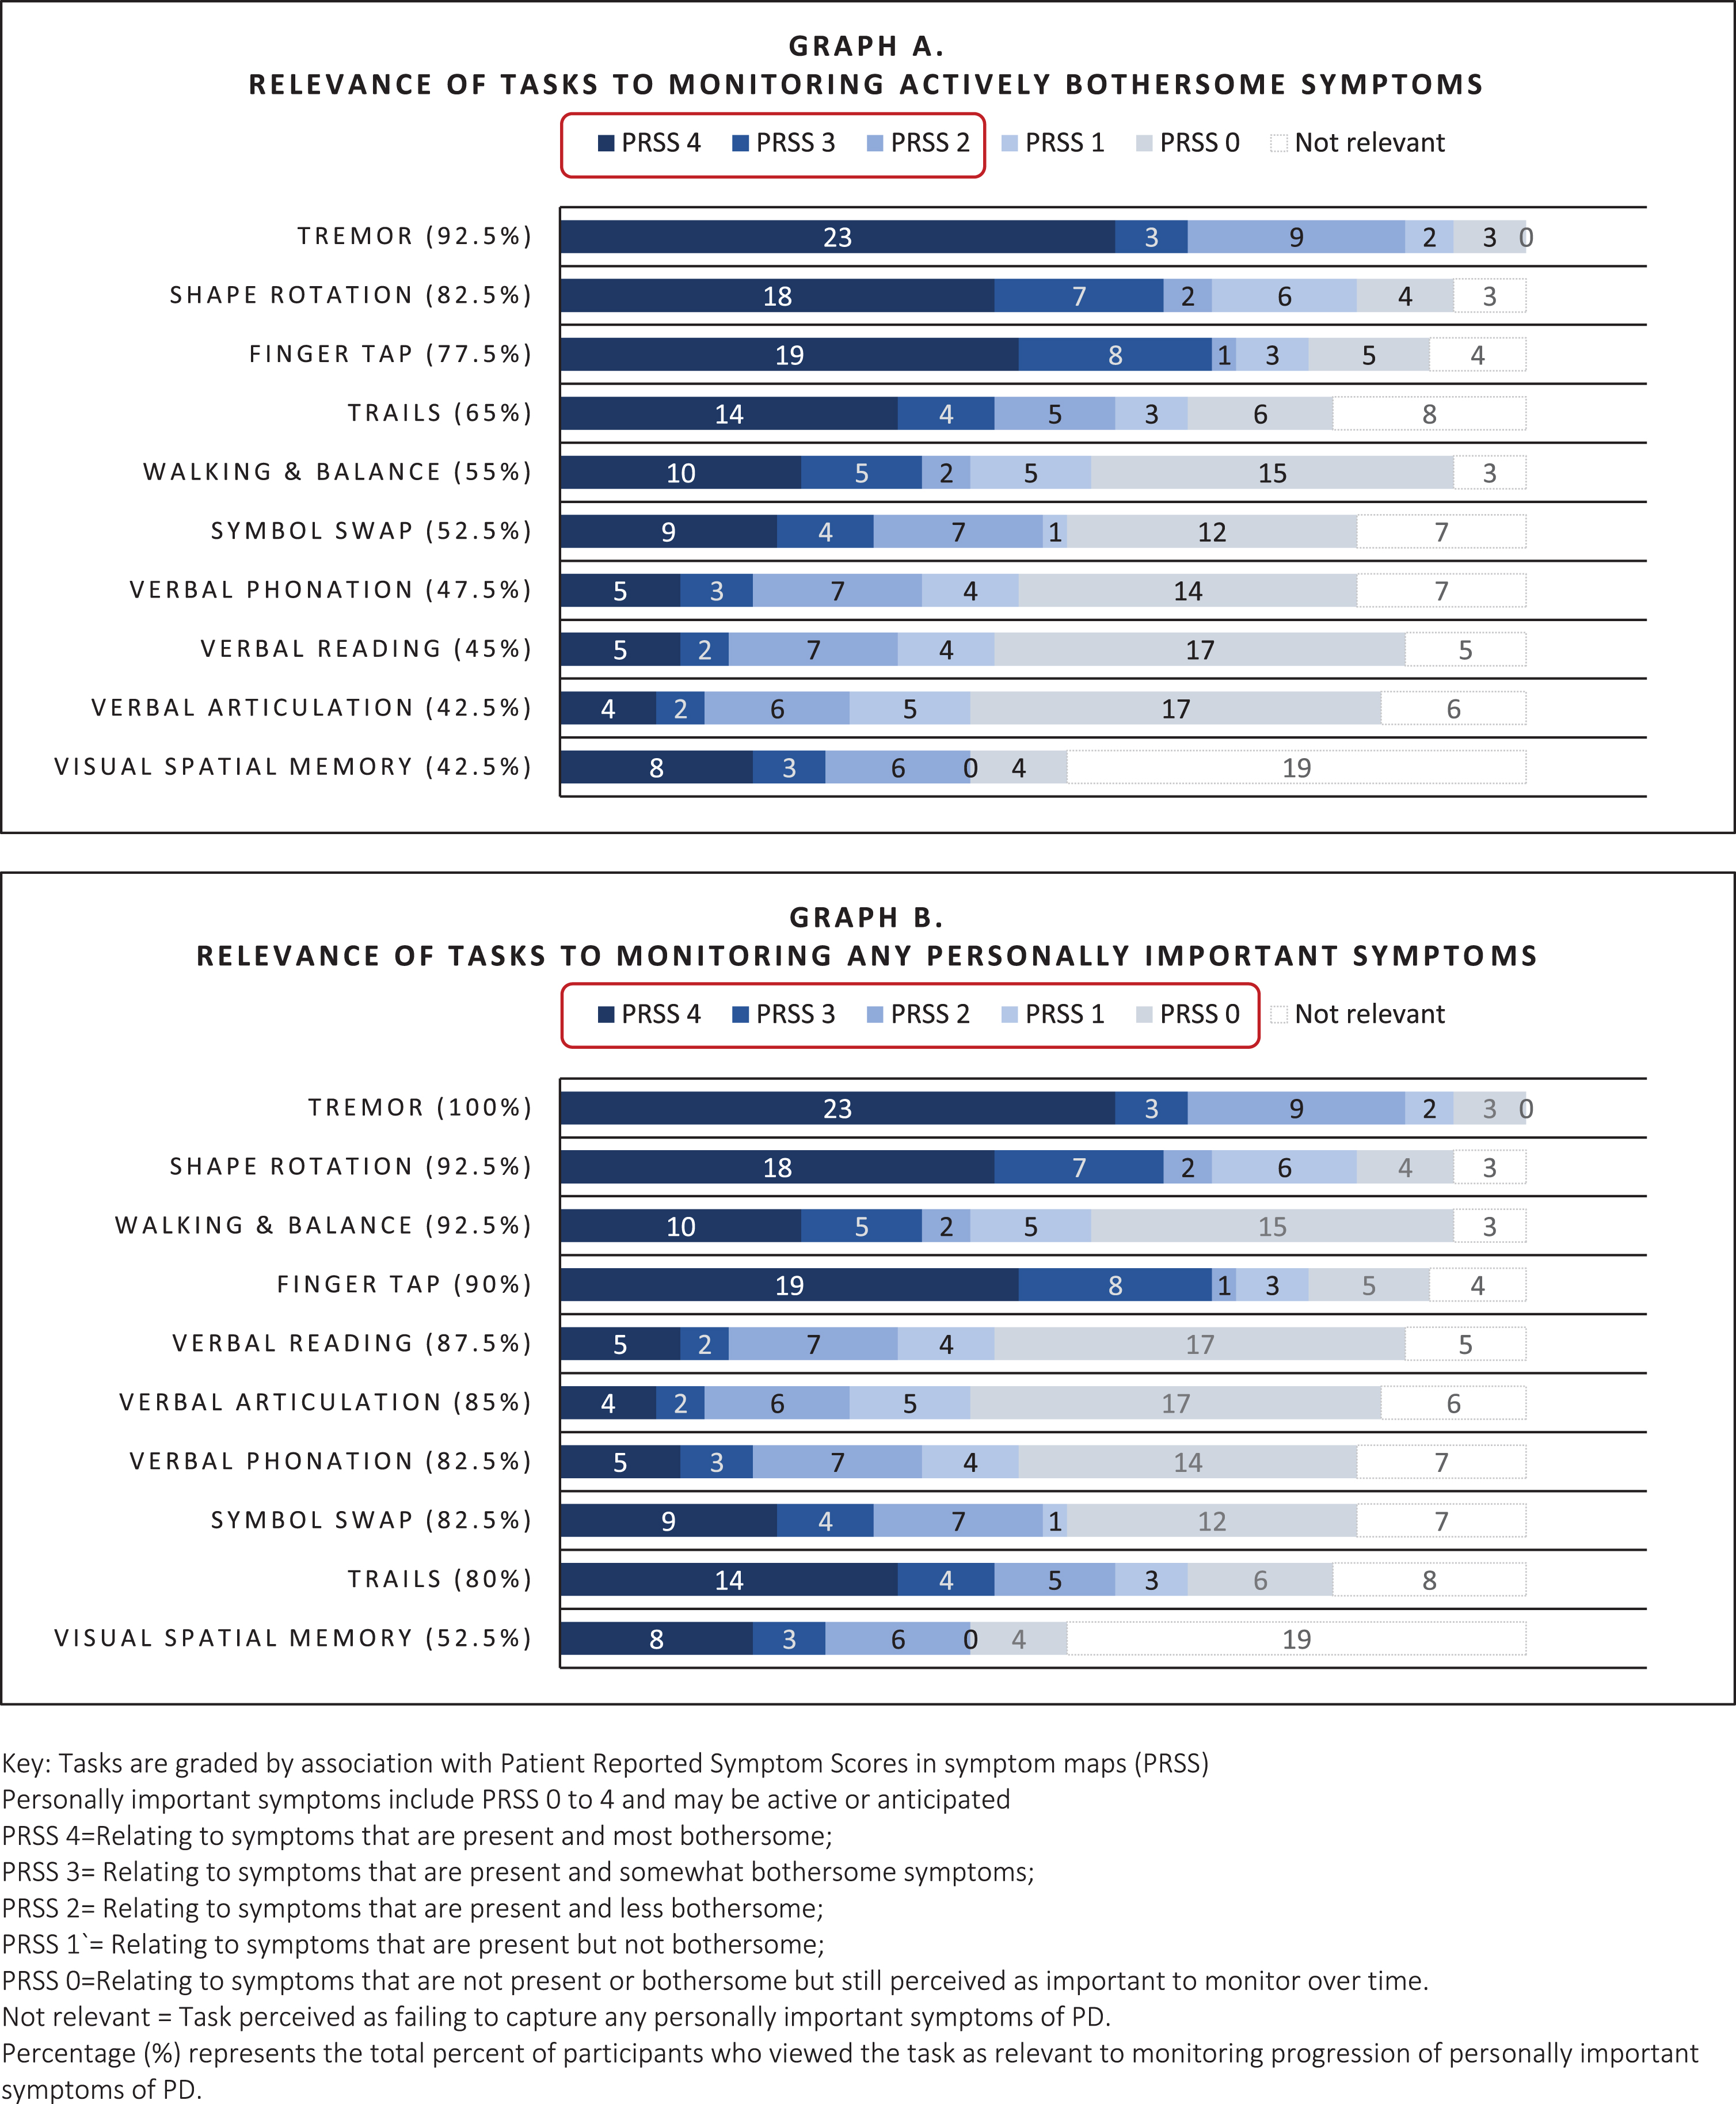
Relevance of digital measures to monitoring personally important symptoms of early PD as elicited by mapping.
Symptom maps: Relevance of tasks to personally important symptoms
Personally important symptoms included symptoms that were past (resolved) present or anticipated (i.e., impactful symptoms that could occur in the future). For example, a participant who did not currently have difficulty with articulation might perceive tasks monitoring speech as relevant to an important future symptom, as seen here:
As shown in Fig. 4 (Graph B), all tasks, excluding Visual Spatial Memory, were rated as relevant for monitoring personally important symptoms to the majority (>80%). While speaking tasks often did not relate to actively bothersome symptoms, they were relevant to more than 80% of people as important future symptoms. Visual Spatial Memory was commonly criticized for being difficult to complete, causing frustration, and failing to measure symptoms specific to PD, and was therefore rated as relevant by fewer people (52.5%).
Correlations
As shown in Table 4, convergence between cognitive interviewing Q4 (relevance of task to monitoring progression of PD) and relevance to monitoring personally important symptoms rated by mapping was high (67.5 [Visual spatial Memory]— 97.5% [Tremor]) with evidence of strong association between ratings of relevance across all tasks (Cramer’s V > 0.25). Non-convergence increased if participants were unsure what the test measured or believed the test was technically flawed, with 50% nonconcordance accounted for by items where participants were unable to give a categorical response (yes/no) to assessment of relevance, as illustrated in these examples:
In these instances, participants often modified ratings of relevance between methods, suggesting that variability was due to ambiguity in perception of the task.
Summary of themes relating to relevance of measures
Three themes were identified relating to how participants perceived relevance of WATCH-PD measures for monitoring early PD. In general, participants felt that digital measures were meaningful and should be retained for monitoring if they reliably captured any important symptoms of PD— whether actively experienced or not (Themes 1 and 2). However, there was some concern about negative psychological impact related to frequent monitoring of PD symptoms (Theme 3).
Relevant measures fell into two categories: 1) those that appeared related to personal symptoms actively experienced and 2) those that appeared related to personally important symptoms of Parkinson’s not currently experienced by the participant (i.e., past or anticipated possible future symptoms of concern or common symptoms of PD). Supplement E presents a detailed delineation of the five criteria on which participants consistently based their evaluation of personal relevance of WATCH-PD measures during interviews (hereafter called “Participant Criteria”). In general, participants endorsed measures as relevant if three Participant Criteria were met— the individual believed 1) they understood what was being evaluated (purpose of measure), 2) the measure related to an important symptom of PD, and 3) the measure was a good test of the symptom. Often, WATCH-PD measures were considered relevant even when they did not relate to activities in daily life or were a personally experienced symptom, provided other Participant Criteria were met. Understanding what the measure required to complete it was not a referenced factor in personal relevance evaluations.
Some slight uncertainty was tolerated regarding what the measure was targeting (Participant Criteria 1), but if measures failed to satisfy Participant Criteria 2 and 3 (related to important PD symptoms and a good test), they were always deemed not relevant. For example, the Visual Spatial Memory was often viewed as not capturing a symptom specific to PD and was thus considered less relevant overall. However, participants indicated ambiguous measures could become relevant if data demonstrated ability to pick up subtle variations in important PD symptoms not apparent otherwise, as seen in the following quotes:
Many participants indicated that they believed it was important to measure common symptoms of PD even when they did not personally experience those symptoms (Criteria #5). Rationales were based on participant’s understanding that PD has wide variability in symptom expression and disease progression, and that new symptoms could onset at any point. Participants believed that digital measures had the potential to pick up subtle deficits and new symptoms at the earliest possible onset and felt that early detection was key to understanding and monitoring disease progression and developing better treatments. Furthermore, many reported being personally committed to partnering with researchers for the sake of themselves, family members who might later develop PD, and the broader benefit of society as a rationale for monitoring symptoms that were not yet present. This is illustrated in the following quotes with supporting data in Supplement F:
Theme 3. Active monitoring can have negative emotional impact that affects sense of well-being and engagement with the digital measurement, particularly if challenging to perform.
Participants reported that when they perceived themselves as not performing well, they sometimes experienced negative emotional consequences, such as anxiety, stress, worry about disease progression, or sense of failure. For example:
This sense of failure resulted in some participants being less willing to complete a task, approaching the activity with anxiety, finding ways to “game” the system to improve scores and sense of competence, and practicing to improve performance. Supporting data for this is presented in Supplement G, and is illustrated below:
Conversely, when participants were able to perform easily at a level they felt was equivalent to a person without PD, they experienced a sense of relief and felt more positively about the digital measure and their PD state. For this reason, in addition to detecting symptom onset, many people preferred to retain items that measured important symptoms of PD not currently present, as seen here:
Participants’ perspectives of mapping
Table 5 presents representative quotes showing participant perceptions of the mapping process, which was strongly positive. Nearly all (39/40) reported that mapping enabled a more comprehensive discussion of their PD experiences. For example:
Quotes showing participant experiences with symptom mapping
While most indicated they enjoyed the interview (95%), two found the in-depth discussion distressing and were offered the option to discontinue the interview. Distress was precipitated by deep reflection and heightened awareness of physical or cognitive decline. As one woman stated:
Despite this, both elected to continue the interview and expressed positive perceptions of mapping. Of 40 participants, 95% (38/40) asked to receive copies of their maps, and several indicated that opportunity to receive the maps had been an incentive to study participation.
DISCUSSION
This is the first study to use symptom mapping to explore relevance of digital measures for monitoring meaningful aspects of disease from the perspectives of people with early PD. Overall, nine of the ten WATCH-PD measures were rated as relevant by both cognitive interviewing and mapping methodologies (70–92.5% vs. 80–100% respectively; Table 4). However, only two related to current, bothersome symptoms for more than 80% of participants (Tremor, Shape Rotation). Yet, our data suggested that eliminating measures based on lack of current symptoms may not align with patient preferences. For instance, nearly all speech tests were considered relevant (>80%) despite few reporting symptoms in this area (<50%). Thus, assessment of common impactful symptoms might be warranted prior to onset to support early detection, trending, and treatment, as has been suggested elsewhere [36, 37].
We observed that “relevance” of digital measures was based on three person-centric criteria not commonly captured in traditional content validity assessments: 1) believing they understanding what was being measured, 2) believing it targeted an important symptom of PD (past, present, or future), and 3) believing the measure was a good test. Conversely, participants did not require a measure to mimic “real” life to be personally relevant. These findings highlight differences in participant vs. research perspectives and underscore regulatory recommendations to prioritize patient experiences in development of clinical outcome assessments [8, 39]. Thus, evaluation of context validity (i.e., the DHT experience from the participant perspective) [40] in conjunction with content validity from the research perspective may be needed to achieve measures that are truly fit-for-purpose. A proposed approach to assessment of future measures inclusive of both components is presented in Fig. 5. Movement towards standardized assessment can improve understanding of relevance for diverse contexts-of-use [41]. Greater transparency regarding disclosing the purpose and capabilities of monitoring technologies could also enhance perceived relevance for patients.
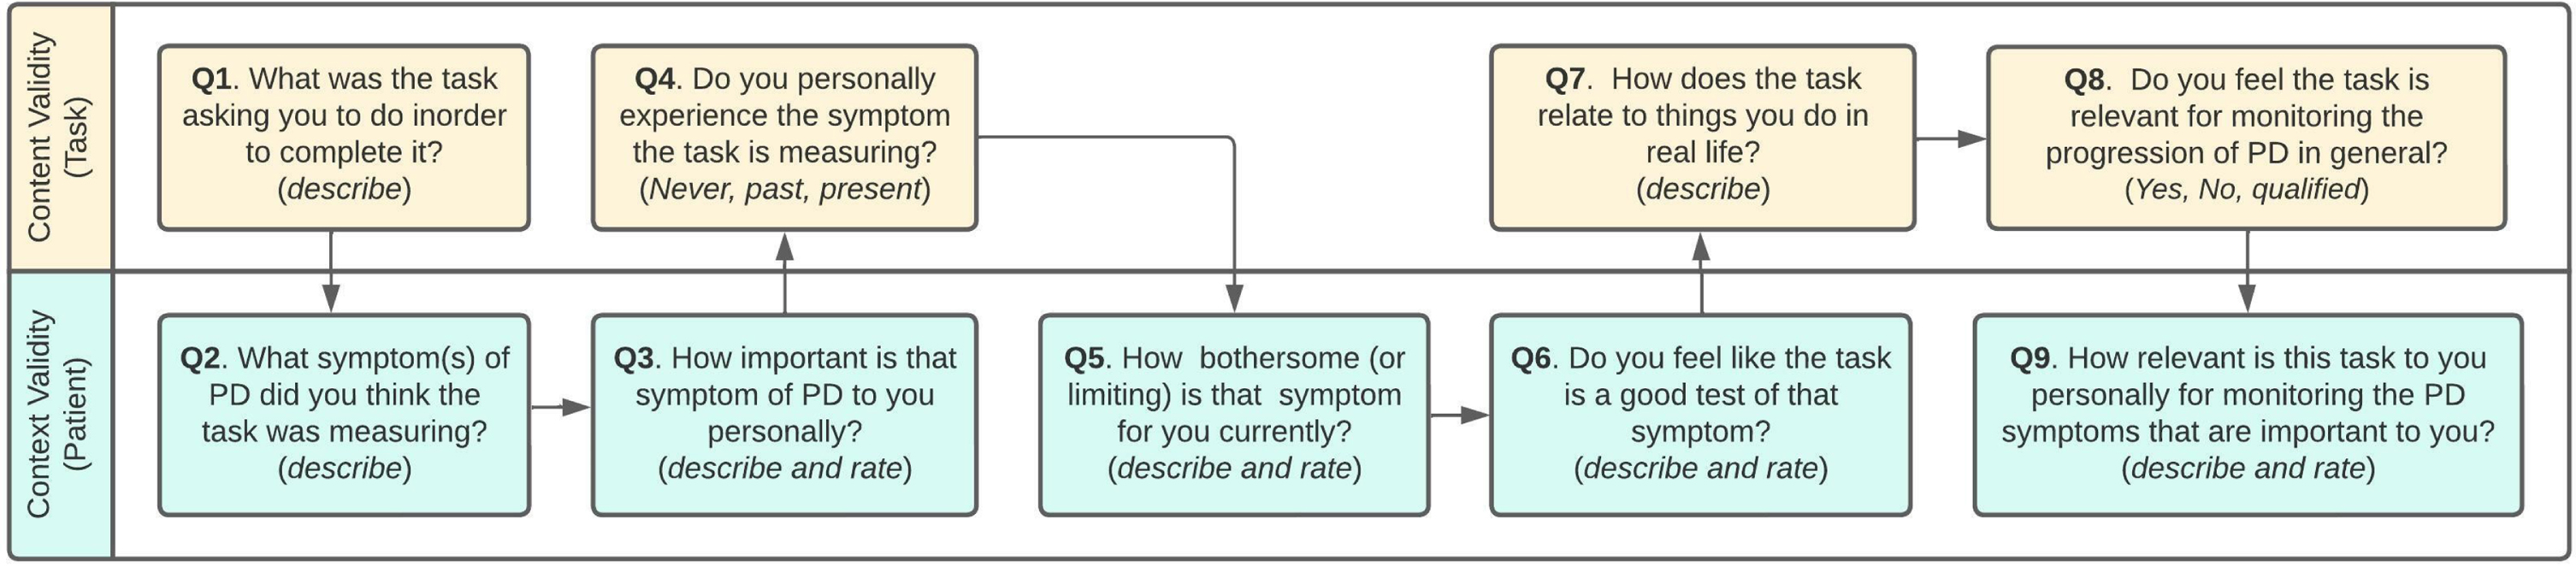
Recommended approach to assessing the relevance of digital measures for monitoring meaningful symptoms of disease. Use of a consistent 0–10 rating scale for each rated item (i.e., 0 = not important at all; 10 = most important, etc.) could improve comparison across technologies and trials.
Other pragmatic considerations exist with regards to balancing the psychological impact of testing. Our data present a conundrum: the desire of people with early PD to proactively monitor for current and future symptoms versus the potential for increased anxiety and hypervigilance induced by artificial monitoring. In this study, when participants performed well, they felt better about themselves and their disease state. Conversely when they struggled to perform, they felt more depressed and anxious. Concerns for negative monitoring effects have been raised in other DHT studies [42] and observed with disease screening [43–46], but have not been previously reported with monitoring for neurodegenerative disorders. Some participants suggested that retaining “easy” activities helped offset negative psychological consequences. Yet PD is progressive, with potential for increasingly negative psychological impact of testing as disease duration increases. Thus, including “easy” measures could present a short-term solution but does not address the issue of psychological harm over time. Furthermore, discouragement associated with performing difficult activities could impact measurement validity as participants might alter the way that they engage in these tests, as was observed with the Visual-Spatial Memory task. Incorporating measures that allow for a sense of success along with measures that capture difficulties could improve engagement, perceptions of DHTs, and measurement accuracy by decreasing use of behaviors that falsely inflate positive outcomes. Alternately, use of passive monitoring could reduce hypervigilance and confounding behaviors [47, 48]. Further research is warranted to understand the implications of digital monitoring in progressive diseases.
A final major contribution of this study is the methodology for mapping symptoms to digital measures. We found the approach beneficial in several ways, including 1) increased data granularity; 2) improved ability to demonstrate meaningful connections between symptoms and measures; 3) greater participant engagement and reciprocity; and 4) enhanced rigor and validity. Actionable qualitative patient experience data is urgently needed to enable systematic identification of meaningful aspects of health [49], guide selection of endpoints relevant to disease progression, and inform development of future monitoring technology [50].
Mapping is unique compared to strategies previously employed to investigate clinical meaningfulness [13, 18]. It represents a shift from convergent mixed-methods (i.e., collection of qualitative and quantitative data in a sequentially informing manner) towards nested or hybrid approaches where qualitative data are collected within a measurable framework amenable to quantification. In this approach, participants not only described experiences, but were able to assist in organizing and interpreting data by ranking meaningfulness. This process of co-creation enhances rigor and validity through deep engagement, constant reflection, and iterative member checking [33], and enables individuals to be more active participants in the data generation process. Simply put, interviewing is primarily about “taking” words whereas mapping is primarily about “making” meaning. The difference lies in the act of intentional co-creation, where a shared understanding is crafted between two individuals in a transparent manner amenable to identifying and correcting misunderstandings, with the benefit of enhanced reciprocity in sharing maps back to participants. In short, mapping offers ample flexibility to paint the highly personalized picture essential to good qualitative research with sufficient structure to enable systematic analysis and quantification of findings.
Limitations of this study included use of a predominantly white, college educated, and technologically literate study sample. Limited access to Wi-Fi or computer could restrict use in lower income, rural, or elderly populations. People with more advanced disease progression, reduced reading and technological literacy, or cognitive or visual impairments might also find the mapping techniques more challenging, and relevance of the technologies evaluated here may be different for these groups. These factors should be considered to ensure equitable access, and further research is warranted in more diverse populations and to replicate approaches longitudinally.
In conclusion, the findings presented here contribute to understanding the relevance, risks, and benefits of digital measures to monitor symptoms of early PD from the participant perspective. We believe the approaches will translate across a range of chronic diseases and research objectives, enabling systematic assessment of meaningful symptoms and relevance of new monitoring technologies.
Footnotes
ACKNOWLEDGMENTS
The researchers thank the many individuals who contributed to this work. The content is based solely on the perspectives of the authors and do not necessarily represent the official views of the Critical Path Institute, the US FDA or other sponsors. BrainBaseline application screenshots reprinted with permission from Clinical ink.
FUNDING
This study was funded by Critical Path for Parkinson’s (CPP). The CPP 3DT initiative is funded by the Critical Path for Parkinson’s Consortium members including: Biogen; GSK; Takeda; Lundbeck; UCB Pharma; Roche; AbbVie and Merck, Parkinson’s UK, and the Michael J Fox Foundation. Critical Path Institute is supported by the Food and Drug Administration (FDA) of the U.S. Department of Health and Human Services (HHS). Critical Path Institute is supported by the Food and Drug Administration (FDA) of the U.S. Department of Health and Human Services (HHS) and is 54.2% funded by the FDA/HHS, totaling $13,239,950, and 45.8% funded by non-government source(s), totaling $11,196,634. The contents are those of the author(s) and do not necessarily represent the official views of, nor an endorsement by, FDA/HHS or the U.S. Government.
CONFLICT OF INTEREST
GTS is an employee of Rush University and has consulting and advisory board membership with honoraria for: Acadia Pharmaceuticals; Adamas Pharmaceuticals, Inc.; Biogen, Inc.; Ceregene, Inc.; CHDI Management, Inc.; the Cleveland Clinic Foundation; Ingenix Pharmaceutical Services (i3 Research); MedGenesis Therapeutix, Inc.; Neurocrine Biosciences, Inc.; Pfizer, Inc.; Tools-4-Patients; Ultragenyx, Inc.; and the Sunshine Care Foundation. He has received grants from and done research for: the National Institutes of Health, the Department of Defense, the Michael J. Fox Foundation for Parkinson’s Research, the Dystonia Coalition, CHDI, the Cleveland Clinic Foundation, the International Parkinson and Movement Disorder Society, and CBD Solutions, and has received honoraria from: the International Parkinson and Movement Disorder Society, the American Academy of Neurology, the Michael J. Fox Foundation for Parkinson’s Research, the FDA, the National Institutes of Health, and the Alzheimer’s Association. JC is Director of Digital Health Strategy at AbbVie and Industry Co-Director of CPP. TD is Executive Medical Director at Biogen. JH Is Senior Scientist, Patient Insights at H. Lundbeck A/S, Valby, Denmark. TS has served as a consultant for Acadia, Blue Rock Therapeutics, Caraway Therapeutics, Critical Path for Parkinson’s Consortium (CPP), Denali, General Electric (GE), Neuroderm, Sanofi, Sinopia, Sunovion, Roche, Takeda, MJFF, Vanqua Bio and Voyager. She served on the ad board for Acadia, Denali, General Electric (GE), Sunovion, Roche. She has served as a member of the scientific advisory board of Caraway Therapeutics, Neuroderm, Sanofi and UCB. She has received research funding from Biogen, Roche, Neuroderm, Sanofi, Sun Pharma, Amneal, Prevail, UCB, NINDS, MJFF, Parkinson’s Foundation. ERD has stock ownership in Grand Rounds, an online second opinion service, has received consultancy fees from 23andMe, Abbott, Abbvie, Amwell, Biogen, Clintrex, CuraSen, DeciBio, Denali Therapeutics, GlaxoSmithKline, Grand Rounds, Huntington Study Group, Informa Pharma Consulting, medical-legal services, Mednick Associates, Medopad, Olson Research Group, Origent Data Sciences, Inc., Pear Therapeutics, Prilenia, Roche, Sanofi, Shire, Spark Therapeutics, Sunovion Pharmaceuticals, Voyager Therapeutics, ZS Consulting, honoraria from Alzeimer’s Drug Discovery Foundation, American Academy of Neurology, American Neurological Association, California Pacific Medical Center, Excellus BlueCross BlueShield, Food and Drug Administration, MCM Education, The Michael J Fox Foundation, Stanford University, UC Irvine, University of Michigan, and research funding from Abbvie, Acadia Pharmaceuticals, AMC Health, BioSensics, Burroughs Wellcome Fund, Greater Rochester Health Foundation, Huntington Study Group, Michael J. Fox Foundation, National Institutes of Health, Nuredis, Inc., Patient-Centered Outcomes Research Institute, Pfizer, Photopharmics, Roche, Safra Foundation. JLA has received honoraria from Huntington Study Group, research support from National Institutes of Health, The Michael J Fox Foundation, Biogen, Safra Foundation, Empire Clinical Research Investigator Program, and consultancy fees from VisualDx.
TS is an Editorial Board Member of this journal but was not involved in the peer review
process nor had access to any information regarding its peer-review.
The following authors (JRM, RMS, MLTMM, PY, MC, JEC, SJR, MK, KWB, DS) have no conflict of interest to disclose.
DATA AVAILABILITY
Data are available to members of the Critical Path for Parkinson’s Consortium 3DT Initiative Stage 2. For those who are not a part of 3DT Stage 2, a proposal may be made to the WATCH-PD Steering Committee (via the corresponding author) for de-identified datasets.