
Abstract
Background:
The utility of imaging methods to detect iron content in the substantia nigra pars compacta (SNc) and free water imaging in the posterior substantia nigra (pSN) has the potential to be imaging markers for the detection of Parkinson’s disease (PD).
Objective:
This study aimed to compare the discriminative power of above methods, and whether the combination can improve the diagnostic potential of PD.
Methods:
Quantitative susceptibility mapping (QSM) and diffusion-weighted data were obtained from 41 healthy controls (HC), 37 patients with idiopathic REM sleep behavior disorder (RBD), and 65 patients with PD. Mean QSM values of bilateral SNc and mean isotropic volume fraction (Viso) values of bilateral pSN (mean QSM|Viso values of bilateral SNc|pSN) were separately calculated and compared among the groups.
Results:
Mean QSM|Viso values of bilateral SNc|pSN were significantly higher for RBD and PD patients compared to HC and were significantly higher in PD patients than in RBD patients. The power of the mean QSM|Viso values of bilateral SNc|pSN and combined mean QSM and Viso values was 0.873, 0.870, and 0.961 in discriminating PD and HC, 0.779, 0.719, and 0.864 in discriminating RBD from HC, 0.634, 0.636, and 0.689 in discriminating PD and RBD patients.
Conclusion:
QSM and free water imaging have similar discriminative power in the detection of prodromal and clinical PD, while combination of these two methods increases discriminative power. Our findings suggest that the combination of QSM and free water imaging has the potential to become an imaging marker for the diagnosis of PD.
Keywords
INTRODUCTION
Parkinson’s disease (PD) is a progressive neurodegenerative disorder characterized by bradykinesia, static tremor, rigidity and postural instability, and is associated with loss of the dopaminergic neurons in the substantia nigra pars compacta (SNc), especially marked in the ventrolateral tier located in the posterior substantia nigra (pSN) [1]. At present, the diagnosis of PD mainly relies on clinical examination, and the diagnostic criteria are based on core motor symptoms. However, due to the lack of valid objective diagnostic methods, clinicians incorrectly diagnose the disease in approximately 25% of patients [2]. Therefore, the main challenge of imaging studies in PD is to develop imaging makers that have high a diagnostic potential for PD.
Advance in magnetic resonance imaging (MRI) provides techniques that can noninvasively detect disease-related changes in the substantia nigra (SN). There are some potential MRI makers of SN neurodegeneration, such as iron- and diffusion imaging [3]. Both R2* and quantitative susceptibility mapping (QSM) techniques provide sensitive measures of magnetic field perturbations. Using R2* or QSM methods, it has been shown that in the early clinical stage of PD, iron deposition in the SNc was exclusively affected, while the SN pars reticulata (SNr) has been involved in the advanced stage [4, 5], which was consistent with the post-mortem studies that iron increased in the SN, especially in the SNc of PD [6, 7]. QSM can further distinguish whether the perturbation is due to diamagnetic or paramagnetic compounds [8], and is more sensitive to quantitively assessing nigral iron content changes in PD patients than R2* mapping [9–11]. The QSM values in the SNc correlate with disease duration and severity of PD [5, 13]. Moreover, the QSM values are increased in the SN in idiopathic REM sleep behavior disorder (RBD) patients [13], indicating that QSM can detect iron deposition in the prodromal stage in PD, as RBD is considered a prodromal stage of α-synucleinopathies [14]. In the prodromal and clinical stages of PD, QSM values in the SNc had a high discriminative power (about 0.7 and 0.9, respectively) [11, 15–17]. Therefore, QSM may become an imaging marker for the diagnosis of PD.
Diffusion-weighted imaging (DWI) is sensitive to the regional diffusion of water molecules alteration [3]. Water molecules that do not experience flow and are not restricted by their surroundings are referred to as “free water” [18]. The volume fraction of free water increases with neuroinflammation and axon/myelin injury [19, 20]. Previous studies have reported that the volume fraction of free water in the pSN was enhanced and correlated with the clinical characteristics of PD [21–24]. The increased volume fraction of free water in the pSN was also detected in RBD patients. The changes in volume fraction of free water were more significant in the pSN than that in the anterior SN in both prodromal and early clinical stages of PD [24–26]. The power of volume fraction of free water in discriminating PD and RBD patients from healthy control (HC) was about 0.9 and 0.7, respectively [26, 27]. Thus, free water imaging in the pSN is a potential marker in the diagnosis of PD [28]. The volume fraction of free water can be estimated by the bi-tensor free-water model [18] or multi bi-tensor neurite orientation dispersion and density imaging (NODDI) model [29]. A recent study suggested that these two methods have similar discriminative power in distinguishing PD patients from HC [30]. In the current study, we used the NODDI model to measure the volume fraction of free water values in the pSN.
While increasing evidence suggests that QSM and free water imaging have the potential to be imaging makers for the diagnosis of PD, it is unclear which method has higher diagnostic performance in PD, and whether the combination of these two methods can improve the diagnostic potential. As most RBD patients have Lewy pathology, and eventually develop into synucleinopathies, RBD provides an ideal cohort to study early diagnostic markers for PD. Therefore, our study aimed to compare the discriminative power of QSM and free water imaging of the SN in prodromal and clinical PD patients. The comparison between RBD and HC was to evaluate the power of QSM and free water imaging to detect person at prodromal stage of synucleinopathies, while the comparison between RBD and PD patients was to evaluate the power of these imaging methods to discriminate patients at prodromal and clinical stages of synucleinopathies. The findings of the current study will help establish imaging markers for PD diagnosis.
MATERIALS AND METHODS
Subjects
This experiment was performed in accordance with the Declaration of Helsinki and was approved by the Institution Review Board of Xuanwu Hospital (2011–27). All subjects signed written inform ed consent before the experiment. The Movement Disorders Clinic of the Xuanwu Hospital of Capital Medical University approved this study. MRI approval was obtained from the Department of Radiology of Guang’anmen Hospital of China Academy of Chinese Medical Sciences.
Forty-one HC, 37 patients with RBD and 65 patients with PD were recruited. The inclusion criteria for HC were 1) older than 54 years; 2) no neurological or psychiatric diseases; 3) no family history of movement disorders; and 4) no obvious cerebral lesions on MRI structural images. The RBD patients were screened by the international classification of sleep disorder-third edition diagnostic criteria [31], and confirmed by polysomnography. PD patients were diagnosed by the MDS Clinical Diagnostic Criteria [32] and evaluated with the H&Y stage and MDS-UPDRS III while off their anti-parkinsonian medicine for 12 h. In addition, all subjects were assessed by Rapid Eye Movement Sleep Behavior Disorder Questionnaire–Hong Kong (RBDQ-HK), Montreal Cognitive Assessment (MoCA), Brief Smell Identification Test (BSIT), Non-Motor Symptoms Scale for Parkinson’s Disease (NMSS), Epworth Sleepiness Scale (ESS), Pittsburgh Sleep Quality Index (PSQI), Hamilton Depression Scale (HAMD), and Apathy Scale (AS). Demographic information is summarized in Table 1.
Demographic and clinical data of participants
Data are expressed as the mean±SD. HC, healthy control; RBD, rapid eye movement sleep behavior disorder; PD, Parkinson’s disease; M, male; F, female; UPDRS III, Unified Parkinson’s Disease Rating Scale, Part III; RBDQ-HK, Rapid Eye Movement Sleep Behavior Disorder Questionnaire–Hong Kong; MoCA, Montreal Cognitive Assessment; BSIT, Brief Smell Identification Test; NMSS, Non-Motor Symptoms Scale for Parkinson’s Disease; ESS, Epworth Sleepiness Scale; PSQI, Pittsburgh Sleep Quality Index; HAMD, Hamilton Depression Scale; AS, Apathy Scale. aANOVA, analysis of variance; bChi-square test. The p-value of 1 is due to application Bonferroni correction and truncated the values.
MRI data collection
MRI data were collected on a 3T MAGNETOM Skyra scanner (Siemens, Erlangen, Germany) using a 20-channel head coil. A whole-brain sagittal 3-D T1 magnetization-prepared rapid gradient-echo (MP-RAGE) imaging was performed with the following parameter: TR = 2530 ms, TE = 2.98 ms, TI = 1100 ms, voxel size = 1×1×1 mm3, slice thickness = 1 mm, flip angle = 7°, FoV = 256×224 mm2, scanning time = 5 min 13 s.
A single-echo 3-dimensional (3-D) gradient echo (GRE) sequence was collected with the following parameters: TR = 25 ms, TE = 17.5 ms, voxel size = 0.667×0.667×1.5 mm3, slice thickness = 1.5 mm, flip angle = 15°, FoV = 256×192 mm2, scanning time = 5 min 6 s.
A two-shell diffusion acquisition was acquired with the following parameters: 30 non-colinear directions at b-value=1000, 2000 s/mm2, one non-diffusion volume, TR = 5000 ms, TE = 105 ms, voxel size = 2.182×2.182×2 mm3, FoV = 220×220 mm2, iPAT factor = 2, scanning time = 5 min 55 s.
Image analysis
Image processing
The QSM reconstruction was performed using MATLAB R2017b based susceptibility imaging software (STI Suite; https://people.eecs.berkeley.edu/∼chunlei.liu/software.html). The phase images were unwrapped by a Laplacian-based algorithm method [33, 34]. The V-SHARP method was used to remove the background field of the unwrapped phase images [35], with a spherical mean radius increasing from 0.6 mm at the boundary of the brain to 25 mm toward the center of the brain [34, 36]. The magnetic susceptibility was determined using streaking artifact reduction for QSM (STAR-QSM) [37].
The diffusion data preprocessing was performed using RTP-preproc (https://github.com/vistalab/RTP-preproc/blob/master/run), including denoising, Gibbs ringing elimination, eddy-current and motion correction, and Rician background noise removal. Next, the preprocessed diffusion data were fitted into the NODDI model (Microstructure Imaging Group | NODDI Matlab toolbox (ucl.ac.uk)), and the maps of isotropic volume fraction (Viso) were generated to measure the volume fraction of free water values [29].
Image registration was performed using FMRIB Software Library (FSL) v6.0 (https://fsl.fmrib.ox.ac.uk/fsl/fslwiki). Individual 3D-T1 w images were first skull stripped and registered to the standard space (Montreal Neurological Institute (MNI) 152) using FSL’s FLIRT and FNIRT tools. The inverted warping field from standard to native space was then obtained by inverting the warping field. Then, the individual 3D-T1 w image was also registered to GRE’s magnitude image and non-diffusion-weighted image, using the FLIRT tool to get second warping fields. Both warping fields were combined to the above inverted warping field from standard to T1 w space, respectively, to obtain warping fields converting from MNI152 space to individual susceptibility map and DW images.
We chose the SNc and pSN as regions of interest (ROIs) for QSM and free water analysis, respectively, as previous studies have suggested that QSM values in the SNc and volume fraction of free water in the pSN have high discriminative power in the diagnosis of PD [11, 26]. In the present study, the SNc was defined by a California Institute of Technology (CIT) 168 atlas of subcortical nuclei [38]; while the pSN was defined using the template provided by Dr. Vaillancourt, which has been used in previous studies [23, 39]. The SNc and pSN in standard MNI 152 space were normalized to individual magnitude space and DW images, respectively, using the above-mentioned warping fields with FSL. Finally, the individual ROIs were obtained in order to calculate QSM and Viso values (Fig. 1).
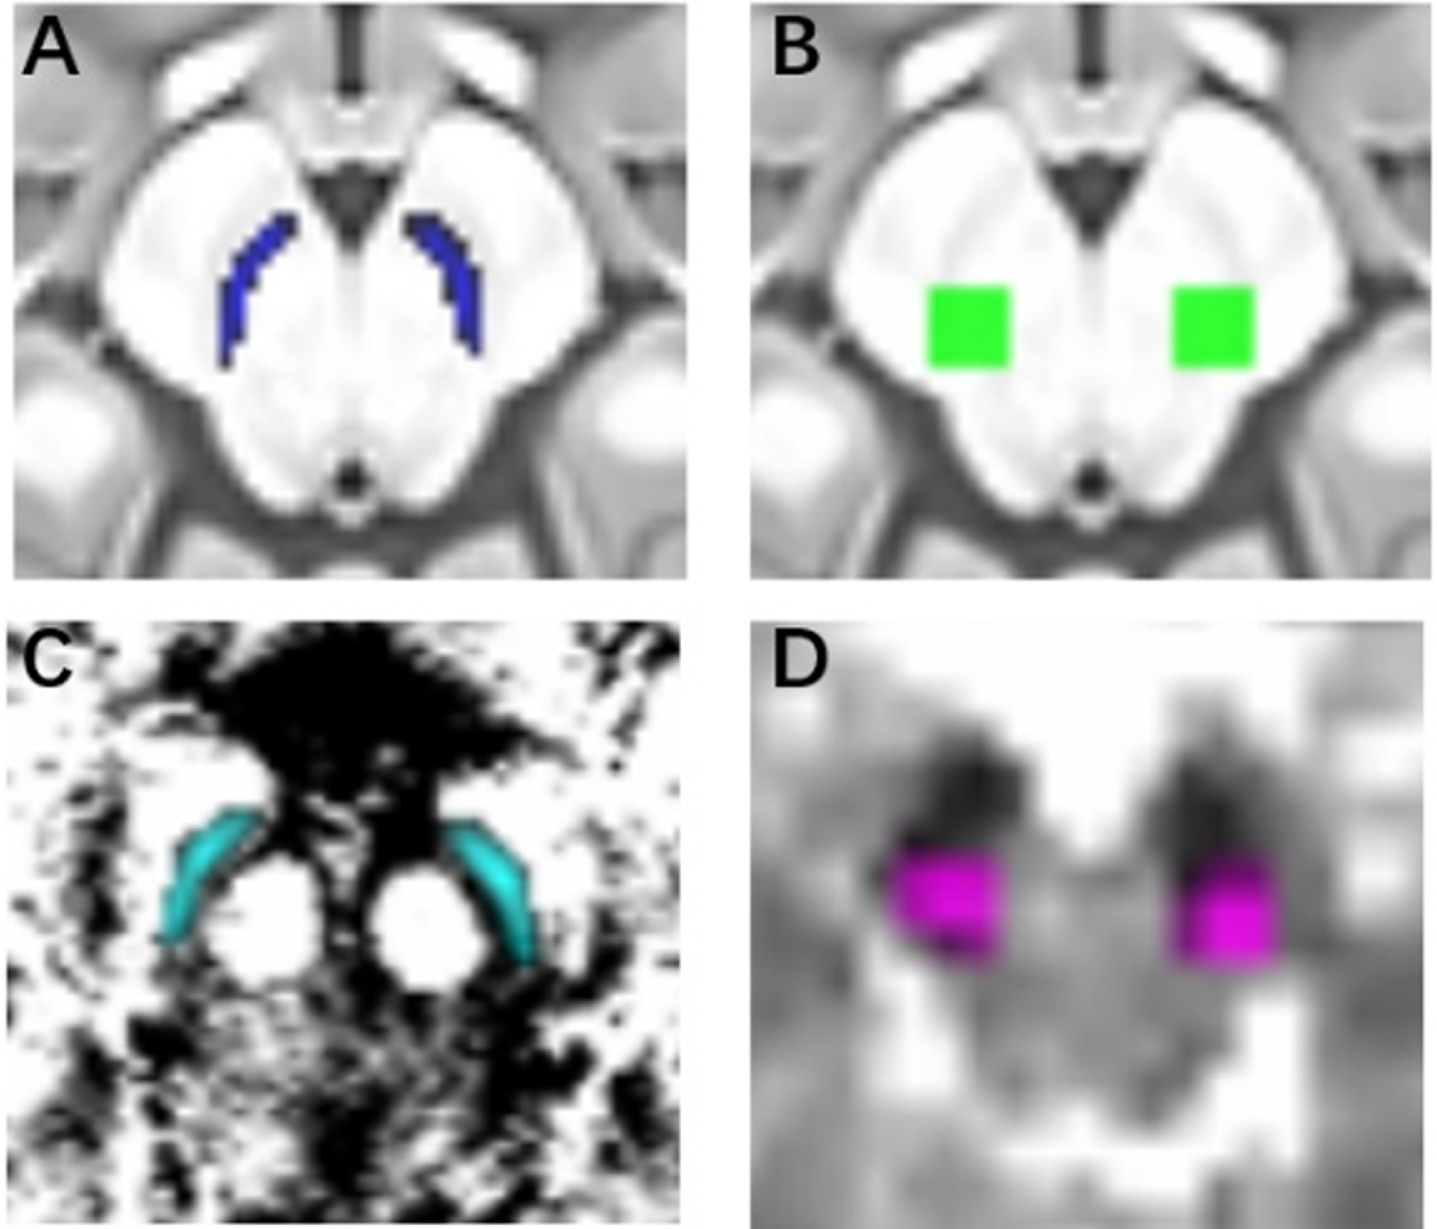
The definition of ROIs. A) the SNc in a standard space; B) the pSN in a standard space; C) the SNc in an individual space; D) the pSN in an individual space.
Statistical analyses
We analyzed the demographic and clinical characteristics of the participants using analysis of variance (ANOVA). Chi-square test was used for sex frequency. Bonferroni’s post-hoc tests were applied for intergroup comparisons to control the false-positive rates.
The Kolmogorov-Smirnov test was used to confirm the normal distribution of QSM and Viso values. We used the mean QSM values in bilateral SNc and Viso values in bilateral pSN (mean QSM|Viso values of bilateral SNc|pSN) to separately analyze the differences among the three groups using analysis of covariance (ANCOVA), with age and sex as covariates. Bonferroni’s post-hoc tests were used for intergroup comparisons (p < 0.05). Using the mean values of bilateral SN, the discriminative power of QSM, Viso and combined QSM and Viso (logistic regression was used to combine QSM and Viso . ) were evaluated by receiver operating characteristic curve (ROC) analysis, with age and sex as covariates. The cutoff for estimation of sensitivity and specificity fixed was based on the Youden criterion.
As PD patients often present with asymmetric motor symptoms [40], we further compared the QSM|Viso values in the more- and less-affected side of SNc|pSN in PD patients with the mean values of bilateral SN from HC and RBD groups, as there was no obvious motor symptom in RBD patients. In addition, we compared the QSM|Viso values between more- and less-affected groups using Independent Sample Test. The more-affected SNc|pSN side was defined as the side of the brain opposite to the clinically more-affected side. We divided the total score of left bradykinesia, tremor, and rigidity of MDS-UPDRS III (items 20–26) over the total score of the right side. When the quotient was > 1, the left side was considered the clinically more-affected side, and when the quotient was < 1, the right side was considered the clinically more-affected side [40].
Correlations between QSM or Viso values and RBDQ-HK, MoCA, BSIT, NMSS, ESS, PSQI, HAMD, and AS scores were analyzed using Pearson’s correlation analysis, while correlations between QSM or Viso values and H&Y stage were analyzed with Spearman’s correlation analysis in RBD and PD patients. Statistical analyses were performed using IBM SPSS Statistics (version 20, IBM Corp, Armonk, NY, USA) and Stata (version 17, StataCrop LLC, Collage Station, TX, USA).
RESULTS
No significant differences were observed among the three groups in age, sex, ESS and PSQI (ANOVA, p > 0.05), while there were significant among-group differences in RBDQ-HK, MoCA, BSIT, NMSS, HAMD and AS scores (ANOVA, p < 0.05) (Table 1).
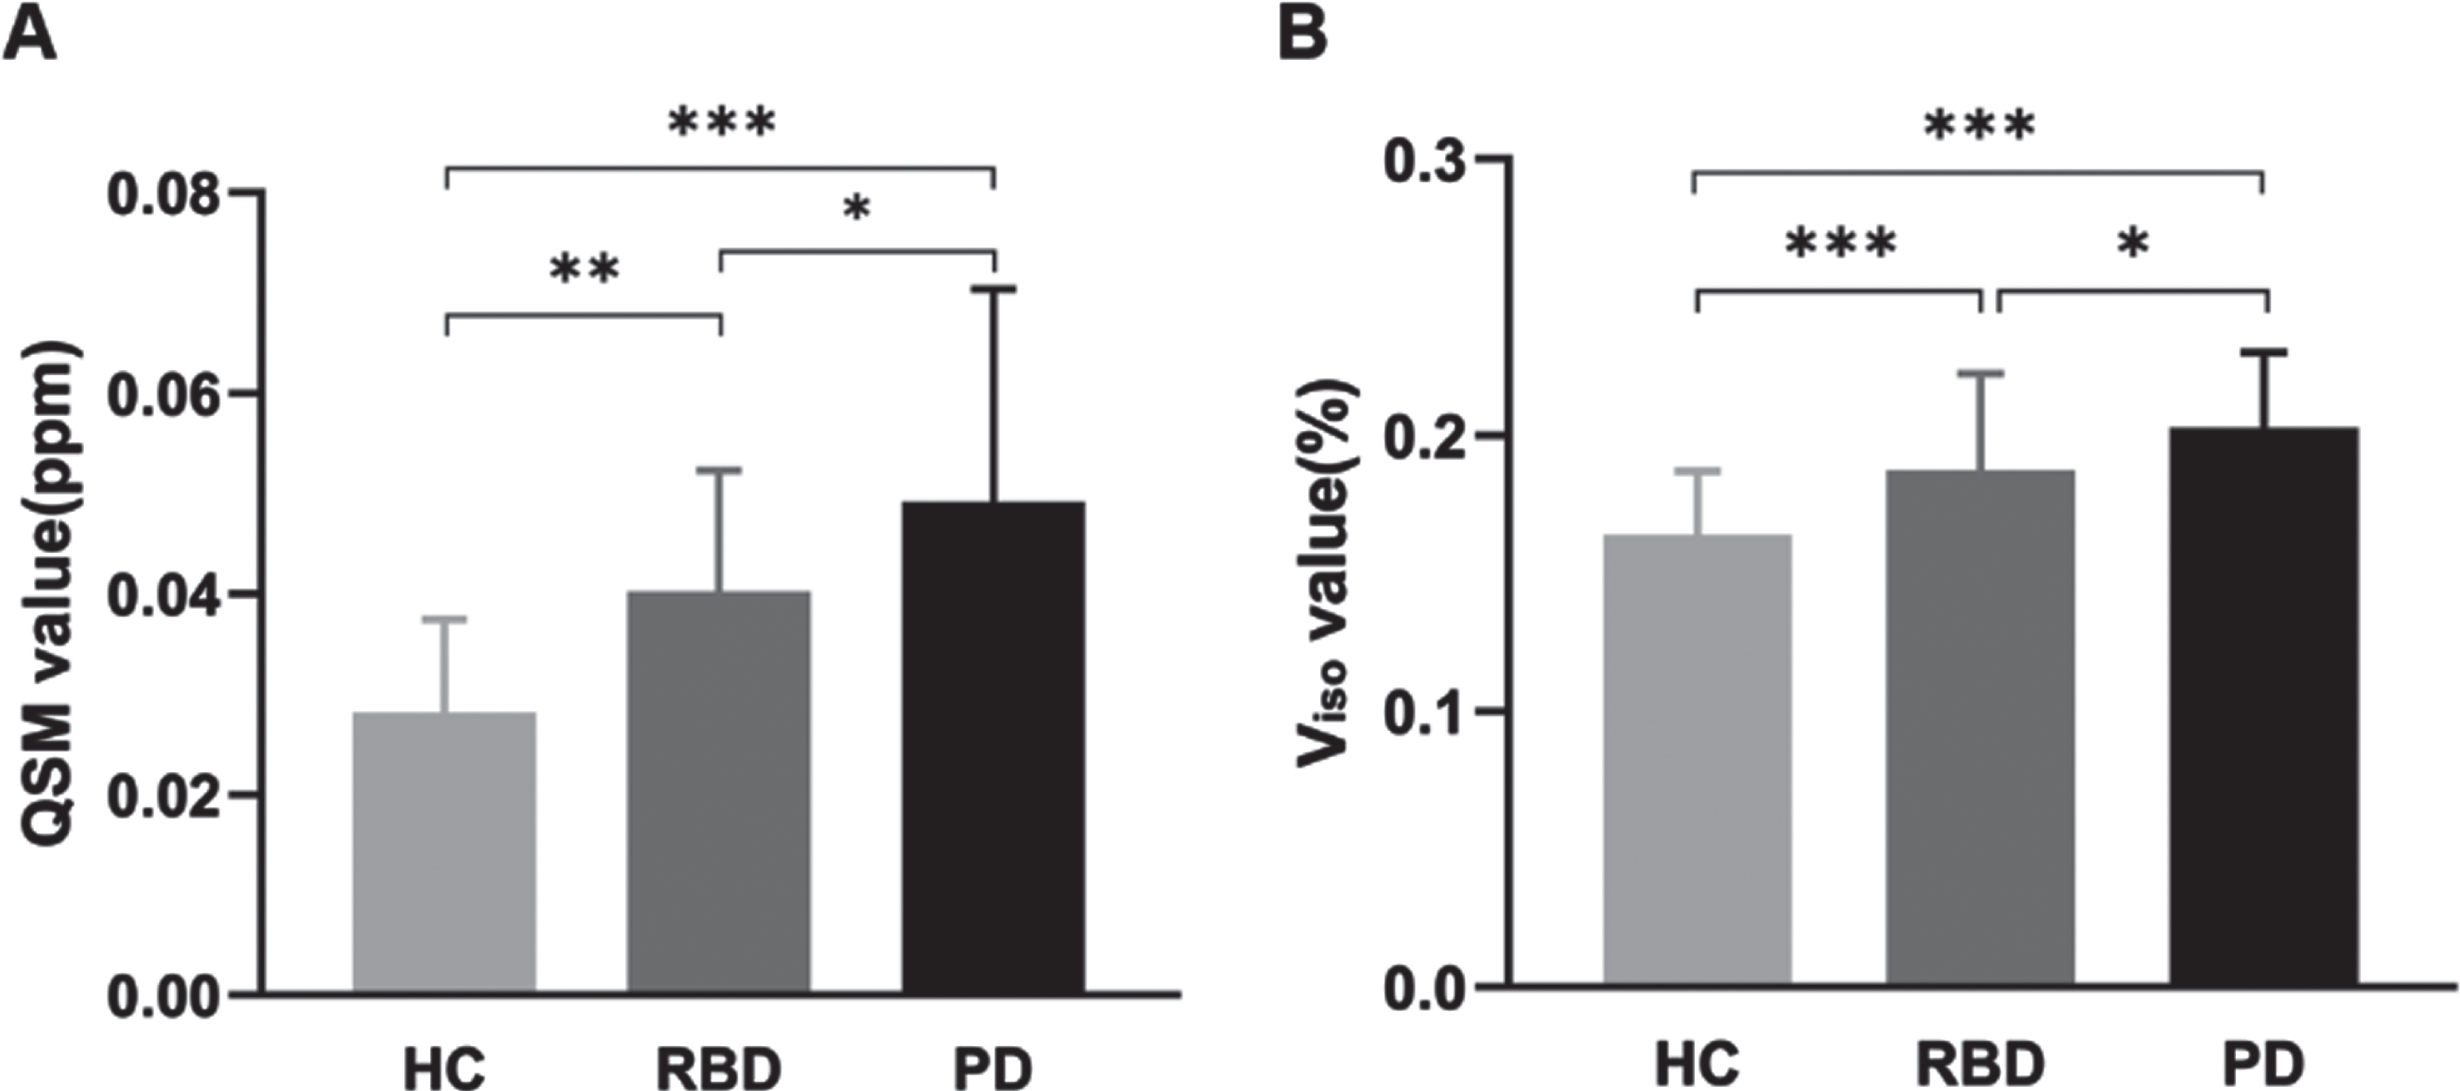
There were significant differences in mean QSM|Viso values of bilateral SNc|pSN amongst the HC, RBD, and PD groups (ANCOVA, p < 0.001). RBD and PD groups showed significantly higher mean QSM|Viso values compared with HC group (Bonferroni’s post-hoc test, p < 0.01). PD groups had significantly elevated mean QSM|Viso values compared with RBD group (Bonferroni’s post-hoc test, p < 0.05) (Table 2, Fig. 2).
QSM|Viso values in the SNc|pSN in three groups
HC, healthy control; RBD, rapid eye movement sleep behavior disorder; PD, Parkinson’s disease; QSM, quantitative susceptibility mapping value in substantia nigra pars compacta; Viso, isotropic volume fraction in posterior substantia nigra; mean, mean values; more, values in the more-affected side in PD; less, values in the less-affected side in PD; ANCOVA, analysis of covariance. The p-value of 1 is due to application Bonferroni correction and truncated the values.
The mean QSM|V
In PD patients, the QSM|Viso values in the more-affected side were significantly higher compared with HC and RBD groups. The QSM|Viso values in the less-affected side in PD were significantly elevated compared with HC, but had no difference compared to RBD patients (Table 2). Moreover, the QSM|Viso values on more-affected side were both higher than that on the less-affected side (Paired-samples Test, p < 0.05).
Using the mean values of bilateral SN, the discriminative power of QSM, Viso and combined QSM and Viso were 0.873 (95% CI, 0.877–0.975; sensitivity, 0.923; specificity, 0.756), 0.870 (95% CI, 0.794–0.934; sensitivity, 0.877; specificity, 0.732), and 0.961 (95% CI, 0.929–0.985; sensitivity, 0.923; specificity, 0.904), respectively, for distinguishing PD patients from HC; 0.779 (95% CI, 0.647–0.886; sensitivity, 0.838; specificity, 0.634), 0.719 (95% CI, 0.594–0.846; sensitivity, 0.595; specificity, 0.878), and 0.864 (95% CI, 0.762–0.933; sensitivity, 0.703; specificity, 0.902), respectively, for distinguishing RBD from HC; and 0.634 (95% CI, 0.509–0.755; sensitivity, 0.708; specificity, 0.568), 0.636 (95% CI, 0.514–0.753; sensitivity, 0.615; specificity, 0.622), and 0.689 (95% CI, 0.577–0.789; sensitivity, 0.446; specificity, 0.838), respectively, for distinguishing PD from RBD patients (Fig. 3).
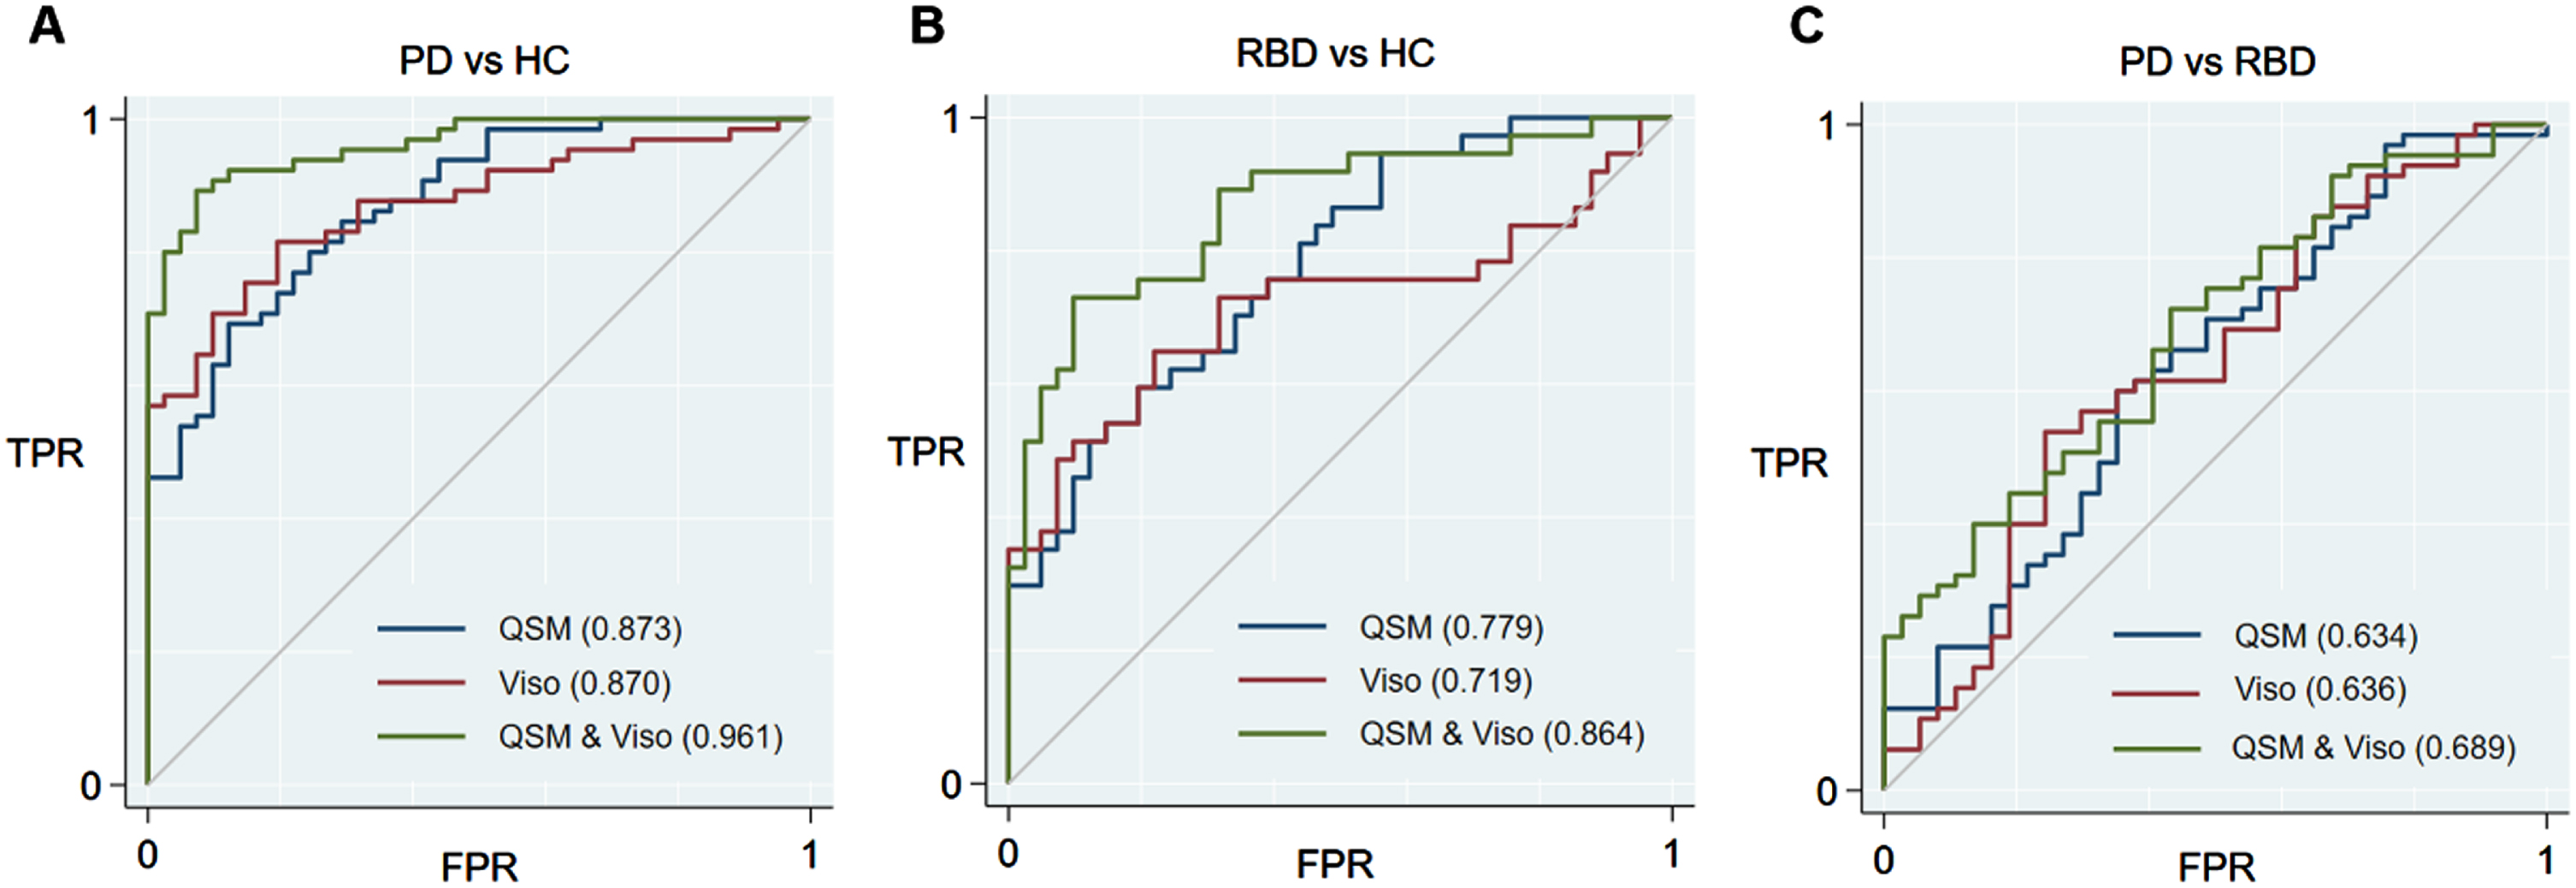
The ROC curves showing comparisons of mean QSM|V
While using the values of more-affected side in PD patients, the discriminative power of QSM, Viso and combined QSM and Viso were 0.887 (95% CI, 0.799–0.946; sensitivity, 0.923; specificity, 0.732), 0.866 (95% CI, 0.785–0.932; sensitivity, 0.846; specificity, 0.756) and 0.965 (95% CI, 0.923–0.989; sensitivity, 0.923; specificity, 0.903), respectively, for PD versus HC; and 0.664 (95% CI, 0.555–0.786; sensitivity, 0.908; specificity, 0.432), 0.649 (95% CI, 0.506–0.747; sensitivity, 0.569; specificity, 0.703) and 0.746 (95% CI, 0.639–0.841; sensitivity, 0.508; specificity, 0.892), respectively, for PD versus RBD patients (Supplementary Figure 1). In addition, with the values in the less-affected side in PD patients, the discriminative power for QSM, Viso and combined QSM and Viso were 0.765 (95% CI, 0.651–0.848; sensitivity, 0.907; specificity, 0.512), 0.732 (95% CI, 0.633–0.823; sensitivity, 0.631; specificity, 0.878), and 0.881 (95% CI, 0.812–0.941; sensitivity, 0.831; specificity, 0.781), respectively, for PD versus HC, and 0.503 (95% CI, 0.393–0.622; sensitivity, 0.385; specificity, 0.757), 0.560 (95% CI, 0.440–0.672; sensitivity, 0.415; specificity, 0.757), and 0.589 (95% CI, 0.478–0.701; sensitivity, 0.354; specificity, 0.838) for PD versus RBD.
The mean QSM values of bilateral SNc were positively correlated with disease duration (p = 0.016, r = 0.428) and RBDQ-HK (p = 0.041, r = 0.396) in RBD patients. In PD patients, the mean QSM values of bilateral SNc were positively correlated with H&Y stage (p = 0.033, r = 0.265) and MDS-UPDRS III scores (p = 0.014, r = 0.315), the QSM values in the more-affected side of SNc were positively correlated with H&Y stage (p = 0.005, r = 0.346) and MDS-UPDRS III scores (p = 0.004, r = 0.362) as well, and the Viso values in the more-affected side of pSN were negatively correlated with BSIT scores (p = 0.014, r=–0.339).
DISCUSSION
To our knowledge, this is the first study to compare the discriminative power of iron and free water images of SN in the prodromal and clinical stages in the diagnosis of PD. We applied QSM to investigate the iron deposition in the SNc and Viso map to detect the volume fraction of free water changes in the pSN. We found that the QSM values in the SNc and Viso values in the pSN have similar power in distinguishing PD and RBD patients from HC, while the combination of these two methods provides higher discriminative power compared with QSM or Viso alone.
We found that RBD and PD patients had significantly higher iron accumulation in the SNc than HC, and RBD patients had lower iron deposition than PD patients, which is consistent with previous studies [12, 13]. These findings support that iron deposition has elevated in the SNc in the prodromal stage, and there may be a progressive increase of iron accumulation in the SNc from the prodromal to the clinical stage of PD [4, 13]. Iron accumulation is a cardinal feature of aging and various neurodegenerative disease [41]. Aging processing might compromise the iron homoeostatic system, leading to an excess of iron that is not efficiently chelated by storage proteins or other molecules [42]. The elevated iron content and abnormal iron homoeostasis might cause severer damage occurring in SN than in other brainstem nuclei [43, 44]. The accumulation and interaction of iron, dopamine (DA), and neuromelanin can produce neurotoxic intermediate or end-products, such as DA quinone and 6-hydroxydopamine, which participates in the Fenton reaction with ferrous iron to induce oxidative stress via the formation of hydroxyl radicals, leading to oxidation of protein and forming toxic α-synuclein fibers [45, 46]. The aggregation of α-synuclein forms Lewy body and Lewy neurites which damage DA neurons in the SN [47]. Moreover, there was a 31–35% increase in iron content in post-mortem parkinsonian SN compared to control tissue [48]. In a longitudinal cohort of individuals with early-, moderate- and late-stage PD, distinct patterns of iron deposition were observed in the SNc and SNr [49]. A multimodal imaging study found that dopaminergic function in the posterior putamen decreased as iron values increased in the SN, which indicated that impairment of dopaminergic function progressed with the gradual increase of iron deposition [50].
We also found that RBD and PD patients had significantly higher Viso values in the pSN than HC, and RBD patients had lower Viso values than PD patients, which is consistent with previous free water imaging studies [23, 30]. Our findings support that the volume fraction of free water is increased in the pSN in the prodromal stage, and there is likely a progressive increase in the volume fraction of free water in the pSN from the prodromal to the clinical stage of PD [21–23, 27]. The local accumulation of free water is caused by the changes in the relative volume of the neuronal intra- and extra-cellular space due to aging, maturation, degeneration, and cell formation changes [18]. The volume fraction of free water has been shown to detect structural deficits and reflect pathological changes including neuroinflammation, gliosis, axonal damage, and cell loss [21–23, 39]. In RBD and PD patients, the volume fraction of free water in the pSN was negatively associated with the striatal binding ratio [21, 26].
The mean QSM|Viso values in the bilateral SNc|pSN separately showed high power to discriminate PD patients from HC (QSM, 0.883; Viso, 0.869) and moderate power to discriminate RBD patients from HC (QSM, 0.796; Viso, 0.730), and to discriminate PD patients from RBD patients (QSM, 0.652; Viso, 0.621), which is consistent with previous reports [11, 30]. Combined QSM and Viso had higher power to discriminate PD patients from HC (0.961), to discriminate RBD patients from HC (0.864), and to discriminate PD patients from RBD patients (0.682) compared with QSM or Viso alone. As QSM and free water imaging reveal different aspects of pathological changes in PD, the combination of these two methods might more sensitive to detect nigral damage than these methods alone, and thus has a higher potential in the diagnosis of PD.
In RBD patients, the mean QSM values of bilateral SNc were positively correlated with disease duration and MDS-UPDRS III scores, which was consistent with our earlier study [13]. In PD patients, the QSM values were positively correlated with H&Y stage and MDS-UPDRS III scores. These findings suggest that QSM has the potential to be a marker to monitor disease severity and progression in the prodromal and clinical stages of PD. In addition, the Viso values on the more-affected side of pSN were negatively correlated with BSIT scores. Olfactory dysfunction is an early and common symptom of PD due to the early pathologic involvement of olfactory pathways [51, 52]. Our study indicates that free water imaging of pSN may help monitor the progression of olfactory dysfunction.
The QSM|Viso values in the more-affected SNc|pSN were significantly higher than that in the less-affected side, which is consistent with previous studies [53]. Moreover, the discriminative power of the QSM|Viso values in the more-affected SNc|pSN was also higher than that in the less-affected side. These results approve that iron deposition and volume fraction of free water in the more-affected SN are more significant and are more likely to become makers for the diagnosis of PD.
There are some limitations in our study. First, dopamine transporter (DAT) imaging in PD patients and HCs is needed in future studies to confirm nigrostriatal degeneration and compare the diagnostic performance of these MRI-based markers with DAT imaging. Second, the PD patients included in the current study had a clear clinical diagnosis and the results might overestimate the performance of the tested markers in clinical routine. Future longitudinal studies on patients with clinically uncertain parkinsonian syndrome are warranted to test the value of these MRI-based markers for early diagnosis of PD. Third, the current study used a single dataset, and the analyses may have been overfitting. More multi-center studies would assist in clarification. Forth, diffusion data are susceptible to distortion, particularly in the midbrain area, eddy current correction may not fully solve this problem.
In conclusion, QSM and free water imaging have similar discriminative power in the detection of prodromal and clinical PD, while the combination of these two methods has an even higher diagnostic performance. Our findings suggest that the combination of QSM and free water imaging has the potential to become an imaging marker in the diagnosis of PD and should be considered in future clinical studies.
CONFLICT OF INTEREST
The authors have no conflict of interest to report.
Footnotes
ACKNOWLEDGMENTS
We gratefully thank David E. Vaillancourt (University of Florida, Gainesville) for providing the pSN template. This research was supported by the National Key R&D Program of China (2020AAA0109502) and the National Natural Science Foundation of China (no. 81871428, 82071423 and 82102139), China Postdoctoral Science Foundation (2020TQ0296 and 2021M692961).