
Abstract
Background:
Cholinergic degeneration is strongly associated with cognitive decline in patients with Parkinson’s disease (PD) but may also cause motor symptoms and olfactory dysfunction. Regional differences are striking and may reflect different PD related symptoms and disease progression patterns.
Objective:
To map and quantify the regional cerebral cholinergic alterations in non-demented PD patients.
Methods:
We included 15 non-demented PD patients in early-moderate disease stage and 15 age- and sex-matched healthy controls for [18F]FEOBV positron emission tomography imaging. We quantitated regional variations using VOI-based analyses which were supported by a vertex-wise cluster analysis. Correlations between imaging data and clinical and neuropsychological data were explored.
Results:
We found significantly decreased [18F]FEOBV uptake in global neocortex (38%, p = 0.0002). The most severe reductions were seen in occipital and posterior temporo-parietal regions (p < 0.0001). The vertex-wise cluster analysis corroborated these findings. All subcortical structures showed modest non-significant reductions. Motor symptoms (postural instability and gait difficulty) and cognition (executive function and composite z-score) correlated with regional [18F]FEOBV uptake (thalamus and cingulate cortex/insula/hippocampus, respectively), but the correlations were not statistically significant after multiple comparison correction. A strong correlation was found between interhemispheric [18F]FEOBV asymmetry, and motor symptom asymmetry of the extremities (r = 0.84, p = 0.0001).
Conclusion:
Cortical cholinergic degeneration is prominent in non-demented PD patients, but more subtle in subcortical structures. Regional differences suggest uneven involvement of cholinergic nuclei in the brain and may represent a window to follow disease progression. The correlation between asymmetric motor symptoms and neocortical [18F]FEOBV asymmetry indicates that unilateral cholinergic degeneration parallels ipsilateral dopaminergic degeneration.
Keywords
INTRODUCTION
Cholinergic degeneration in patients with Parkinson’s disease (PD) is tightly linked to cognitive decline, but other symptoms may also arise from cholinergic dysfunction including cardinal motor symptoms, postural instability, gait difficulty, olfactory dysfunction, hallucinations, and sleep disturbances [1, 2]. The degeneration exhibits regional variability. Cortical areas display relatively marked cholinergic deficits in PD, whereas the hippocampus and subcortical structures are comparatively preserved— at least in non-demented patients [3, 4]. Nevertheless, subcortical cholinergic activity often correlates with many of the abovementioned symptoms in imaging studies, e.g., thalamic cholinergic function correlates with postural instability and gait difficulty, and hippocampal cholinergic function correlates with cognitive measures [5–7]. In addition, increased cholinergic activity in the brain has been reported in PD— proposed to serve as compensatory mechanism of other failing neurotransmitter systems early in the disease course [8–10]. Thus, the cholinergic nervous system is not uniformly affected in PD, but rather displays large heterogeneity throughout the brain, and probably also between patients. These alterations may be cues to different disease progression patterns and be linked to specific PD related symptoms.
The main cholinergic sources for the brain are located bilaterally in the basal forebrain and brainstem, and project predominately to the ipsilateral hemisphere [11–13]. The basal forebrain comprises the medial septal nucleus (Ch1) and vertical limb nucleus (Ch2) innervating the hippocampus, the horizontal limb nucleus (Ch3) innervating the olfactory bulb, and the nucleus basalis of Meynert (Ch4) innervating the cortical mantle and amygdala [14]. Based on non-human primate studies, Ch4 has been divided into subnuclei with relatively distinct projections [15]. The anterior group (Ch4a) projects to the medial frontoparietal cortex and amygdala, the posterior group (Ch4p) innervates the superior temporal cortex and temporal pole, and the intermediate group (Ch4i) projects to the rest of the cortex [15]. Such organization is most likely valid for humans too [16]. Of note, further parcellation of the Ch4 subnuclei has been described [16, 17]. The pedunculopontine nucleus (Ch5) and laterodorsal tegmental nucleus (Ch6) supply the subcortical structures, particularly the thalamus and brainstem [14]. The cerebellum probably receives its main cholinergic input from the medial vestibular nucleus (MVN) [18]. The striatum is dominated by cholinergic interneurons, but also receives some extrinsic cholinergic input [19, 20].
In postmortem studies, Lewy pathology is consistently found in the basal forebrain and pedunculopontine nucleus in PD patients [21–23]. Accordingly, substantial cell loss has been described in both regions, approximately 50%, with substantial inter-study variation (17–90%) [24]. Subnuclei in the basal forebrain are probably unevenly affected; Ch4i show a 33–87% neuron loss, whereas Ch4a display a 19–40% neuron loss in postmortem studies of PD [25]. This variation corresponds to the more severe posterior cortical involvement detected in cholinergic imaging studies [26, 27].
We have hypothesized that PD comprises two subtypes: a brain-first subtype where the disease starts in the brain, and a body-first subtype where the disease starts in the periphery [28]. Intrinsic to the model is that in brain-first PD patients, the disease starts in one hemisphere and initially spares the contralateral side [29]. This may explain why PD is an asymmetric neurodegenerative disease. It is well known that asymmetric motor symptoms are associated with more severe putaminal dopaminergic denervation contralateral to the most affected side [30]. However, according to the model, such asymmetry should also apply to other degenerating neurotransmitter systems, including the cholinergic nervous system.
In the present study, we utilized the positron emission tomography (PET) tracer, [18F]fluoroethoxybenzovesamicol ([18F]FEOBV), to map regional cholinergic alterations in manifest PD patients. In addition, we aimed to reproduce previously reported correlations between PD symptoms and regional cholinergic deficits. Finally, we tested the hypothesis that the most affected side (defined by motor symptom asymmetry index) correlates with the interhemispheric [18F]FEOBV asymmetry.
METHODS
Participants
We included 15 non-demented PD patients diagnosed according to Movement Disorder Society (MDS) diagnostic criteria [31], and 15 age- and sex-matched healthy control subjects (HC). Exclusion criteria: diabetes, previous stroke, previous cancer, and major surgery or radiation therapy to the head. Neurological- and psychiatric disease were considered exclusion criteria in healthy subjects, and in patients unless plausibly related to PD. All participants provided written informed consent. The study was approved by The Central Denmark Region Committees on Health Research Ethics (project number 1-10-72-201-18).
Clinical and neuropsychiatric assessment
Motor function was assessed after minimum 12 h without medication (mean = 13.2 h) with the MDS version of the Unified Parkinson’s Disease Rating Scale part 3 (UPDRS III), and disease stage with the Hoehn & Yahr (H&Y) scale [32]. Levodopa equivalent doses (LEDD) were calculated as previously described [33]. Olfaction was tested with Sniffin’ Sticks 16-item identification battery [34]. Global cognitive function was assessed with the Montreal Cognitive Assessment (MoCA) and REM sleep behavior disorder (RBD) with the REM Sleep Behavior Disorder Screening Questionnaire (RBDSQ) [35]. Executive function was assessed with Stroop interference test and phonemic fluency [36, 37]; processing speed with the Stroop word and Stroop color tests [36]; language by animal fluency [37]; visuospatial function by Benton judgement of line orientation and WAIS IV visual puzzle [38, 39]. Age-corrected scores of the WAIS IV visual puzzle are presented. Benton judgement of line orientation scores were corrected for sex and age [38]. Animal fluency was only tested in nine healthy controls, but in all PD patients. A composite z-score was calculated to use for correlation analyses as the sum of z-scores from the neuropsychological tests. Each z-score in the PD group was calculated as (PDscore–HCmean)/HCSD. The composite z-score is not a measure of global cognition as attention and memory domains were not included. PD patients were on medication at the time of cognitive assessment. For detailed description of the test battery, see Supplementary Material.
Magnetic resonance imaging
A structural T1-weighted MPRAGE sequence was acquired on a 3T Siemens SKYRA MRI system and used for co-registration of PET data. The T1 and a T2 fluid-attenuated inversion and recovery sequence were used to exclude significant structural abnormalities and pathology.
[18F]FEOBV PET protocol
[18F]FEOBV synthesis was performed as previously described [40]. PET data were acquired on a Siemens Biograph Vision 600 PET/CT (Siemens Healthcare, Erlangen, Germany) in list mode from 180–210 min, after intravenous injection of approximately 200 MBq [18F]FEOBV. The head was supported to reduce motion artefacts. Dynamic PET data were binned into six frames of 5 min and reconstructed using resolution recovery and time-of-flight (TrueX+TOF), 8 iterations, 5 subsets, 440 matrix, zoom 2, no filter, and with final voxel size of 0.83 x 0.83 x 1.65 mm3. Motion corrected brain images were reconstructed with a prototype algorithm provided by Siemens Healthineers [41, 42].
Data analyses
Rigid matching of PET images to anatomical MRIs, normalization to Montreal Neurological Institute (MNI) space, and grey and white matter segmentation was performed with PMOD 4.0 software (Zürich, Switzerland). Volumes-of-interest (VOIs) were defined using the built-in Hammers N30R83 atlas, modified to include a thin cylinder-shaped VOI in the center of centrum semiovale (CSO). Since the CSO VOI was used as reference for intensity normalization, it was carefully inspected and, when necessary, moved or edited to avoid grey matter spill-in. This approach resembles the supraventricular white matter reference used previously, and generates CSO-normalized [18F]FEOBV uptake values (equivalent to SUVR) [43, 44]. [18F]FEOBV uptake was computed with and without partial volume correction (PVC). PVC was performed using the built-in VOI-based Geometric Transfer Matrix method in PMOD [45, 46]. Grey matter VOIs were also inspected but no manual corrections were required. As PVC did not alter the differences between PD patients and healthy controls (Supplementary Table 1), the data presented in this study are not corrected for partial volume effects.
Cortical group-wise comparisons and subcortical VOI segmentation were performed in FreeSurfer 7.2.0 (https://surfer.nmr.mgh.harvard.edu/). MRI T1 images were imported using the default pipeline. CSO-normalized PET images were coregistered to MRI. PET data from the MRI-segmented subcortical VOIs were extracted. Group average cortical [18F]FEOBV uptake was flattened to the cortical surface and a 12 mm on-surface smoothing was applied. Then, each point on the surface (vertex) underwent groupwise comparison between patients and HC using t-tests, and a cluster-defining threshold of p < 0.001 was applied. Vertex-wise correlations of CSO-normalized [18F]FEOBV ratios vs. MoCA, neuropsychometric scores, UPDRS III score, Sniffin’ sticks, and disease duration were tested using linear regression analyses (within the PD group only). Here, a threshold of p < 0.01 was applied. Multiple comparison correction was performed with permutation analyses using 10,000 iterations [47]. Reproducibility of previously published correlations between regional cholinergic innervation and clinical data were investigated using the VOI-based [18F]FEOBV data. Specifically, we tested the following correlations: Global neocortical [18F]FEOBV uptake vs. all neuropsychological tests, time since diagnosis, and UPDRS III score [4, 48]; hippocampus [18F]FEOBV uptake vs. MoCA, composite z-scores and language (animal fluency) [7, 10]; executive function (phonemic fluency and Stroop interference score) vs. insula, hippocampus, and cingulate cortex [18F]FEOBV uptake [7]; Sniffin’ sticks score vs. amygdala and hippocampus [18F]FEOBV uptake [49]; postural instability and gait difficulty (PIGD, UPDRS III section 3.10 + 3.12) vs. thalamus, brainstem, and cerebellum [18F]FEOBV uptake [5, 51]; total UPDRS III score vs. putamen [18F]FEOBV uptake [52]. Relative [18F]FEOBV loss (loss of specific binding) in the PD group was calculated as ((HC - PD) / (HC - 1) in both VOI and voxel-data. Asymmetry indices were calculated as (left-right)/((left+right)/2) for interhemispheric [18F]FEOBV uptake and UPDRS III extremity score (items 3.3–8, 3.15–17). The global interhemispheric asymmetry index was based on all VOIs from the neocortex.
Since the parotid glands and retinas displayed clear [18F]FEOBV uptake, between-group differences were explored. The retina standard uptake value (SUV) was extracted by 4 adjacent coronal circular ROIs of 10 mm in diameter, surrounding the hottest area. Parotid gland SUV was determined by outlining the entire organ on PET with subsequent normalization to the anatomical CT volume.
Statistics
Normality was assessed by QQ-plots and histograms. We used t-tests or Mann-Whitney U tests for group comparisons. Pearson’s product-moment correlation coefficient was calculated to explore correlations between VOI-based [18F]FEOBV uptake and clinical data. The Holm-Bonferroni method was applied to reduce the risk of type-I errors due to multiple comparisons [53]. Statistical analyses were performed in Stata v. 13.1 (StataCorp, TX, USA) and GraphPad Prism v. 7.0 (GraphPad Software, San Diego, CA, USA).
RESULTS
Demographic and clinical data are presented in Table 1. The two groups were matched for age and sex. The PD group scored significantly lower on tests of executive function, language, and visuospatial function (Table 2).
Demographic and clinical information
Data is presented as mean (SD) or median (IQR). Bold marks significance.
Results of neuropsychological assessment
Results are presented as mean (SD). Bold marks significance. aAverage z-score of all neuropsychological tests (not MoCA) based on HC data. bActual minus expected interference score when reading and naming speed is controlled for. Negative scores reflect poorer performance than expected.
We found significant [18F]FEOBV uptake reductions in nearly all cortical areas (Fig. 1). The relative loss was largest in the occipital, parietal, and posterior temporal regions generating an anterior-posterior gradient on the mean PD brain. This gradient was also present in healthy controls, but less pronounced. VOI-based analyses showed an average neocortical reduction of 38% in PD patients, ranging from 77% in cuneus to 18% (not statistically significant) in orbitofrontal cortex (Table 3). Limbic and subcortical structures displayed smaller reductions— none were statistically significant after correction for multiple comparisons. No difference in global neocortical nor thalamic [18F]FEOBV uptake was observed in PD patients with probable RBD (RBDSQ ≥6) compared to PD patients without probable RBD (RBDSQ≤5). We did not find any areas with increased [18F]FEOBV uptake in PD patients. No age effect of [18F]FEOBV binding was observed in neither healthy controls nor PD patients. We found no [18F]FEOBV uptake differences between PD patients and HC in the parotid gland and retina.
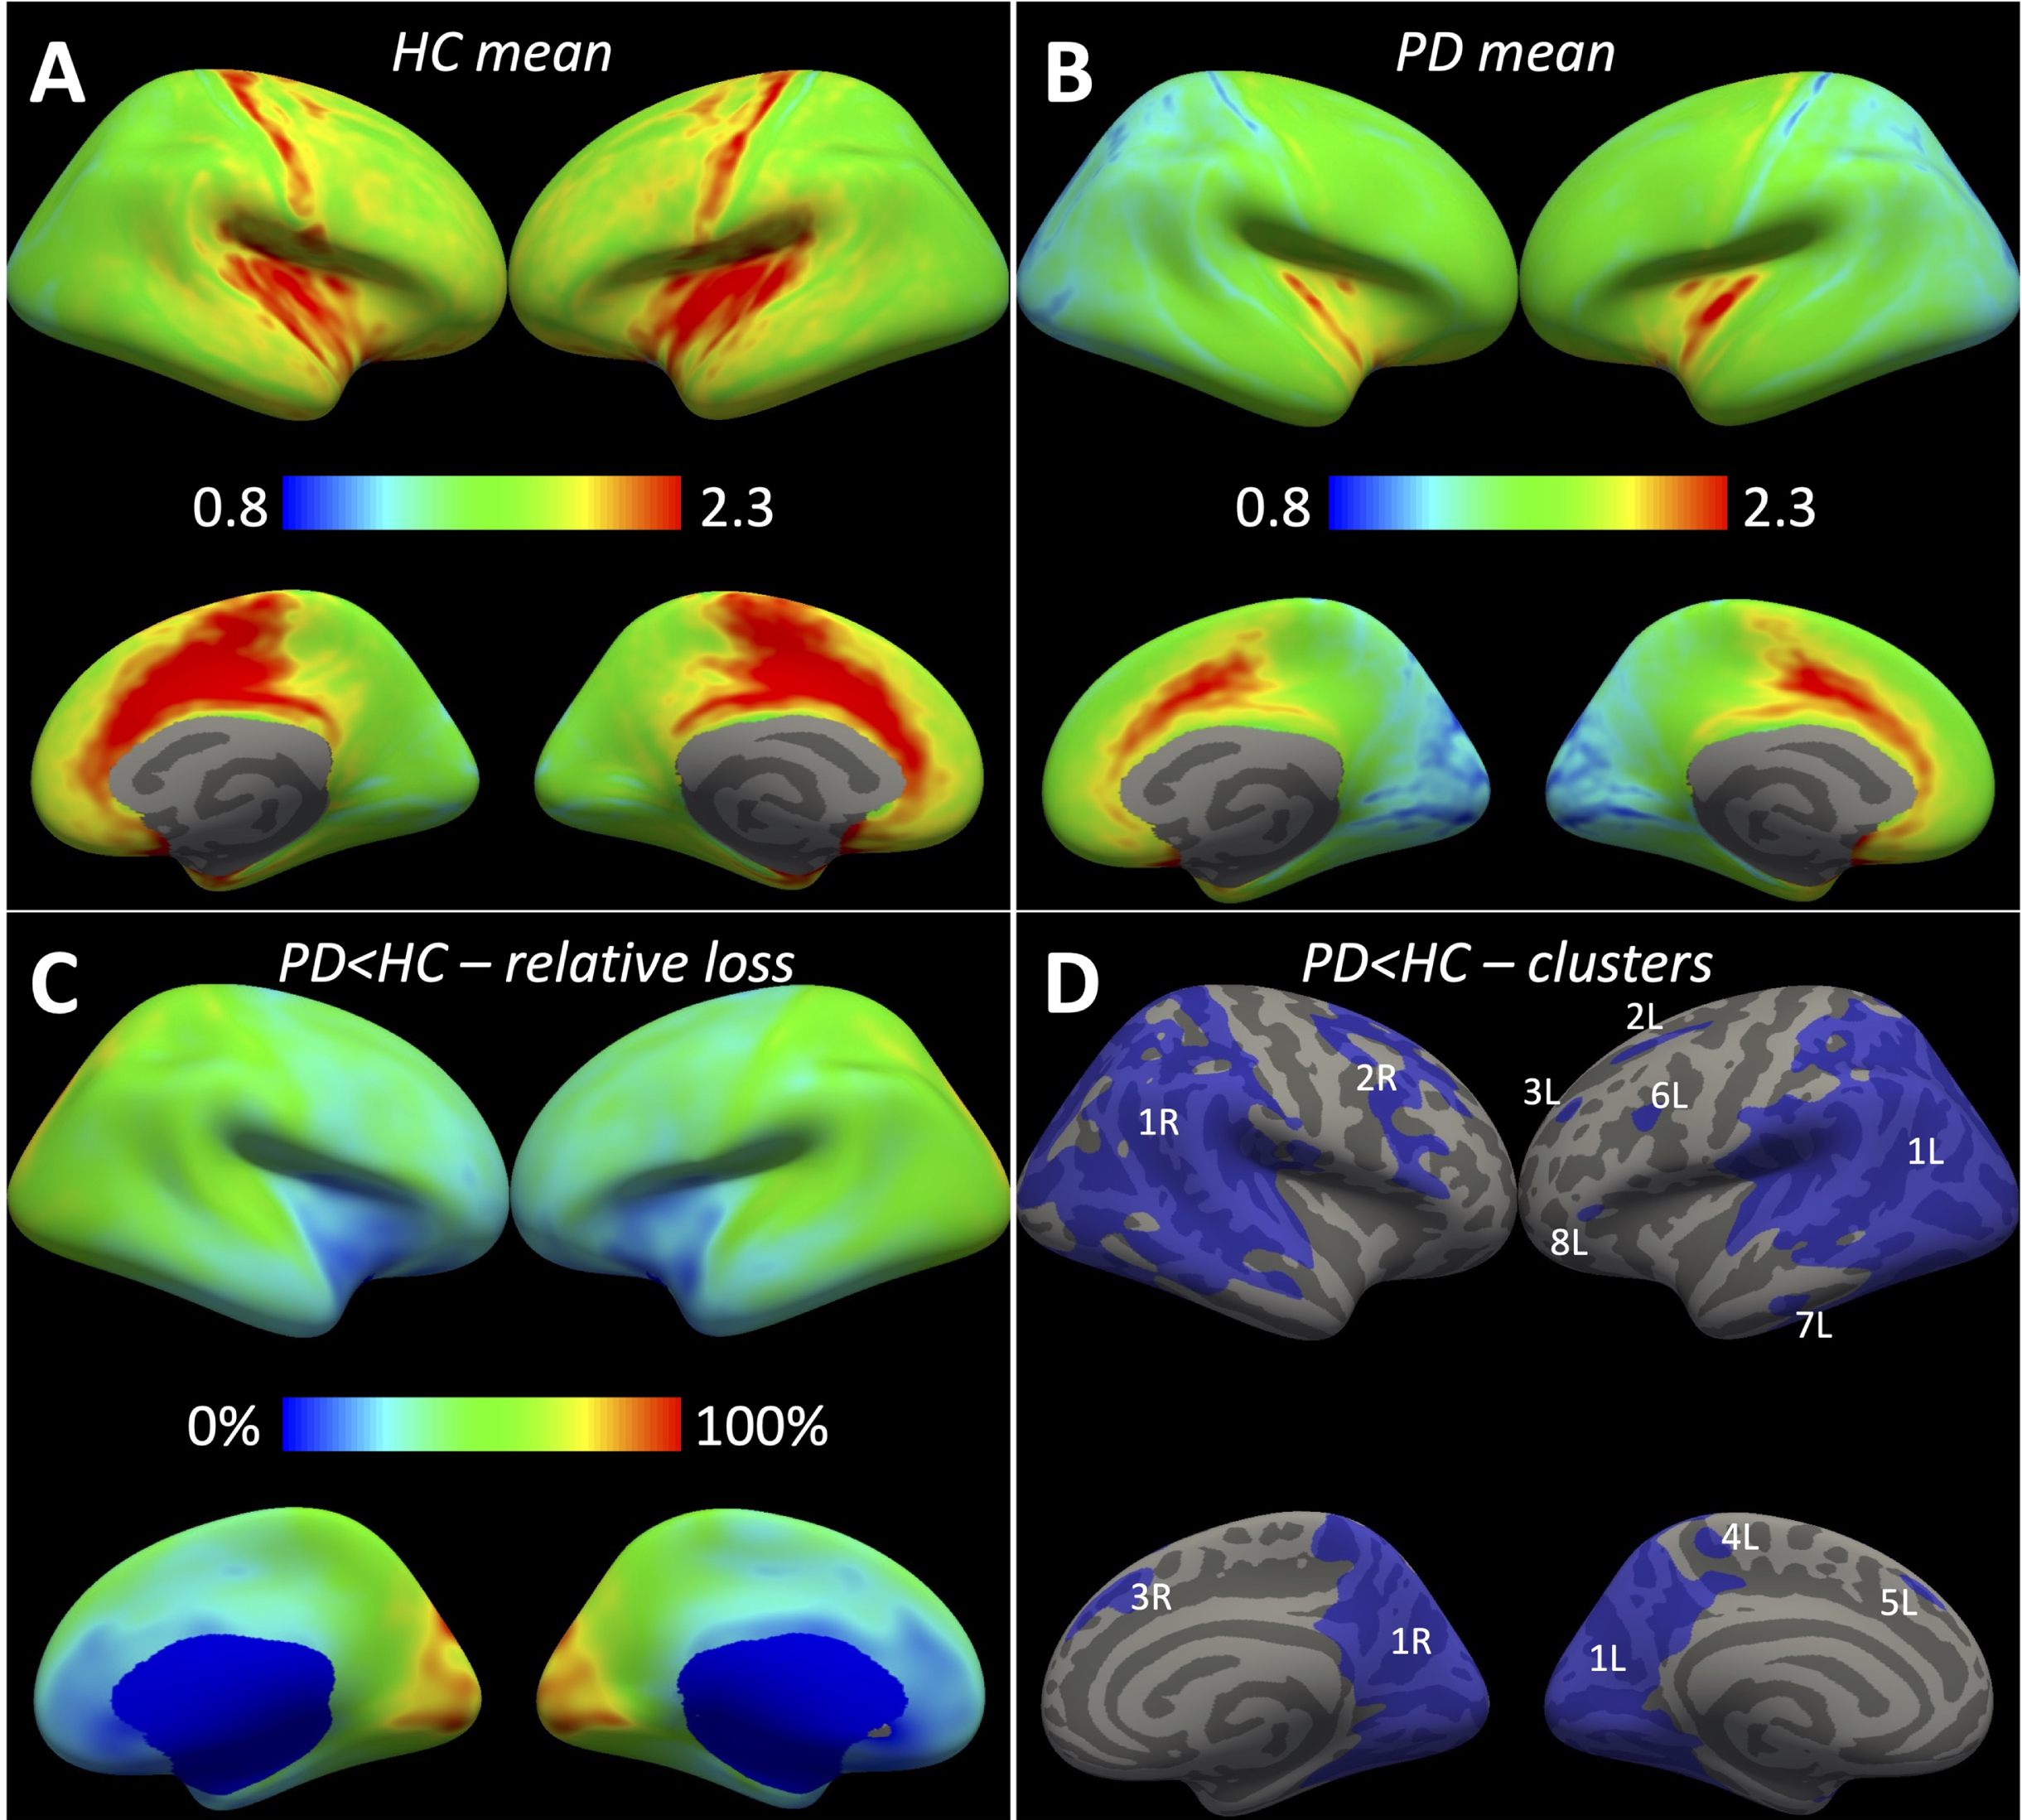
A, B) Mean CSO-normalized [18F]FEOBV uptake in HC and PD. Highest uptake (yellow-red) was found in the insula, pre/post central gyri, paracentral and cingulate cortex. Lowest uptake in PD was found in the cuneus and lingual gyrus (blue). C) Relative loss in PD (loss of specific activity) was most pronounced in occipital, parietal, and superior posterior temporal regions (green-yellow-red). D) Vertex clusters (threshold P < 0.001) with significantly reduced uptake in PD (numbers and letters denote individual clusters –see Table 4).
[18F]FEOBV uptake in cortical, limbic and subcortical structures of PD patients and healthy controls (HC)
Values are presented as mean (SD). aThe Ch-group is not measured directly, but is depicted here to show which nuclei mainly projects to the investigated regions. Ch4a, Ch4 anterior subnuclei; Ch4i, Ch4 intermediate subnuclei; Ch4p, Ch4 posterior subnuclei; IN, interneurons; MVN, medial vestibular nucleus. Sources: [14, 54]. bRelative loss (loss of specific binding –see Methods for calculation). *Significant after multiple comparison correction.
In the vertex-based analysis, a large cluster of significantly reduced [18F]FEOBV uptake was found bilaterally in the occipital region, expanding into posterior parietal and temporal regions (Fig. 1D, Table 4). This mirrored the areas with largest relative loss. Furthermore, smaller clusters were identified in frontal regions in both hemispheres, left paracentral area, and left temporal pole.
Vertex clusters with significantly decreased [18F]FEOBV uptake in PD patients
Cluster location is shown in Fig. 1D (L, left; R, right). MNI, Montreal Neurological Institute; CW p, Cluster-wise p; corrected for multiple comparison.
VOI-based correlation analyses
We found no correlation between global neocortical uptake and any neuropsychological scores, UPDRS III, nor disease duration. We found a correlation between hippocampus uptake vs. animal fluency (r = 0.53, p = 0.043) and the composite z-score from the neuropsychological test battery (r = 0.66, p = 0.008), but not with MoCA. We found a correlation between phonemic fluency score vs. cingulate cortex (r = 0.54, p = 0.038), hippocampus (r = 0.69, p = 0.0048), and insula (r = 0.68, p = 0.0054) [18F]FEOBV uptake. The other measure of executive function, Stroop interference score, did not correlate with [18F]FEOBV uptake in these regions. Negative correlations were found between PIGD severity vs. [18F]FEOBV uptake in thalamus (r = –0.68, p = 0.005), brainstem (r = –0.58, p = 0.024), but not cerebellum. Putamen [18F]FEOBV uptake negatively correlated with total UPDRS III score (r = –0.65, p = 0.0082). A post hoc analysis showed the effect was mainly driven by bradykinesia scores (r = –0.74, p = 0.0017). No correlation was observed between olfactory function (Sniffin’ sticks score) and hippocampus nor amygdala [18F]FEOBV uptake. Only the correlation between the UPDRS-III bradykinesia score and putamen [18F]FEOBV uptake was statistically significant after multiple comparison correction.
We found a significant correlation between interhemispheric [18F]FEOBV uptake asymmetry and UPDRS III extremity asymmetry index (Fig. 2). Similar correlations were also present in the individual lobes but not the putamen, thalamus, hippocampus, and amygdala (Fig. 3).
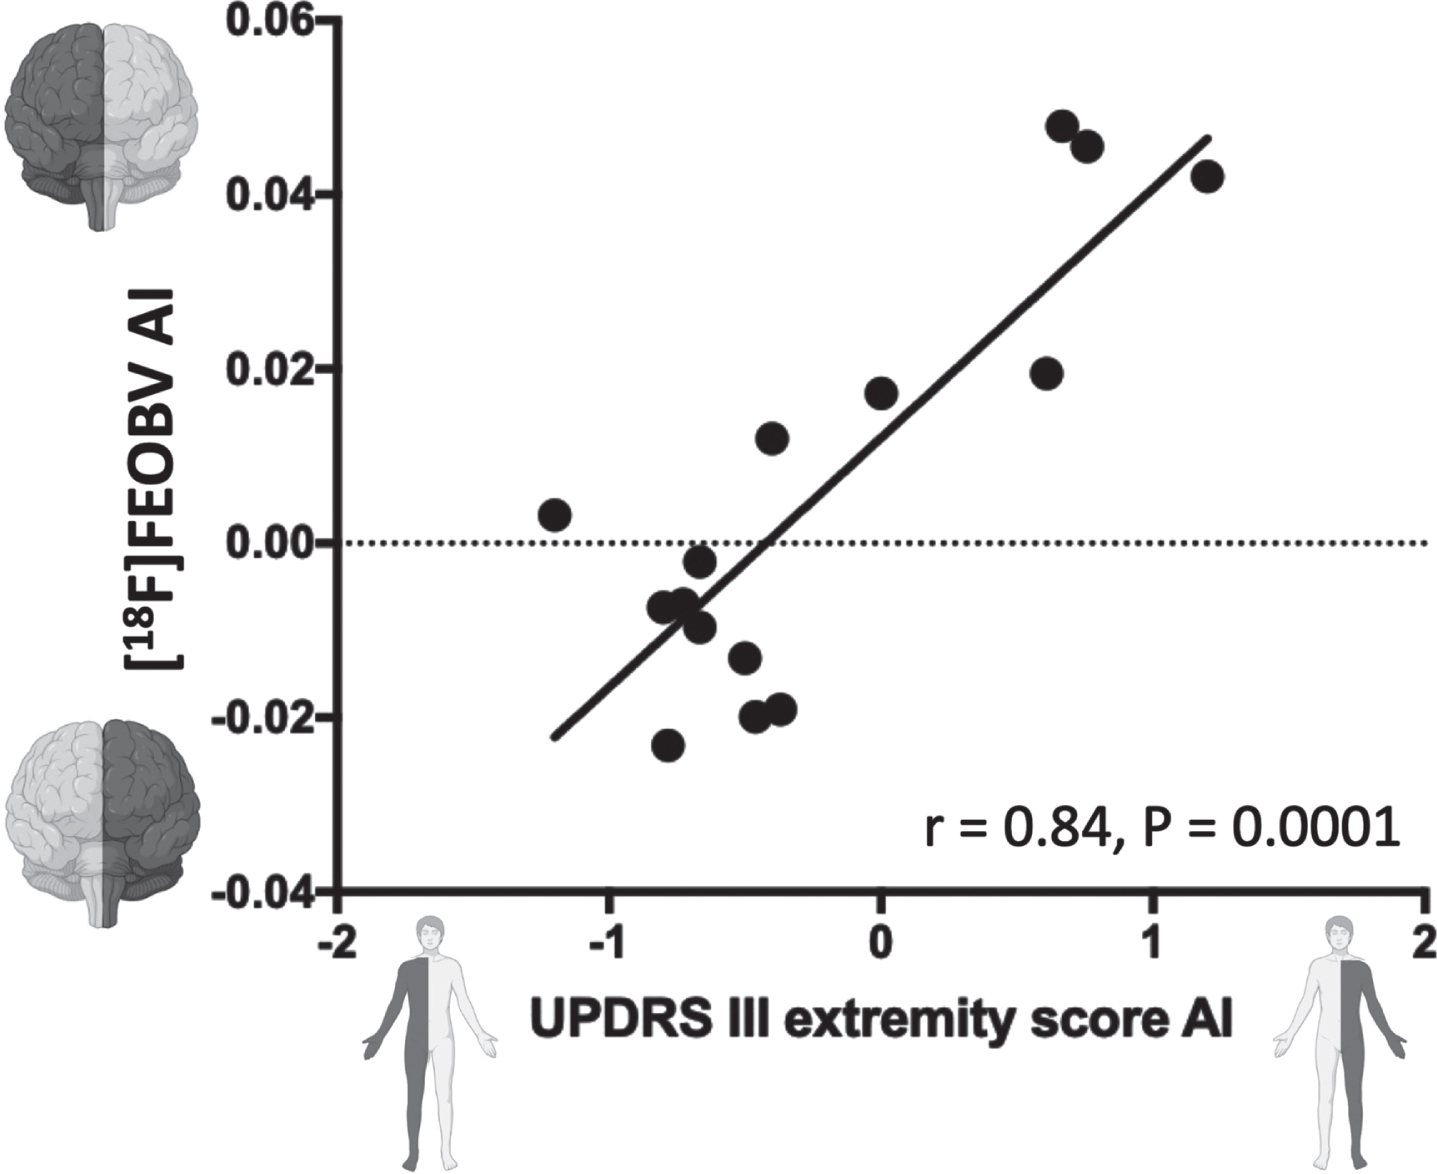
Correlation between asymmetry on UPDRS III extremity scores and left-right interhemispheric [18F]FEOBV asymmetry (based on all neocortical VOIs). Dark grey color marks the affected side. A low [18F]FEOBV uptake in the left hemisphere yields a negative value on the y-axis. A high UPDRS III extremity score on the right side yields a negative value on the x-axis. Thus, cholinergic degeneration of the left hemisphere coexists with right-sided symptoms and vice versa. AI, asymmetry index.
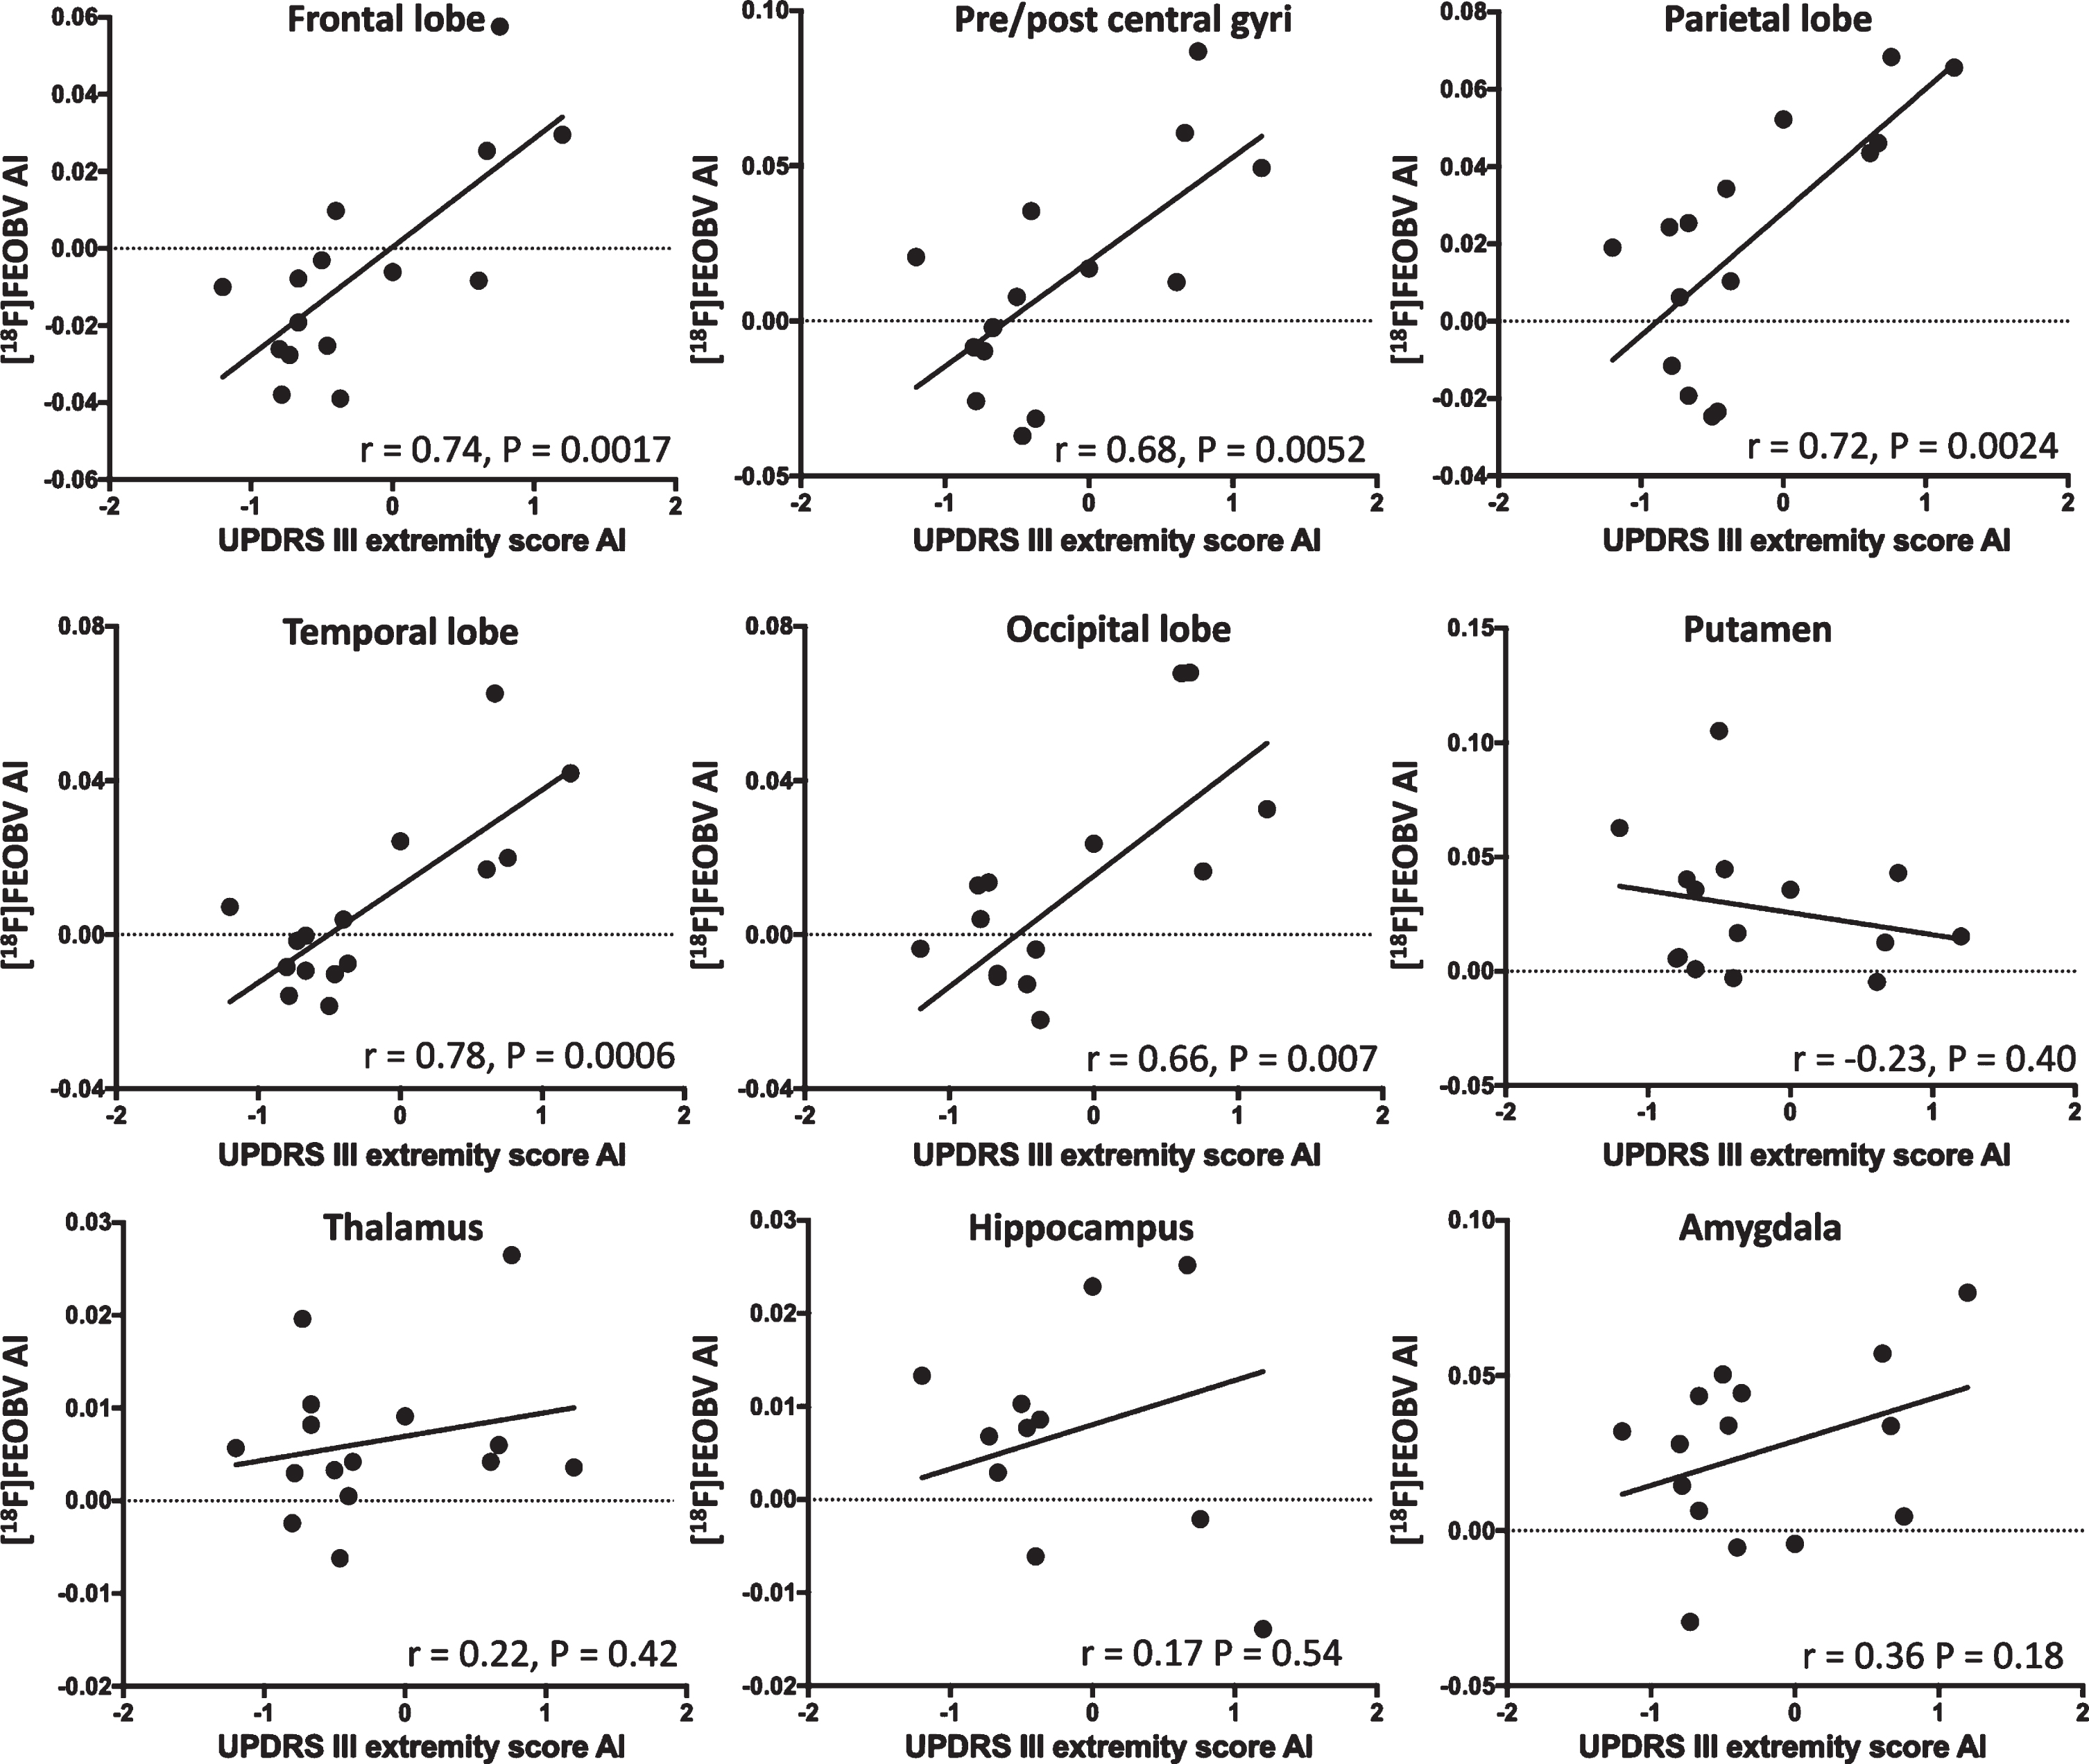
Correlations between left-right [18F]FEOBV uptake asymmetry and asymmetry on the UPDRS III extremity score. A low [18F]FEOBV uptake in the left hemisphere yields a negative value on the y-axis. A high UPDRS III extremity score on the right side yields a negative value on the x-axis. Thus, in the cortex, cholinergic degeneration of the left hemisphere correlates with right-sided symptoms. This effect is not present in the putamen where high [18F]FEOBV uptake arises from interneurons that are resilient to PD pathology. In the thalamus, hippocampus, and amygdala, which are innervated from Ch5-6, Ch1-2, and Ch4a nuclei, respectively, no significant correlations were observed.
Exploratory vertex-wise correlation analyses
In vertex-wise cluster analyses of clinical and neuropsychological data, a bilateral cluster, encompassing the pre/post central gyri, paracentral and medial prefrontal areas, was shown to correlate with Stroop interference score (cluster-wise pleft = 0.03, pright = 0.02, Supplementary Figure 1). The vertex-wise analyses did not identify other clusters with significant correlations.
DISCUSSION
This study showed extensive cholinergic degeneration in the cortex of non-demented PD patients, measured by [18F]FEOBV PET. The most prominent cholinergic loss was in the occipital lobe and posterior parts of the parietal and temporal lobes. In the medial occipital lobe nearly all uptake values in PD patients were reduced by more than one standard deviation from HC mean (Supplementary Figure 2). In the cuneus, seven patients were below two standard deviations from the HC mean. Reductions were also seen in limbic and subcortical structures, although not statistically significant after multiple comparison correction. Partial volume correction did not impact our findings, suggesting that the decreased [18F]FEOBV binding was not caused by atrophy.
Our observations are generally in line with previous studies. An [18F]FEOBV study of 10 non-demented PD patients reported 57% loss in the cuneus and slightly lower reductions in lingual gyrus, lateral occipital, superior parietal, and posterior temporal regions [26]. Another large [18F]FEOBV study showed significant reductions in the entire cortex— most pronounced in the posterior cortices— but not in the limbic nor striatal regions [27]. In addition, acetylcholinesterase (AChE) activity reductions in PD patients exhibit similar topography [55], although one study demonstrated decreased activity in PD patients with probable vs. non-probable RBD (questionnaire based) [56]. We did not observe such difference when stratifying our cohort according to RBDSQ. Future studies should explore this with polysomnography-proven RBD, as questionnaire-based RBD assessment can be inaccurate in PD cohorts [57].
An anterior-posterior gradient was also apparent in HC as previously reported [58], but it was more prominent in PD patients. This may be caused by a heterogeneous or, alternatively, sequential involvement of the Ch4 subnuclei. One study proposed that the Ch4 subnuclei are affected in a Ch4a → Ch4i → Ch4p direction over the course of cognitive decline in PD [25]. Specifically, the authors suggest that this consecutive order would give rise to initial dysexecutive function (frontal and cingulate cortices), later visuospatial dysfunction (parietal and occipital cortices), and finally memory impairment (temporal lobe). However, initial domain-specific cognitive decline varies considerably among PD patients [59]. Also, we found the greatest reductions in cortical areas supplied by the Ch4p and Ch4i (occipital, parietal and posterior temporal cortices), and somewhat lower reductions in areas supplied by the Ch4a group (frontal and cingulate cortices) (Table 3). Although these are cross-sectional data, additional evidence also suggests that this sequence follows the opposite direction. A longitudinal MRI volumetric study showed that Ch4p volume, but not total Ch4, was significantly reduced at baseline in PD patients with suspected mild cognitive impairment (MCI) [60]. However, at 5 years, the entire Ch4 volume was a predictor for cognitive decline, rather than Ch4p alone. These findings indicate that the Ch4p may be the first affected basal forebrain nucleus in many patients [61]. Of note, the most dramatic domain-specific cognitive decline in that study included memory and semantic fluency, which fits well with degeneration of cholinergic Ch4p neurons to the superior temporal cortex and temporal pole. Finally, a review of postmortem data in non-demented PD patients reported higher cell loss in Ch4i (33–87%) than Ch4a (19–40%) [25]. Thus, it is possible that the disease propagates in a Ch4p → Ch4i → Ch4a order, at least in some patients.
Ch1-2 nuclei projecting to the hippocampus may be affected later during the course of cognitive decline or may be more resilient to Lewy pathology than Ch4. Our non-demented PD patients displayed only mild [18F]FEOBV uptake reductions in the hippocampus, which did not survive multiple comparison corrections. This observation is supported by previous AChE imaging studies of non-demented PD patients [4, 62]. In fact, recent [18F]FEOBV studies have reported increased hippocampus uptake in non-demented PD patients, suggested to be caused by cholinergic upregulation in the hippocampus in those with normal cognition [9, 10]. Of note, we did not perform a comparative analysis on PD patients stratified by MCI as only two PD patients had MCI according to diagnostic criteria (Level I; MoCA < 26) [63, 64]. Despite these modest and ambiguous changes, hippocampus [18F]FEOBV uptake in non-demented PD patients correlates with MoCA and domain-specific tests of memory, executive function, language, and attention [7, 10]. We also found a significant correlation between hippocampus [18F]FEOBV uptake and composite z-scores, but not with MoCA. The latter observation may be caused by the narrow range of MoCA scores in the present study. In contrast, imaging studies show that patients with PD dementia and dementia with Lewy bodies display significant cholinergic denervation in the hippocampus, beyond the level seen in non-demented PD patients [3, 62].
In support of these imaging findings, a postmortem study showed reduced ChAT staining in hippocampus of demented PD patients but not PD patients with preserved cognition [65]. Interestingly, no cell loss in Ch1-2 was observed in any of the patient groups, suggesting that the dementia phenotype coexists with hippocampal synaptic cholinergic loss, but in absence of cell body loss. However, frontal cortex ChAT staining was significantly reduced in both demented and non-demented PD patients, indicating involvement of neurons in the Ch4a subnucleus.
Finally, a longitudinal MRI volumetric study showed that Ch4 volume loss preceded and predicted dementia in PD [66]. These changes were followed by Ch1-2 volume loss in PD patients with dementia and dementia converters, but not in patients who remained cognitively intact.
Thus, based on the above mentioned imaging and postmortem data, it could be speculated that the disease progresses in a Ch4p → Ch4i → Ch4a → (Ch3) → Ch2 → Ch1 sequence in parallel with cognitive deteriorations. Consequently, synaptic loss would follow a sequence from posterior cortices → anterior cortices → cingulate cortex → hippocampus, which is in general agreement with cross-sectional data from this and previous cholinergic PET studies. Of note, the largest absolute (but not relative) cortical loss in our data was in the superior posterior temporal cortex, corresponding to Ch4p projections. However, the overlap of the innervation areas between basal forebrain subnuclei may limit such inference from cortical [18F]FEOBV PET images [15]. In addition, the first-affected Ch4 subnucleus may differ among PD patients and depend on the site of the initial α-synuclein pathology. According to the projection pattern from Ch4, amygdala pathology would affect the Ch4a group first and olfactory bulb pathology would affect the Ch3 group first. In addition, brainstem pathology in raphe nuclei, pedunculopontine nucleus, and locus coeruleus would most likely affect the Ch4p group first [67–69]. This hypothesis could be tested in postmortem studies of incidental Lewy body cases with pathology restricted to the amygdala and/or olfactory bulb on the one hand, and cases with isolated brainstem pathology on the other [70]. A careful quantitation of Lewy pathology in cholinergic nuclei and sub-nuclei of such cases might reveal evidence of distinct progression patterns.
We found a negative correlation between the postural instability and gait score on the UPDRS III and [18F]FEOBV uptake in the thalamus and brainstem, although the statistics did not survive multiple comparison correction. Still, this is in line with previous reports, suggesting that loss of cholinergic afferents from the Ch5-6 disrupt the integration of multisensory input involved in balance and walking [5, 51]. A negative correlation was found between total UPDRS III score and putaminal [18F]FEOBV uptake. Post hoc analyses revealed this effect was driven by the bradykinesia score. These findings contradict a recent report that showed a positive correlation between bradykinesia score and [18F]FEOBV uptake in putamen [52]. However, methodological differences may explain this discrepancy. Our [18F]FEOBV data were averaged left/right values of total putamen. In contrast, the other study found the significant positive correlation within a posterior putamen VOI in the more affected hemisphere. Thus, regional variations of cholinergic innervation within the putamen may cause this discrepancy. Indeed, the authors found the highest [18F]FEOBV binding in the posterior putamen [52].
In an exploratory vertex-wise analysis we found one bilateral cluster encompassing the pre/post central gyri, medial prefrontal cortex, paracentral, and superior parietal regions that significantly correlated with Stroop interference scores (included as a measure of executive function). The ability to focus attention whilst avoiding distractions is essential for the task performance (ignoring the words and naming their printed color). A previous PET study showed that cortical AChE activity correlated with the ability to avoid distraction in a PD cohort [71]. However, the strongest correlation was observed in other cortical areas than our vertex-wise cluster. In addition, the Stroop interference score may be particularly determined by anterior cingulate and dorsolateral prefrontal activation [72], which was not included in our cluster. Thus, the present finding may be questionable and should be reproduced before any conclusions can be drawn.
While asymmetric striatal dopamine deficiency is a well-known imaging finding in PD, asymmetric cholinergic loss has received very little attention. Since putaminal dopaminergic degeneration, as shown by imaging, correlates robustly with the severity of contralateral motor symptoms [30], we hypothesized that the relationship between asymmetry in extremity score (based on UPDRS III) would also correlate with the interhemispheric [18F]FEOBV asymmetry. Indeed, we found a significant correlation between motor symptom asymmetry and neocortical [18F]FEOBV asymmetry (Fig. 2). The significant correlation persisted within all cortical lobes (Fig. 3) but was absent in the putamen. These observations suggest that the more affected hemisphere displays decreased striatal dopaminergic innervation and concomitantly decreased cortical cholinergic innervation. Importantly, we do not suggest that the asymmetric [18F]FEOBV uptake explains the asymmetric motor symptoms to any significant degree. Rather, we propose that the present observation provides evidence that Lewy pathology arises in one hemisphere in patients with brain-first PD [28]. The initially asymmetrically distributed Lewy pathology will lead to not only predominantly ipsilateral dopaminergic degeneration (thereby explaining the well-known motor asymmetry), but also to ipsilateral degeneration of other vulnerable neurotransmitter systems including cholinergic projection neurons in the basal forebrain [29]. Of note, body-first PD is not thought to be completely symmetric in all cases, but just significantly less asymmetric compared to brain-first PD [73]. The lack of asymmetry correlation in the putamen was expected, as the primary source of cholinergic activity is derived from interneurons, which are less affected in PD. Also, the [18F]FEOBV uptake may even increase in the putamen with most severe dopaminergic loss [52]. In the thalamus, hippocampus, and amygdala, no significant correlations on asymmetry were observed. While this was unexpected, it may be explained by the noisier data derived from these small regions (compared to the individual lobes). Also, these regions did not show significantly reduced [18F]FEOBV uptake in PD patients, which may have prevented detectable asymmetry to appear.
It is well known that the nigrostriatal dopamine system shows particularly severe degeneration in PD, amounting to a 50–60% reduction of putaminal dopamine terminals at the time of diagnosis [74]. In this context, it is interesting to note that our cohort of mild-moderate stage disease patients displayed a 64–77% reduction of [18F]FEOBV specific binding in the medial occipital lobe. This observation suggests that the loss of cholinergic innervation in the most affected regions may be equal to the severity of putaminal dopaminergic denervation, emphasizing that PD is a multi-system disorder and that more focus is needed on the study of non-dopaminergic degeneration [75].
This study has several limitations. First, our sample size was relatively small which may have limited our ability to show strong correlations between [18F]FEOBV data and clinical/neuropsychological data in the vertex-wise analyses. Also, subcortical areas were not included in these explorative analyses. The composite z-score was not based on tests from all cognitive domains and is thus not a measure of global cognition. Also, the z-scores were derived from our rather small control group and should therefore be interpreted with caution. The cognitive status of PD patients was generally good, generating a narrow range on cognitive measures. This may have prevented detection of neocortical correlates to MoCA and domain-specific neuropsychological scores. However, regional cholinergic degeneration is not topographically correlated to a specific cognitive function. Major overlap exists between different cognitive domain scores and regional cholinergic degeneration, suggesting that a shared cholinergic foundation facilitate cognition in general, which is not revealed in a VOI-based correlation analysis. In addition, the attempt to reproduce previous correlations between regional cholinergic denervation and clinical measures is challenged by different tracers, cohorts, and methodologies. Also, several correlations did not survive multiple comparison correction, indicating that our study may have been under powered in this regard. However, the main objective of this study was to map the degree of cholinergic degeneration in a cohort of manifest PD patients. For this purpose, the study sample was sufficient as highly significant reductions were identified throughout the cortex. The large number of regions explored in the VOI-based analyses may have caused type-1 errors. However, the areas with decreased uptake were largely included in a complementary cluster analysis with a threshold of p < 0.001 and subsequent multiple comparison correction. In addition, all VOI-based estimates were corrected for multiple comparisons using the Holm-Bonferroni method [53].
In conclusion, early-to-moderate stage non-demented PD patients showed significant cholinergic degeneration in the entire cortical mantle, but only modest non-significant reductions in the subcortical structures. VOI-based correlation analyses between reduced [18F]FEOBV uptake and neuropsychological and motor scores supported some previous reports, although most did not survive multiple comparison correction. The interhemispheric [18F]FEOBV asymmetry displays a strong correlation to contralateral motor symptoms, suggesting that asymmetric involvement of substantia nigra coexist with ipsilateral loss of cholinergic nerve terminals from Ch4 (Nucleus basalis of Meynert). Future longitudinal studies should explore the temporal development of regional cholinergic degeneration and the collateral motor and cognitive deteriorations.
Footnotes
ACKNOWLEDGMENTS
The authors thank Anders Bertil Rodell for assistance and help with Siemens’ algorithm protype for motion correction. The study was funded by Lundbeck Foundation [grant number: R190-2014-4183] and Aase og Ejnar Danielsens Fond [project nr. 36456]. Funding sources had no role in the study.
CONFLICT OF INTEREST
The authors declare no conflicts of interest.