
Abstract
Background:
Neurofilament light is a marker of axonal degeneration, whose measurement from peripheral blood was recently made possible by new assays.
Objective:
We aimed to determine whether plasma neurofilament light chain (NfL) concentration reflects brain white matter integrity in patients with early Parkinson’s disease (PD).
Methods:
137 early PD patients and 51 healthy controls were included. Plasma NfL levels were measured using ultrasensitive single molecule array. 3T MRI including diffusion tensor imaging was acquired for voxelwise analysis of association between NfL and both fractional anisotropy (FA) and mean diffusivity (MD) in white matter tracts and subcortical nuclei.
Results:
A pattern of brain microstructural changes consistent with neurodegeneration was associated with increased plasma NfL in most of the frontal lobe and right internal capsule, with decreased FA and increased MD. The same clusters were also associated with poorer global cognition. A significant cluster in the left putamen was associated with increased NfL, with a significantly greater effect in PD than controls.
Conclusion:
Plasma NfL may be associated with brain microstructure, as measured using diffusion tensor imaging, in patients with early PD. Higher plasma NfL was associated with a frontal pattern of neurodegeneration that also correlates with cognitive performance in our cohort. This may support a future role for plasma NfL as an accessible biomarker for neurodegeneration and cognitive dysfunction in PD.
INTRODUCTION
Neurofilament light chain (NfL) is a protein which is shed during neuronal damage and is measured at increased levels in the cerebrospinal fluid (CSF) of people with neurodegenerative disease. CSF NfL concentration is recognized as a possible marker of neuroaxonal loss in a range of neurological diseases [1].
New assays such as single molecule array (Simoa) have allowed the measurement of NfL from peripheral blood rather than CSF, making it more accessible and of lower risk to the patient. An increasing number of clinical studies show findings of plasma NfL being related to severity of neurodegenerative diseases, including multiple sclerosis [2], frontotemporal dementia [3], and amyotrophic lateral sclerosis [4].
In Parkinson’s disease (PD), we previously showed that plasma NfL was elevated compared to controls, and was related to poorer motor and cognitive performance [5]. Other studies have shown that plasma NfL is higher in PD than controls [6], distinguishes PD from atypical PD [7]; and is associated with disease duration [7], and motor and cognitive symptoms [8]. Early imaging studies have shown association of NfL in PD with cortical thinning in temporal and insular regions [9], and— in the cortex only— mean diffusivity changes in parahippocampal and temporo-occipital grey matter [10].
However, still little is known about the association of plasma NfL and axonal integrity in PD, in either white matter or subcortical nuclei. MRI-based measures of axonal integrity may therefore help to understand which areas of the brain are aberrant in patients with elevated NfL in the blood, and the precise nature of those changes.
Fractional anisotropy (FA) and mean diffusivity (MD) are widely used, well validated MRI-based measures of microstructural integrity in the brain [11], including in PD [12]. FA is a summary measure of microstructural integrity and is typically lowered by axonal degeneration, while MD is an inverse measure of membrane density and is increased by demyelination. Axial diffusivity (AD) and radial diffusivity (RD) are also diffusion MRI-based measures which describe the magnitude of diffusion parallel and perpendicular to axonal fibers, respectively [11]. Thus AD is typically reduced with axonal degeneration while RD is increased by degeneration and demyelination, and increased with greater density of fibers [11].
If plasma NfL is associated with changes in FA or MD in early PD, this would serve to support its future clinical application as a marker of neuronal damage. Furthermore, if we could identify the specific regions in which NfL and brain microstructure are related, this could shed light on the mechanisms through which NfL relates to clinical outcome. Therefore, our primary aim was to determine whether plasma NfL reflects changes in brain microstructure, as measured using FA and MD in patients with early PD. We hypothesized that NfL would be inversely related to white matter FA and positively related to white matter MD in early PD to a greater extent than in controls. Since both NfL and white matter diffusivity are known to increase with normal aging [13], a secondary hypothesis was that these microstructure-NfL associations would remain greater in PD compared to age-matched controls. Last, we hypothesized that severity of motor and cognitive symptoms would be associated with both NfL and FA/MD.
METHODS
Participants
We recruited patients with early PD and healthy controls for the Parkinson’s Disease Longitudinal Singapore prospective cohort study between 2014 and 2020 [14, 15]. The PD group was recruited within one year of diagnosis from both campuses of the National Neuroscience Institute based on the National Institute of Neurological Disorders and Stroke (NINDS) diagnostic criteria. Individuals were excluded if their diagnosis was subsequently changed (all patients with at least 2 years’ follow-up), if they met the diagnostic criteria for dementia at the time of recruitment, if they did not speak English or Mandarin, if they had a history of stroke, active malignancy, end-organ failure, or major orthopedic abnormalities, if they had other neurological and psychiatric conditions, or if they did not have complete MRI, clinical and plasma NfL data. Extreme outliers were excluded (defined as the 1st or third quartile±3×inter-quartile range, using group as a factor) in terms of clinical scores or brain atrophy (based on parenchymal fraction) since major atrophy would degrade the quality of image registration and subsequent voxelwise diffusion measurements (Supplementary Material).
Healthy controls were recruited from the community and were free of significant neurological, psychiatric or systemic disease.
Standard protocol approvals, registrations, and patient consents
All individuals gave written, informed consent and the study was approved by the Singapore Health Services Centralised Institutional Review Board.
MRI
We acquired MRI data on a 3T Siemens Skyra MRI scanner (Siemens, Erlangen, Germany) equipped with a 32-channel head coil and the Syngo MR D13 software version, located at Singapore General Hospital between September 2014 and present. No changes to the scanner software were made during the course of the study.
The MRI scan included a multi-shell diffusion-tensor imaging (DTI) sequence with the following parameters: TE = 0.102 s, TR = 10.118 s, FA = 90°, in-plane voxel size = 1.8x1.8 mm, slice thickness = 2.5 mm, matrix = 112x112x55, anterior-posterior phase encoding, 60 diffusion-weighted volumes (30 at b = 1000 mm/s2 and 30 at 2000 mm/s2) evenly distributed on the unit sphere and 3 volumes with b = 0 mm/s2. Sagittal T1-weighted MPRAGE sequence was acquired with the following parameters: TE = 2.44 ms, TR = 1.9 s, TI = 900 ms FA = 9°, in-plane voxel size = 1x1 mm, slice thickness = 1 mm, matrix = 256x256x256. FLAIR images were acquired with the following parameters: TE = 132 ms, TR = 7 s, TI = 2210 ms, FA = 150°, in-plane voxel size = 0.859x0.859 mm, slice thickness = 4 mm, matrix = 256x256x30.
Image processing
We processed the diffusion MRI data using MRTrix3 [16] and FSL [17] with the following steps: removal of non-brain tissues, denoising, correction of Gibbs’ ringing artefacts, motion and eddy current correction, bias field correction and calculation of FA, MD, AD, and RD. These data were then aligned to a common space (the MNI152 average brain) using boundary-based registration and nonlinear registration with FLIRT and FNIRT. We performed tract-based analysis of diffusion scalars using tract-based spatial statistics (TBSS) [18]. In short, a mean FA image was used to create an FA “skeleton,” which represents the centers of all tracts. Each subject’s aligned diffusion data were projected onto the skeleton and the resulting data fed into voxelwise cross-subject statistics. The same approach was applied using a mask of sub-cortical regions (thalamus, putamen, caudate, globus pallidus, hippocampus, and amygdala) extracted from the Harvard-Oxford Subcortical Atlas.
FLAIR images were used to measure white matter lesion load (hyperintensity burden) according to a previous article [14] using the probabilistic framework in SPM8 (http://www.fil.ion.ucl.ac.uk/spm).
Atrophy was quantified using parenchymal fraction: based on the volumes reported for automatic segmentation of the T1-weighted image by FreeSurfer, we normalized the volume of brain parenchyma (i.e., excluding CSF) to the total intracranial volume.
Motor, cognitive, and cardiovascular risk assessments
Motor assessments (for the PD group only) included the Movement Disorders Society Unified Parkinson’s Disease Rating Scale Part III (MDS-UPDRS-III) [19] and Hoehn & Yahr stage (H&Y) [20]. Global cognition was assessed for both PD and control groups using the Mini-Mental State Examination (MMSE) [21]. Cardiovascular risk was assessed with the modified Framingham 10-year cardiovascular risk score (mFRS), which was derived using age, gender, smoking status, diabetes status, systolic blood pressure, use of antihypertensives, and BMI [22]. The mFRS, expressed as a percentage, is an estimation of the risk of cardiovascular disease events in the next 10 years. All evaluations were performed by qualified movement disorders neurologists and trained raters. All assessments and MRI were performed during the “ON” medication state.
Plasma NfL
Blood samples for both controls and patients were collected approximately 30 days before the MRI. EDTA blood samples were centrifuged at 1,500 g for 15 min within 1 h of collection. Plasma was aliquoted and stored at –80°C until further analysis. Samples were thawed only once for NfL measurement. Plasma NfL levels were measured using ultrasensitive single molecule array (Simoa) Human NfL assay and Simoa HD-1 Analyzer (Quanterix, MA), following the same methodology as described previously [5].
Statistical analysis plan
Categorical variables were reported as frequency and percent, and continuous variables were described via mean±standard deviation or median and first- and third-quartile (where appropriate). Demographics, NfL levels and clinical features were compared between PD and healthy controls using chi-square and two independent sample t-test or Mann-Whitney U test (depending on whether normality assumption was tenable) for categorical and continuous variables, respectively. Distributions of the demographic variables, cognitive scores and NfL were checked by Kolmogorov-Smirnov test and visual inspection of histograms. The distribution of NfL was moderately right-skewed so we applied a natural logarithm transformation, as per convention, which normalized it (Supplementary Material). Thus, we refer throughout to “NfL” as the natural log-transformed NfL.
For voxelwise analyses, a general linear model was applied, using permutation-based testing in randomize/PALM with 5000 permutations [23]. The family-wise error rate was controlled across voxels and also controlled across all two-sided image contrasts, and threshold-free cluster enhancement applied.
The primary hypothesis was tested in the PD group with the FA and MD contrasts using NfL as the covariate of interest and controlling for age, sex, disease duration, white matter lesion load, and mFRS as covariates of no interest, in the white matter skeleton and subcortical regions.
A second design was used, including both groups’ data to test the interaction effect of NfL and group on the dependent variables, FA and MD, while controlling for the same variables but only within the significant area identified in the primary tests. This addresses the secondary hypothesis, that microstructure-NfL effects would be greater in PD than controls. Hence this was to determine whether the observed effect was specific to the PD group or part of a generalized effect.
Within each significant cluster, the mean AD and RD were measured and tested for association with NfL by linear regression analysis, controlling for the same variables.
Finally, we tested whether the MDS-UPDRS-III and MMSE scores were associated with FA/MD using the same voxelwise approach in the significant regions identified previously but with LEDD (L-dopa equivalent daily dose) as an additional covariate and to NfL using linear regression analysis. We did not control education, as it was confounded by age, gender and disease duration. For linear regression models, normality assumption on the residuals was tenable. Robustness of the linear regressions was checked by quantile-quantile plots and multicollinearity checked by the variance inflation factor (Supplementary Material).
Significance level was set at p < 0.05. Statistical analysis was performed using SPSS (IBM SPSS Statistics for Windows, Version 26.0. Armonk, NY: IBM Corp).
Data availability statement
Anonymized data are available upon reasonable request from any qualified investigator.
RESULTS
Sample characteristics
For this study, we included data from 188 individuals (Table 1). Overall, our PD sample (n = 137) was representative of early-stage PD (mean H&Y stage = 1.8) and was not different from controls (n = 51) in age or sex. 7% of PD patients had mild impairment on the MMSE (MMSE < 24) and 1% of patients had moderate impairment (MMSE < 20).
Demographic and clinical data for Parkinson’s disease and control groups
Values shown as mean (±standard deviation) for normally distributed variables; median (1st–3rd quartile) for non-normally distributed variables; and frequency (%) for categorical variables. *p-value for the group difference was tested by t-test for continuous variables, Chi-square test for categorical variables and Mann-Whitney U test for non-normally distributed continuous variables. PD, Parkinson’s disease; LEDD, L-dopa equivalent daily dose; MDS-UPDRS-III, Movement Disorders Society Unified Parkinson’s Disease Rating Scale Part III; H&Y, Hoehn & Yahr Stage; MMSE, Mini-Mental State Examination.
As expected, the median plasma NfL levels were higher in PD than controls (13% higher), although this difference was not significant, due to the very early disease stage: the median (first quartile, third quartile) untransformed NfL was 13.9 (10.2, 19.2) pg/ml for the PD group and 12.2 (10.2, 17.5) pg/ml for controls, with no group difference in either transformed (p = 0.730) or untransformed NfL (p = 0.288). Plasma NfL was significantly correlated with age (p < 0.001) and the volume of white matter lesions (p = 0.019), but was not correlated with MMSE, MDS-UPDRS-III, sex or disease duration (Supplementary Material).
Voxelwise association of NfL and FA/MD
We found two distinct sets of regions with significant associations between FA/MD and NfL in early PD patients when controlling for age, sex, disease duration, mFRS, and white matter lesion load. Figures 1 and 2 show the significant clusters while Table 2 shows the cluster statistics.
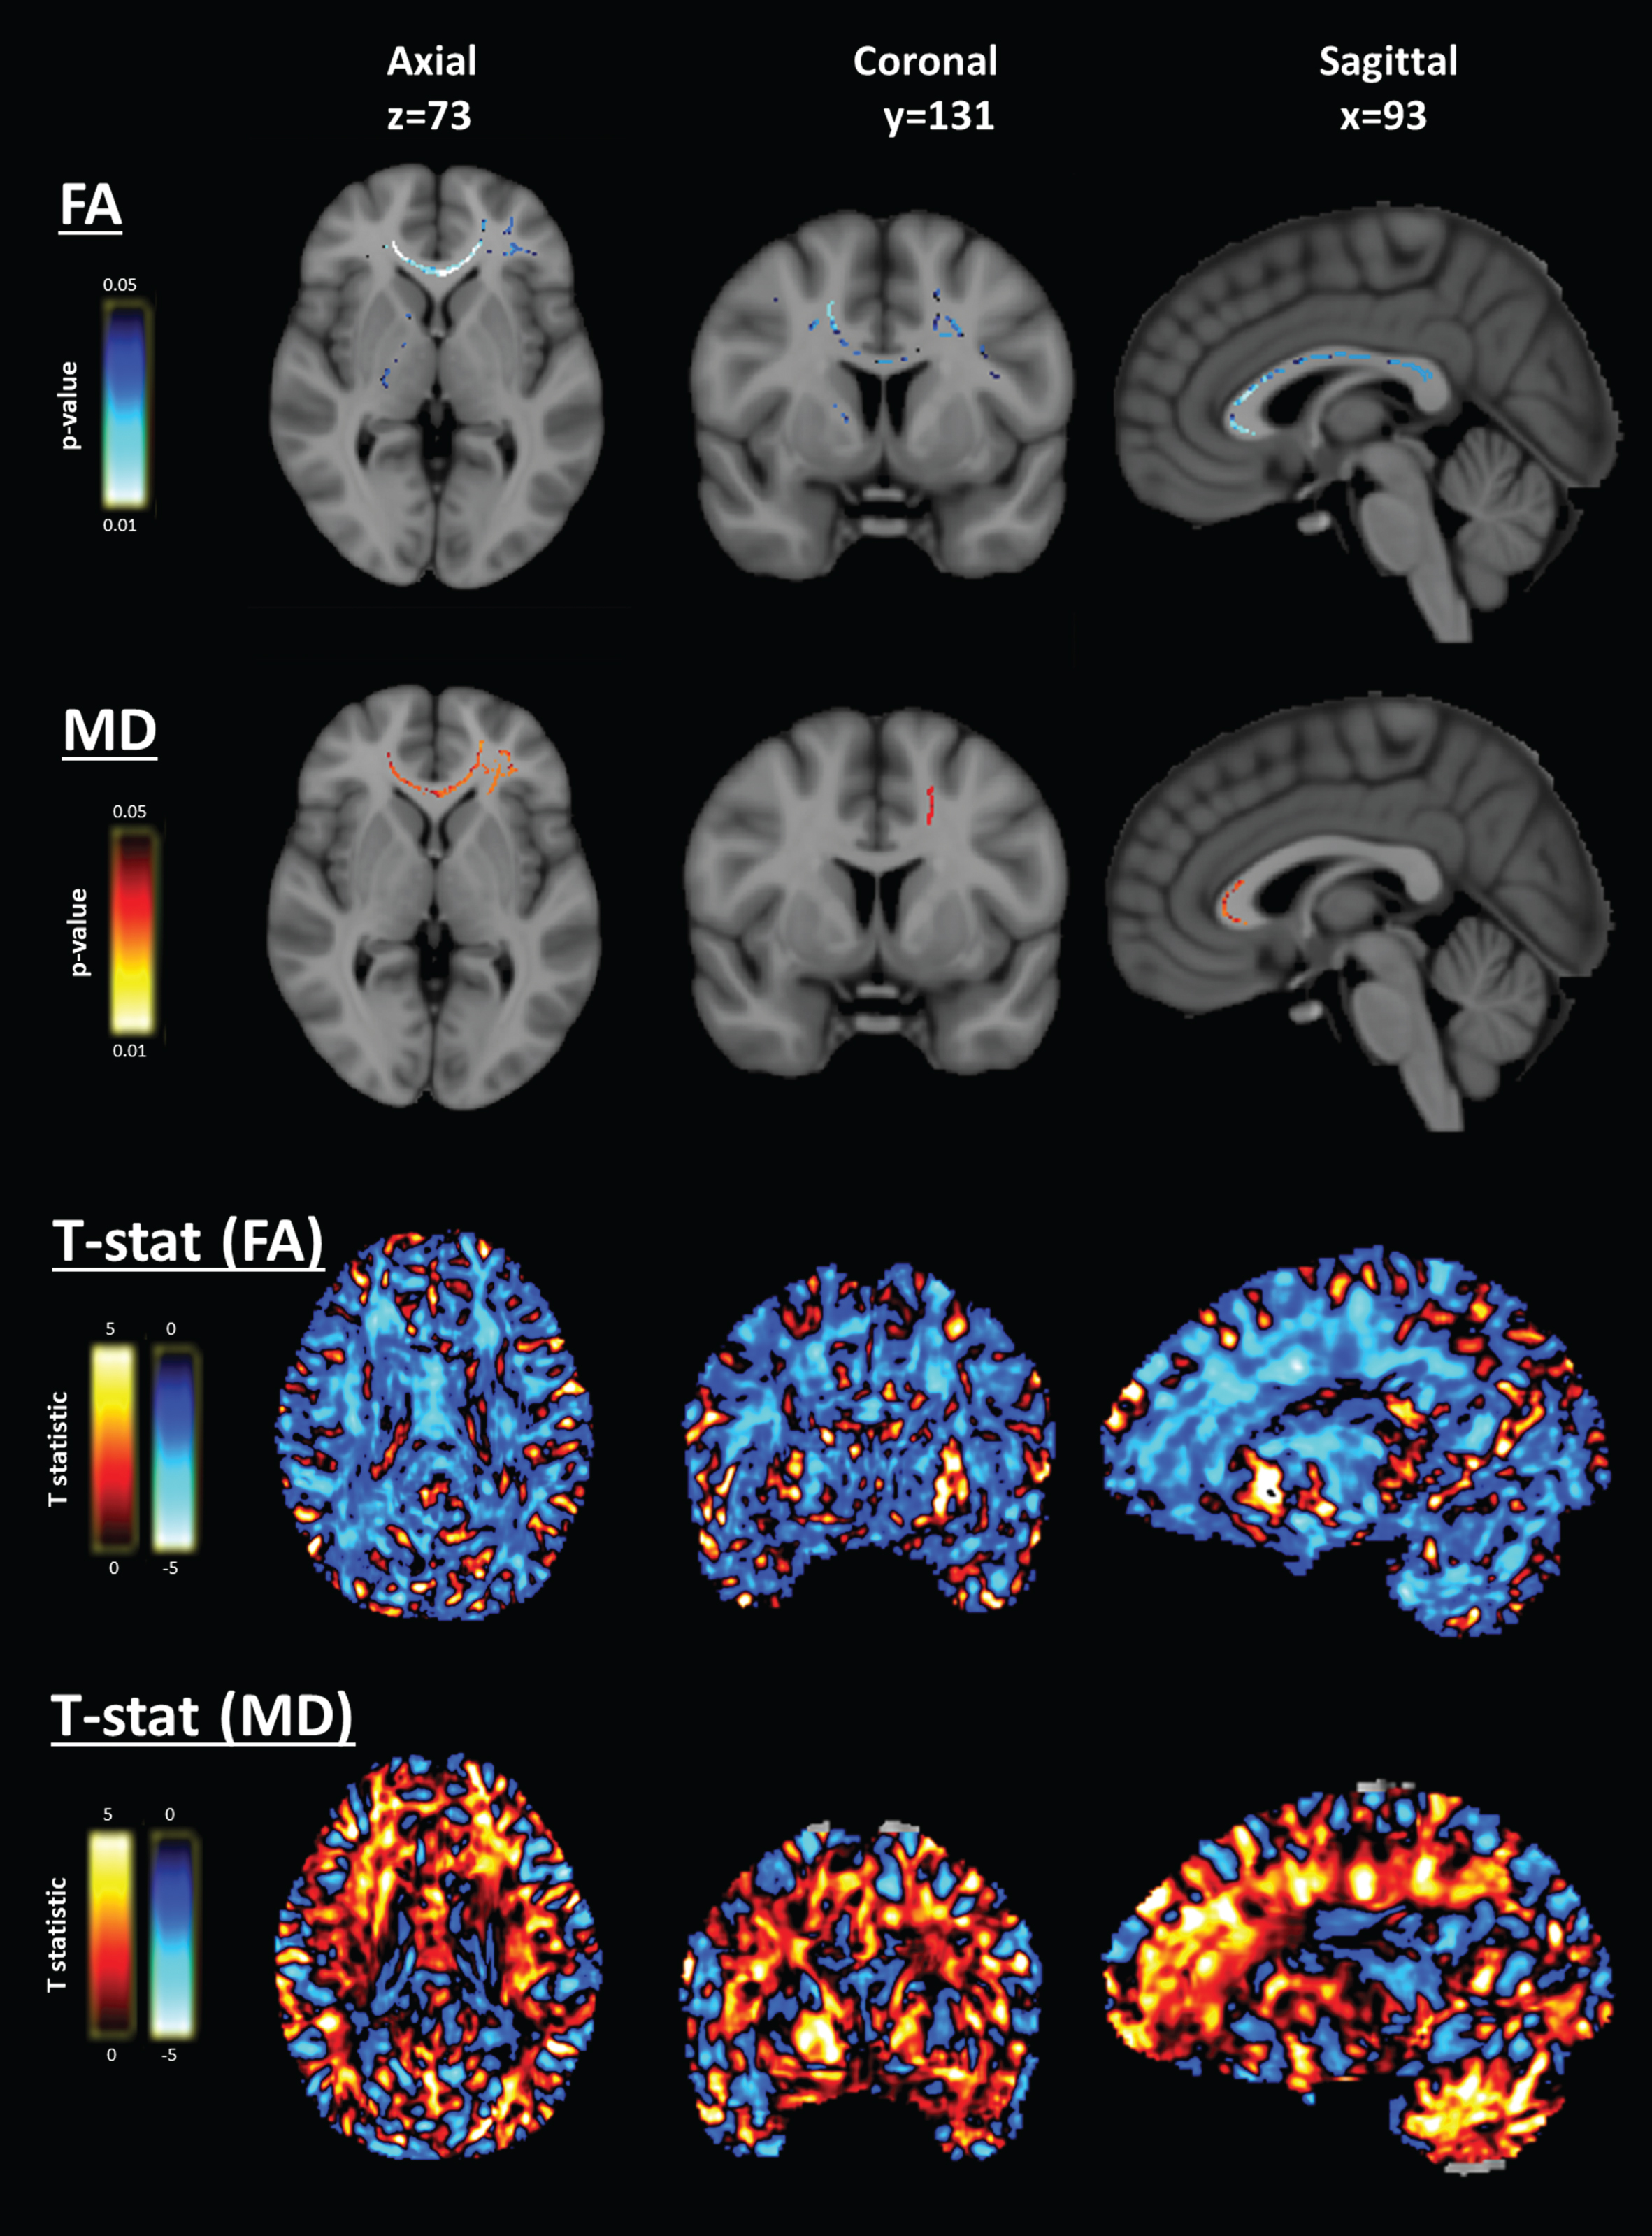
Voxelwise association of neurofilament light (NfL) and diffusion MRI – frontal white matter clusters. Voxelwise analyses of fractional anisotropy (FA) and mean diffusivity (MD) in the white matter tracts revealed a frontal white matter and right internal capsule region with largely overlapping significant clusters of association for FA and MD, and the whole-brain distribution of t statistics suggesting a widespread pattern of inverse association of FA and NfL, and positive association of MD and NfL in most cerebral white matter. Data are overlaid on the 1 mm MNI152 average brain template. Slice numbers are given in reference to the MNI152 template image. Blue indicates negative association and red indicates positive association.
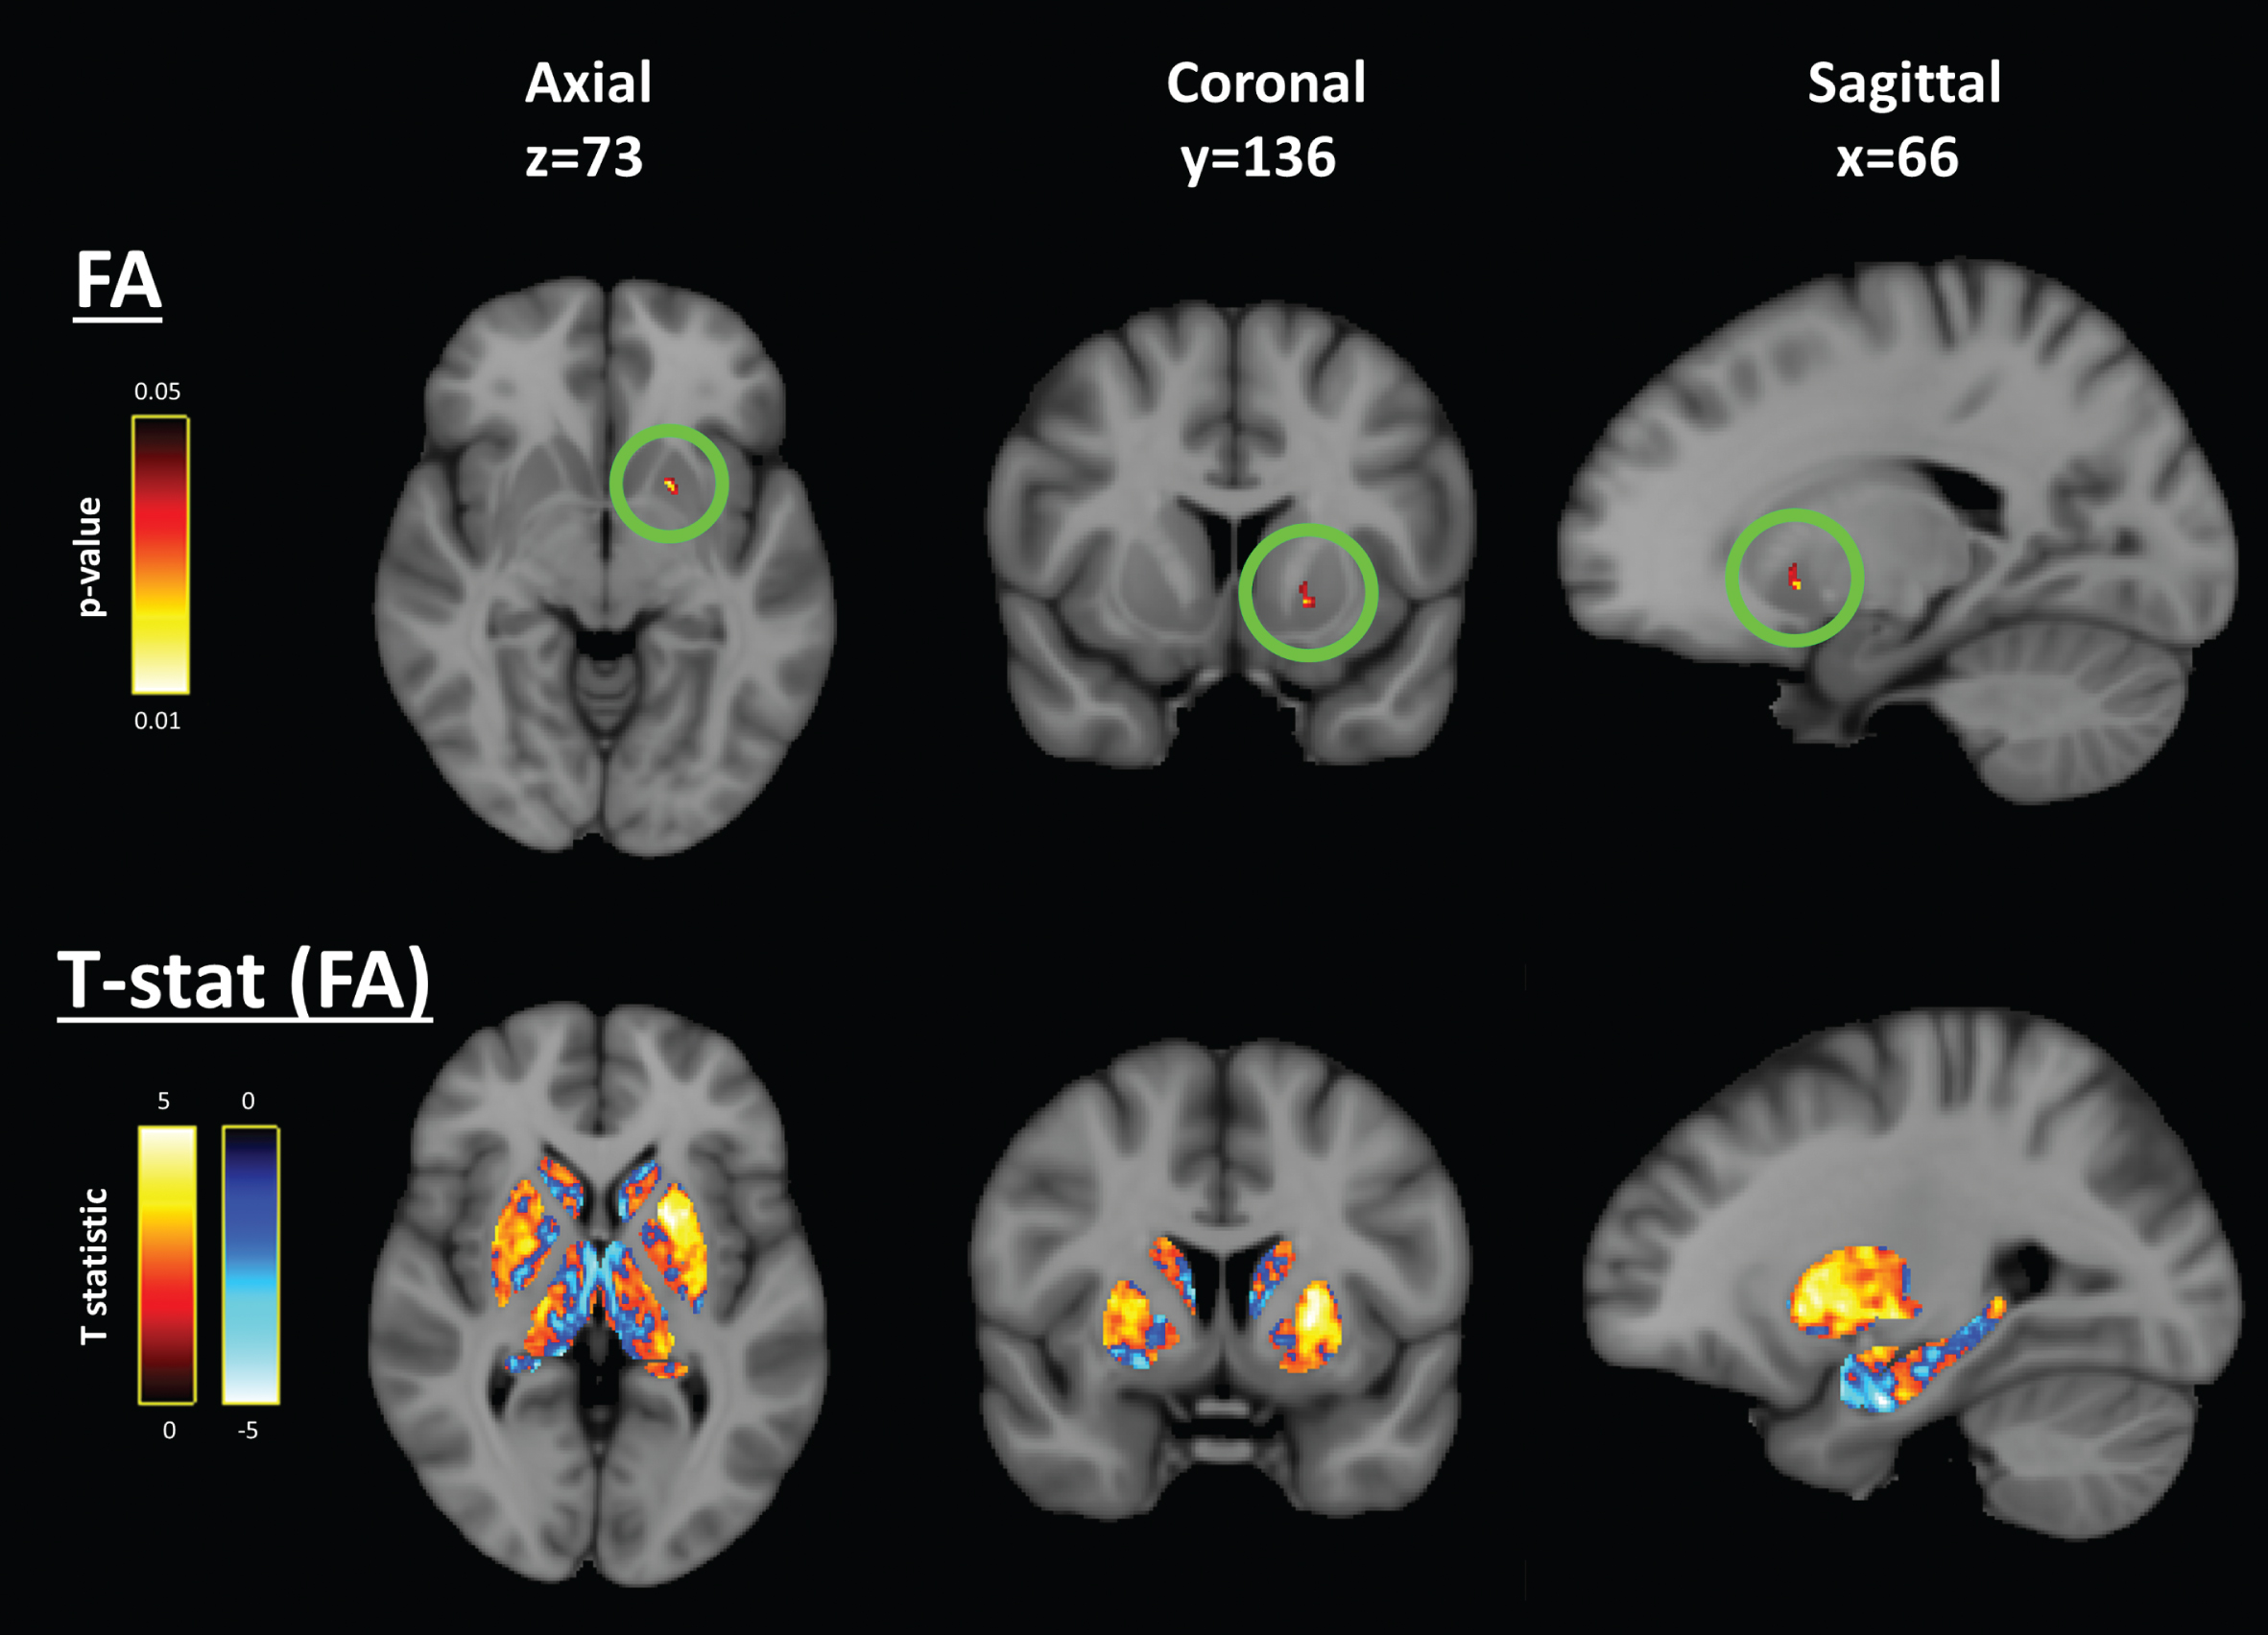
Voxelwise association of neurofilament light (NfL) and diffusion MRI – left putamen cluster. Voxelwise analyses of fractional anisotropy (FA) and mean diffusivity (MD) in the subcortical nuclei revealed a left rostral putamen region with a small significant cluster (circled in green) with positive association to NfL belonging to possible sub-threshold pattern of positive association in the whole left rostral putamen and, to a lesser extent, the right rostral putamen. Data are overlaid on the 1 mm MNI152 average brain template. Slice numbers are given in reference to the MNI152 template image. Blue indicates negative association and red indicates positive association.
Statistics for significant clusters in the voxelwise analyses
Only information for the peak voxel in significant clusters with > 10 voxels are shown. Coordinates are shown according to the MNI152 standard brain. WM, white matter; R/L, right/left; NfL, Neurofilament light; FA, Fractional anisotropy; MD, Mean diffusivity; MMSE, Mini-Mental State Examination; FEW, family-wise error rate.
Frontal/internal capsule cluster. The first region comprised several separate but closely-related clusters covering most of the frontal lobe white matter tracts in both hemispheres and the whole internal capsule in the right hemisphere (Fig. 1). In all of these clusters, we found significant associations with NfL: both for FA (inverse association) and MD (positive association). The largest of these clusters for FA included the frontal lobe white matter bilaterally (peak voxel: t = –4.90, p = 0.03, volume = 10780 mm3, Table 2). The main cluster for MD included the right hemisphere frontal white matter tracts and internal capsule (peak voxel: t = 4.84, p = 0.04 volume = 7233 mm3, Table 2). Within these significant clusters, the AD was not associated with NfL but, for RD, we found that most of the frontal clusters, especially the genu of the corpus callosum, were significantly positively associated with NfL (peak voxel: t = 4.54, p = 0.03 volume = 2875 mm3, Supplementary Material), demonstrating that the FA and MD associations in white matter were driven primarily by changes in the RD, and not by the AD. Inspection of the t-statistic maps suggested wider inverse association of FA and positive association of MD in the white matter in a symmetric pattern (Fig. 1).
Left putamen cluster. The second region was a small cluster in the rostral putamen of the left hemisphere (Fig. 2). In this cluster, FA was positively associated with NfL (peak voxel: t = 5.07, p = 0.03, volume = 21 mm3, Table 2) and MD was not different. Voxelwise tests for AD and RD within this significant region indicated that the FA-NfL association was driven mostly by the positive significant association of NfL with AD (peak voxel: t = 4.80, p = 0.09) rather than RD (peak voxel: t = –1.66, p = 0.46). Inspection of the distribution in the t-statistic map suggested that this significant cluster was part of a wider symmetrical pattern in the association of FA with NfL, with inverse associations in the globus pallidus (t = –3.0) and thalamus (t = –4.2), and positive associations in the rostral putamen, all bilaterally (Fig. 2).
Differences between PD and controls in association of NfL and FA/MD
The voxelwise tests for the interaction effect of NfL and group (PD vs. controls) on FA/MD revealed that the entire cluster of the left rostral putamen, as identified above, was significant. For this cluster, the slope of FA-NfL association in the PD group was significantly greater than that of the control group (peak voxel: t = 4.84, p = 0.02, volume = 501 mm3, Table 2). Again, the unthresholded t-statistic map revealed a whole left putamen region with greater association in PD than controls and, to a lesser extent, the right putamen. This was also reflected in the RD metric, which was significant in all included voxels (peak voxel: t = –3.28, p = 0.01, volume = 554 mm3, Supplementary Material). There was no significant group interaction effect within the frontal white matter clusters.
Relationships to motor and cognitive performance
Given the lateralization of our above findings, we performed post-hoc analysis of NfL and diffusion metrics within the significant clusters against the lateralization of motor symptoms (side of first presentation) in PD patients but found no significant result.
We found that the FA was related to MMSE in the frontal white matter significant region, including genu of the corpus callosum and right internal capsule (largest cluster: peak voxel t = 3.86, p = 0.04, volume = 3862 mm3; Fig. 3, Table 2). In these clusters, FA was positively associated with MMSE score, i.e., more impairment with lower FA. Including an interaction term for group×MMSE did not show any further significant clusters. A scatterplot is shown in Supplementary Material for the correlation in this significant region.
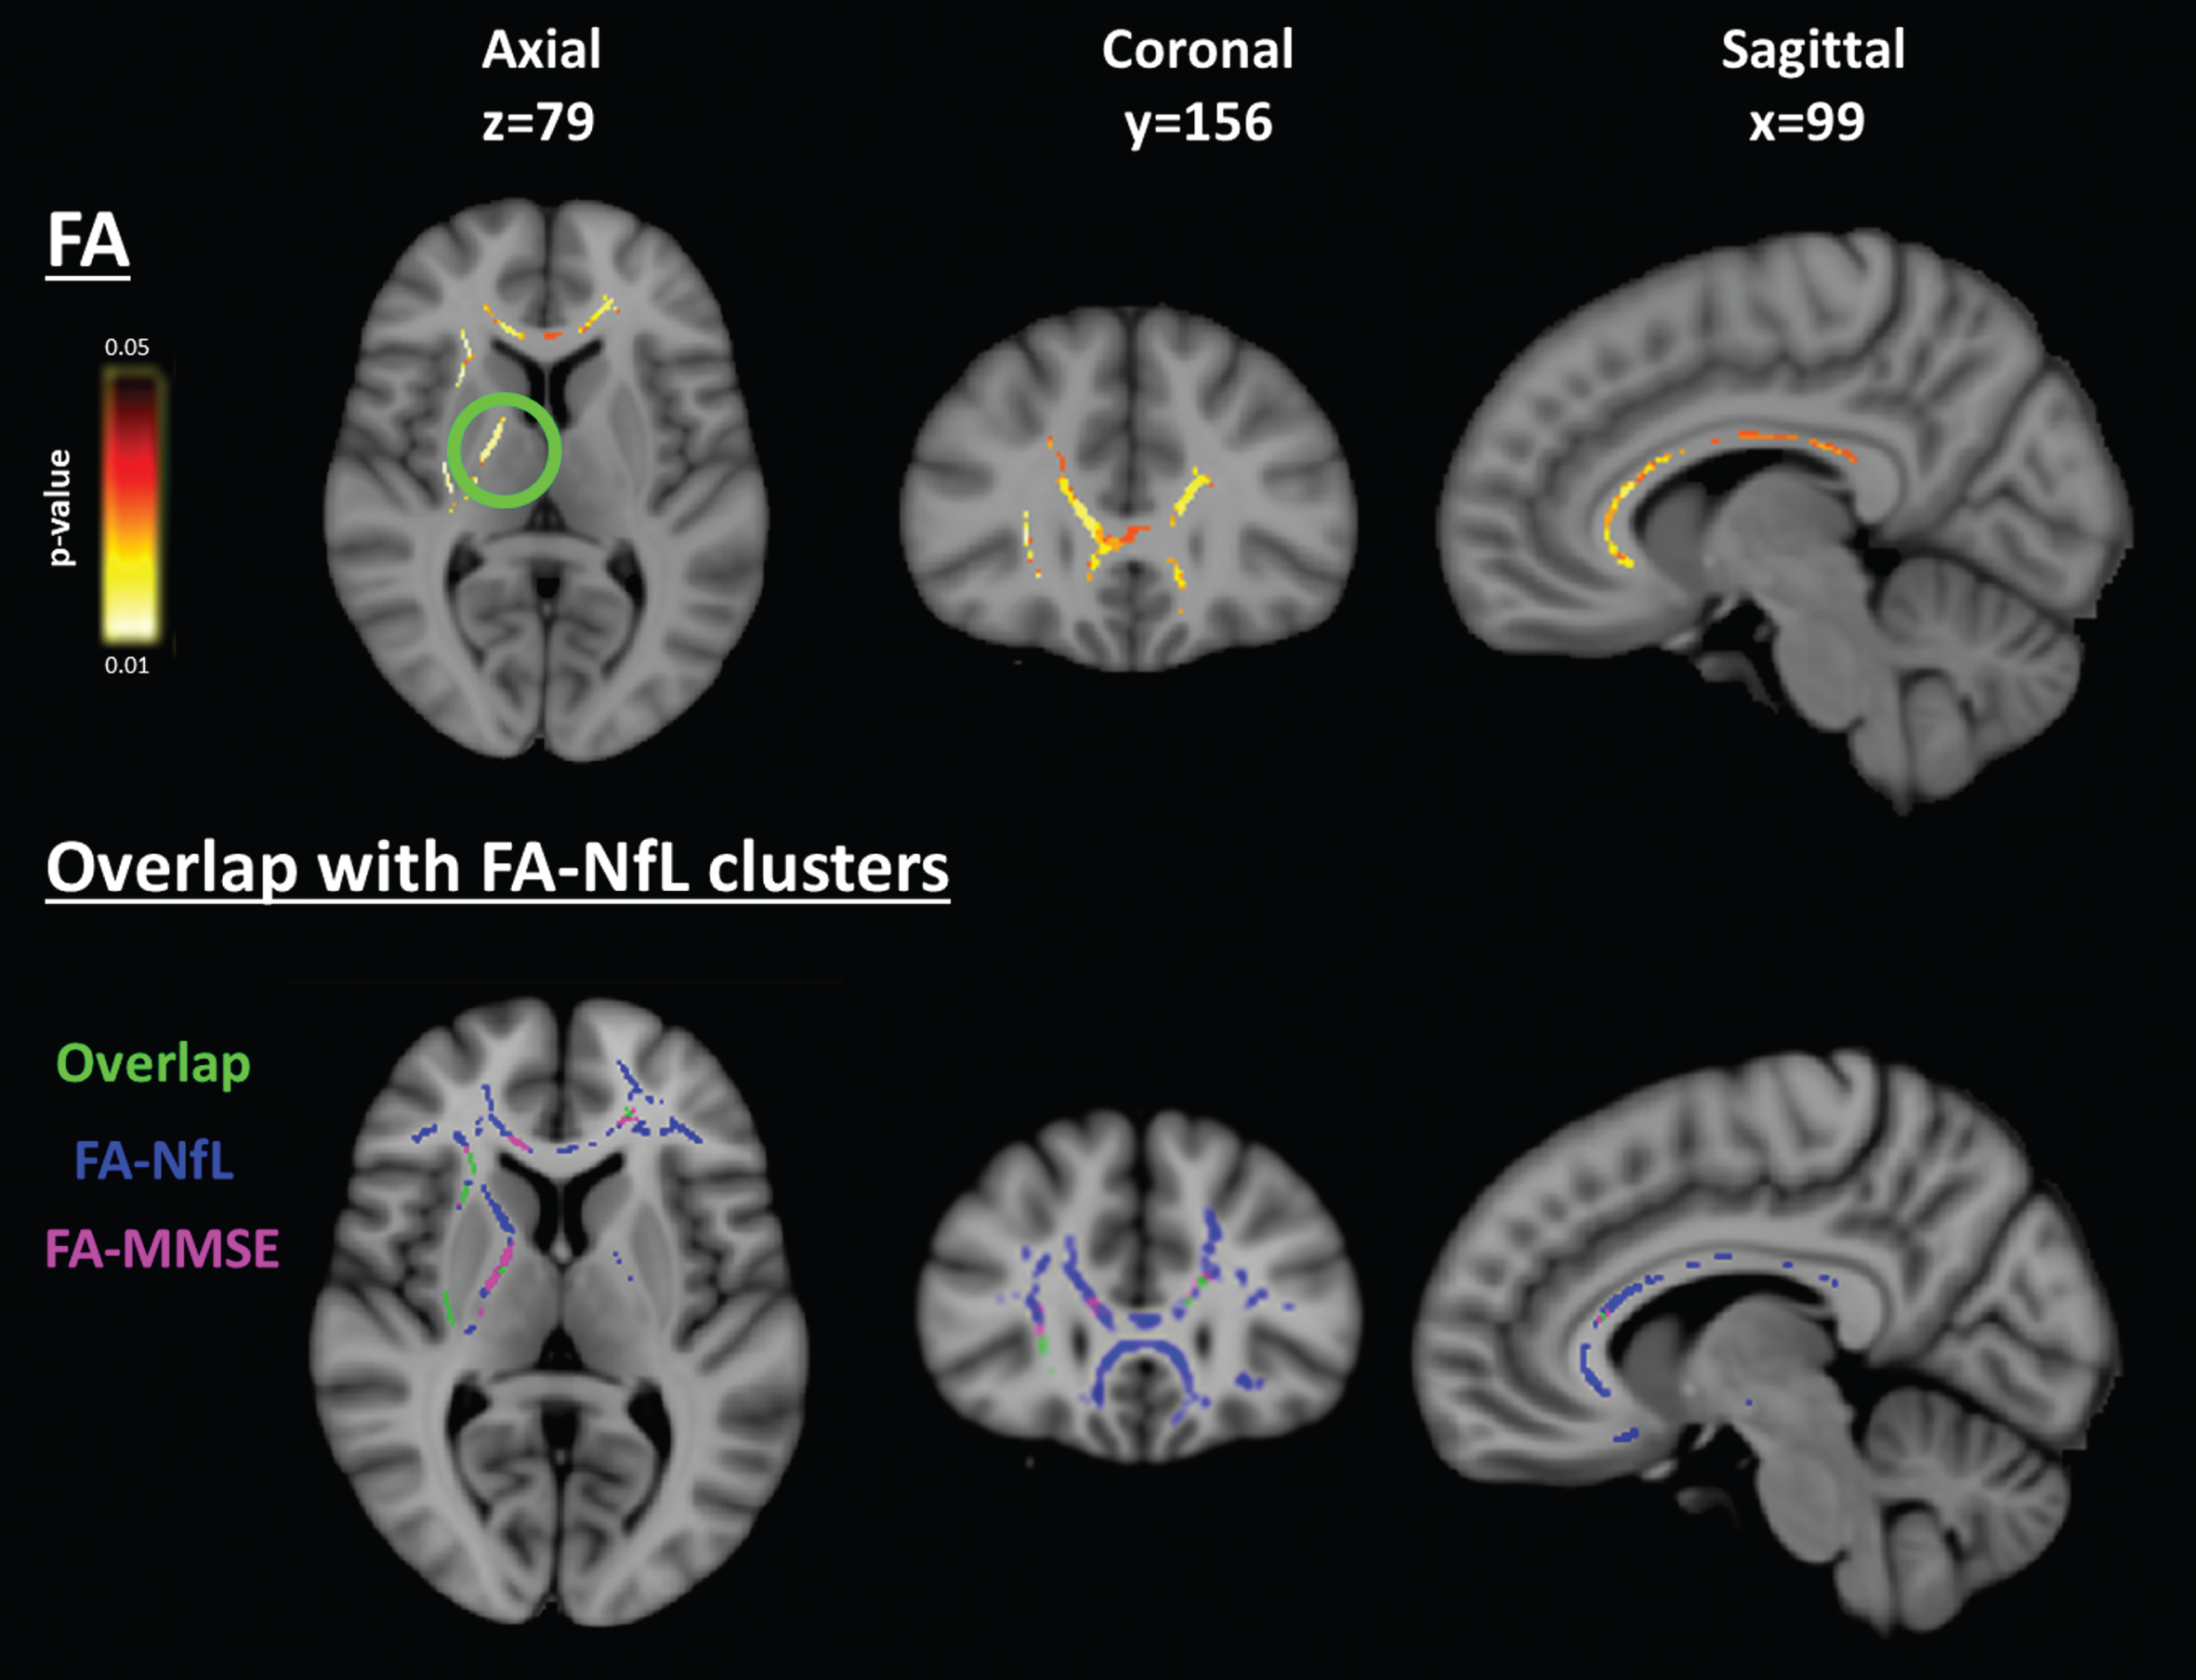
Voxelwise association of FA with cognition in the frontal white matter. (Top row) MMSE was associated with FA in the frontal white matter and right internal capsule (circled). (Bottom row) this corresponded spatially to the clusters from the FA-NfL analysis. Data are overlaid on the 1 mm MNI152 average brain template. Slice numbers are given in reference to the MNI152 template image. Blue indicates negative association and red indicates positive association.
We did not find any significant clusters for MDS-UPDRS-III motor scores.
Finally, linear regression to assess the association of clinical and cognitive measures with NfL outcome in the early PD group while correcting for age, gender, disease duration, mFRS, LEDD and white matter lesion load showed significant associations with the MMSE cognitive score. In the MMSE, poorer cognitive performance was associated with higher NfL concentrations (unstandardized β=–0.032, 95% CI = [–0.059, –0.003], p = 0.045). For the MDS-UPDRS-III, there was no significant association.
DISCUSSION
Measuring the association of plasma NfL with acknowledged imaging markers of white matter integrity in early PD is critical to support a possible future clinical role as an accessible biomarker for early neurodegeneration. Our data suggested significant lateralized changes of both decreased FA and increased MD in the frontal white matter associated with increased NfL in patients with early PD. We showed that the same regions relate to global cognitive performance in our sample. We also found a significant association between plasma NfL and FA in the left putamen, with this region having a significant group interaction that was stronger in PD than controls. Ours is the first study to suggest a spatial pattern of NfL-associated neurodegeneration with relevance for global cognitive function in early PD.
Our primary hypothesis, that plasma NfL would be more strongly associated with both decreased FA and increased MD in the white matter in PD compared to controls, was supported by our findings. We find these associations between FA/MD and NfL specifically in the frontal white matter tracts and right internal capsule. The combination of reduced FA and increased MD suggests that greater losses of microstructural integrity in this region may relate to higher levels of NfL in the blood in early PD. NfL is mainly shed from large caliber axons and is not found in high concentrations in grey matter. Thus, associations of NfL and FA/MD are expected to be more meaningful in the major white matter tracts than in regions with predominantly short association fibers or grey matter components. In white matter, neurodegeneration is typically associated with reduced FA and increased MD, and so the same associations should be present with NfL.
While we are not aware of other studies testing this relationship in early PD, studies in other diseases or using CSF NfL are in accordance with this result. For example, one study investigated whether CSF NfL was related to FA in a smaller sample of more advanced PD [24]; consistent with our findings, the authors showed that higher CSF NfL was related to reduced FA in multiple clusters spread across the brain. This relationship has been observed previously using CSF NfL measurements in several diseases [25–27]. Far fewer studies have measured this effect using NfL from the blood, but these studies in other diseases have also shown a negative association with FA, for example in frontotemporal dementia [28], Alzheimer’s disease [29], and multiple sclerosis [30]. Here, we further characterized the microstructural changes in greater detail using the AD and RD metrics, showing that these changes were likely driven by increased RD, rather than AD, which indicates reduced axonal density. These frontal tracts have known roles in higher cognition and attention/executive function [31], which are affected even in early PD [32]. Frontal tract degeneration is an acknowledged neuroanatomical substrate of cognition in PD [33]. We found that microstructural changes in the same regions were associated with cognitive performance on the MMSE, and that the MMSE was associated with NfL. Together, this suggests that frontal neurodegeneration relevant for cognitive performance even in early PD is reflected in increased plasma NfL. However, interpretation of our tests using MMSE should be limited because of the small range and because only 7 subjects had MMSE scores indicating at least mild impairment (MMSE < 24).
The second major finding was of a positive association of FA with NfL in the left rostral putamen. In grey matter, the interpretation of FA is more complex because grey matter does not have an oriented fiber structure, and because FA is influenced by a number of different factors [11]. However, we also found a corresponding positive association in the AD scalar within the same cluster. This association in the putamen was found to be significantly greater in the PD group than controls (group interaction effect). Post-hoc analysis of lateralization of motor symptoms was negative, however, and the unthresholded statistical maps concurred by showing symmetric sub-threshold changes. The non-significant lateralization finding, together with the symmetrical pattern shown in the t-statistic maps (Fig. 2), support the idea that there may be a symmetrical effect which did not reach significance in the right side only. Alternatively, there may be a true lateralized effect, whereby blood NfL is only associated with tissue microstructure in the left putamen, although the lateralization of basal ganglia in the context of PD is not well supported. It has been proposed that FA in grey matter is more a measure of cytoarchitecture than axonal microstructure [34], and studies do suggest associations of subcortical grey matter abnormalities and NfL in other neurodegenerative diseases [35]. Increased FA of grey matter and subcortical nuclei has been reported in other diseases, where it has been attributed to proliferation of glial fibrillary acidic proteins with corresponding increase in AD [36] or, with microglial activation, the bipolar orientation acquired by loose dendrites [37].
One limitation of this study was that our cohort comprised only patients with early PD and so our results may not be generalizable beyond this group. On the other hand, our findings are concordant with those from a study in more advanced PD, using CSF NfL [24]. Secondly, given our significant findings in the frontal lobe, we acknowledge that the MoCA [38] or other cognitive tests focused on the frontal lobe would be better suited to robustly detect associations between cognition and FA in this region, and would be preferable to the MMSE. Third, FA is a non-specific measure of white matter structure and DTI is not an accurate model in regions of crossing fibers, thus we may have not detected associations in these regions that could be detected using more advanced models of diffusion. Our diffusion protocol used relatively large non-isotropic voxels which confers benefits in terms of signal-to-noise ratio but does reduce our ability to detect small but significant regions. Diffusion sequences with greater angular and spatial resolution may confer the greater sensitivity required for a personalized approach [39, 40]. Other strengths of our study include the sample size, the rigorous controlling of cardiovascular and white matter lesion load, early disease stage and spatially-unbiased voxelwise approach.
Finally, we did not detect a significant difference between PD and control groups in NfL alone, despite an earlier positive finding in the same but smaller cohort [5]. This may be due to the early disease stage, with minimal expected long tract damage. This is corroborated by other studies in early-stage PD, which increasingly support a progression- and severity-tracking, rather than early diagnostic role for blood NfL [8, 41]. Nonetheless, these findings should be interpreted with caution because several of our above explanations are based on the assumption of an underlying group difference NfL effect.
Further studies should be performed to attempt to validate plasma NfL with DTI indices as biomarkers for neurodegeneration in prodromal or advanced PD, and use machine learning approaches to integrate data across biological scales [42]. As this is a cross-sectional study, we plan to validate these important findings with additional longitudinal clinical, biomarker and DTI data from this on-going PD study.
Conclusion
Overall, we found that, in early PD, plasma NfL may be associated with brain microstructural changes reflecting neurodegeneration in the left putamen and frontal white matter, as measured using diffusion tensor imaging. We also found evidence that these associations may be greater in PD compared to healthy controls and may be related to poorer global cognitive performance. These novel findings support a possible future role for plasma NfL as an accessible, quantitative, and direct biomarker for neurodegeneration in the early stages of PD, and provide a vital opportunity for analyses of prospective data to confirm their future clinical implications.
Footnotes
ACKNOWLEDGMENTS
We would like to thank all participants and their families for their support of the PALS study, and also neurologists from the National Neuroscience Institute, Singapore for referring their patients for the study.
This study was supported by the Singapore Ministry of Health’s National Medical Research Council (NMRC) under its Open Fund Large Collaborative Grant (MOH-OFLCG18May-0002). TW is supported by an NMRC Young Individual Research Grant (OFYIRG20Nov-0032). ASLN is supported by an NMRC Transition Award (MOH-TA18may-0003). TEK is supported by an NMRC STaR award. CLL is supported by an NMRC CSA award.
CONFLICT OF INTEREST
The authors have no conflicts of interest to report.