
Abstract
Background:
The analysis of volatile organic compounds (VOCs) collected in breath samples has the potential to be a rapid, non-invasive test to aid in the clinical diagnosis and tracking of chronic conditions such as Parkinson’s disease (PD).
Objective:
To assess the feasibility and utility of breath sample analysis done, both at point of collection in clinic and when sent away to be analyzed remotely, to diagnose, stratify and monitor disease course in a moderately large cohort of patients with PD.
Methods:
Breath samples were collected from 177 people with PD and 37 healthy matched control individuals followed over time. Standard clinical data (MDS-UPDRS & cognitive assessments) from the PD patients were collected at the same time as the breath sample was taken, these measures were then correlated with the breath test analysis of exhaled VOCs.
Results:
The breath test was able to distinguish patients with PD from healthy control participants and correlated with disease stage. The off-line system (remote analysis) gave good results with overall classification accuracies across a range of clinical measures of between 73.6% to 95.6%. The on-line (in clinic) system showed comparable results but with lower levels of correlation, varying between 33.5% to 82.4%. Chemical analysis identified 29 potential molecules that were different and which may relate to pathogenic pathways in PD.
Conclusion:
Breath analysis shows potential for PD diagnostics and monitoring. Both off-line and on-line sensor systems were easy to do and provided comparable results which will enable this technique to be easily adopted in clinic if larger studies confirm our findings.
Keywords
INTRODUCTION
As significant progress is being made in understanding the potential biological mechanisms underlying Parkinson’s disease (PD), improvements in the clinical diagnosis, stratification, and long-term monitoring of the condition remain key areas requiring further investigation [1]. These issues have become more pertinent with the increasing number of clinical trials looking at putative disease modifying treatments. Furthermore, many longitudinal studies have also now demonstrated significant heterogeneity in the rates of disease progression and clinical features within PD cohorts [2, 3]. So as efforts are made to move towards more personalized and targeted therapies for PD [4, 5], there is an urgent need for better methods of diagnosing, assessing and monitoring the condition in individuals with PD.
Extensive collaborative efforts are currently underway to identify biomarkers that can enable this [6, 7]. Many of these investigations, however, involve invasive approaches (such as lumbar puncture analysis of cerebrospinal fluid), which do not provide immediate in-clinic feedback and often involving specialist lab-based analysis and/or approaches that are expensive and uncomfortable for patients (e.g., MRI or PET imaging). As such, any novel biomarker method of assessing patients with PD which involves rapid, easy-to-use, and non-invasive methods would have obvious advantages. One such approach could be through analyzing the breath of patients with this condition.
In this respect, the analysis of volatile organic compounds (VOCs) in the breath has resulted in the development of technology that could be utilized in the identification, screening and longitudinal monitoring of chronic diseases [8, 9], like PD [10]. This method has been successfully tested pre-clinically in both neurotoxin-based models of PD [11, 12] as well as transgenic PD models [13]. In addition, in some small clinical studies, breath analysis has demonstrated that this technology can differentiate not only between idiopathic PD and healthy controls, but also between PD and other Parkinsonian syndromes [14] as well as Alzheimer’s disease [15] regardless of medication.
In this present study, we sought to extend these findings by studying a large, well-characterized clinical cohort of PD patients to determine whether the analysis of VOCs in breath samples could be used to: 1) confirm its diagnostic utility including feasibility; 2) stage the disease; and/or 3) provide new or confirm established mechanistic insights into this condition.
MATERIALS AND METHODS
Participants
Patients were recruited from the PD research clinic at John van Geest Centre for Brain Repair, University of Cambridge, UK. Informed, written consent was taken from all participants following ethical approval of the study (REC 15/EE/0393). This study was performed in accordance with the ethical standards established in the 1964 Declaration of Helsinki and its later amendments. Idiopathic PD was diagnosed by a movement disorder specialist and fulfilled Queen’s Square Brain Bank criteria. All patients were assessed using the MDS-Unified PD Rating Scale (UPDRS), the National Adult Reading Test (NART) [16] was used to establish their premorbid IQ, and their cognitive function was measured using the Addenbrooke’s Cognitive Examination – Revised (ACE-R) [17]; which includes a form of the Mini-Mental State Examination (MMSE). The Beck Depression Inventory (BDI) was used to assess levels of depression [18]. Data on their anti-PD medication was collected along with family history of PD, date of birth, handedness, sex, age of termination of education, history of smoking (current, ex-smoker or never), approximate date of PD symptom onset, and date of diagnosis. Participants were invited back to provide additional breath samples every 3–6 months. Control subjects were recruited from partners of participants and volunteers. The study was undertaken over a 2.5-year period.
Breath collection
The breath collection process was divided into two parts: an off-line method (TD-nose), in which the breath was collected in bags in clinic and then transferred to Tenax TA tubes (ORBO-402, Supelco), two bags to each tube, and sent to the Technion for further analysis; and an on-line method (NaNose), in which patients exhaled directly in clinic into the artificial intelligence nanoarray specially designed in the Technion laboratories with the sample analyzed at site at that time. Four bags of breath sample were collected for the off-line method during each visit, and participants were also asked to exhale into the on-line nanoarray device four times. For the off-line method, participants were asked to breathe filtered air for 3 minutes before providing their four samples. A 30-second, pump-assisted room sample was collected during each session to control for background confounds.
Sensor arrays determinations
Off-line system (TD-Nose)
Compounds trapped on the Tenax tubes were thermally released (250°C/10 min) in an auto-sampler thermal desorption system (TD20; Shimadzu Corporation, Japan) before they were temporarily stored in a stainless-steel VICI sample loop (Valco Instruments Co. Inc.) at 150°C. The sample was then injected into an exposure cell containing an array of 40 cross-reactive chemo-resistor sensors based on gold nanoparticles (GNP) or single walled carbon nanotubes (CNT) functionalized with different organic chemical ligands, the remaining volume was filled with N2 (99.999%) at atmospheric pressure [19]. A Keithley data logger device (model 2701 DMM) was used to sequentially acquire resistance readings from the nanoarray (5 min vacuum, 5 min sample, 5 min vacuum). Interaction between the films of the modified particles and the VOCs results in a time-dependent and reversible change in resistance of the sensor [19–21], and this is what was therefore captured. A custom-built LabView program controlled the whole system. Ten features were extracted per sensor: the normalized resistance change after exposure to the breath samples at the start of the peak response, at the end of the response and at seven time points in between (1/5,1/4, 2/5, 1/2, 3/5, 3/4, 4/5) along with the area under the response curve. By comparing these ten features for different sensors, unique models were established for the classification of the groups. Each sensor showed a characteristic response to all (or to a certain subset) of the VOCs found in the exhaled breath samples. To check the sensor’s operational efficiency during the experiment and to overcome drift in the sensors’ response, a fixed calibration gas mixture, containing 11.5 ppm isopropyl alcohol, 2.8 ppm trimethylbenzene, and 0.6 ppm 2-ethylhexanol, was exposed to the sensors on a daily basis. The raw signals from the breath sample response were normalized by their parallel response to the calibration gas.
Online system (NaNose)
The online system was composed of two types of sensors: chemo-resistors (similar to the off-line system) and silicone nano-wires. For the chemo-resistors, the same features as described above for the off-line system were used. As for the silicon nano-wires sensors, constant gate voltages were chosen.
Gas chromatography mass spectrometry determinations
A second breath sample obtained from each patient was analyzed by gas chromatography connected to mass spectrometry (GC-MS) in order to determine the VOCs’ molecular composition. For this analysis, GC-MS (GCMS-QP2010; Shimadzu Corporation, Japan), combined with a thermal desorption system (TD20; Shimadzu Corporation, Japan), was used. The following oven temperature profile was set: (a) 10 min at 35°C; (b) 4°C/min ramp until 150°C; (c) 10°C/min ramp until 300°C; and (d) 20 min at 300 °C. An SLB-5ms capillary column (Sigma Aldrich Ltd.) with 5% phenyl methyl siloxane (30 m length, 0.25 mm internal diameter, and 0.5μm thickness) was employed. The splitless injection mode was used for 2 min, at 30 cm/s constant linear speed and 0.70 mL/min column flow. Desorption was done by heating the TD tubes for 5 min at 270°C under 60 ml/min flow and trapping them on a Tenax cold trap at 0°C. The samples were injected into the GC-system in the direct (splitless) mode at a constant 3 ml/min total flow. The GC-MS chromatograms were analyzed using Mass Hunter unknown analysis followed by MS Quantitative analysis (version B.08.00 Agilent Technologies, USA). The compounds were tentatively identified through spectral library match NISTL.14 (National Institute of Standards and Technology, USA). Qualitative analysis involved the area under the curve values; relevant room sample controls values were analyzed to address environmental changes (collected during the same experimental conditions).
Statistical analysis
Quadratic discriminant factor analysis (DFA) with cross validation of leave one out was used to identify PD specific patterns through computerized analysis of the collective response of the sensor array and automatic choice of the most suitable set of sensing features. This classifier fits a Gaussian distribution to each class while not assuming identical covariance for both groups thus creating a quadratic decision boundary. In a two-group classification case, the discrimination is obtained through the first canonical variable (CV1). The classification success rate was estimated through leave-one-out cross validation. All possibilities of leaving out one samples were tested and the left-out sample was classified as true positive (TP), true negative (TN), false positive (FP), or false negative (FN), using a standard cluster analysis. Significant differences between other test determinations were obtained by t-tests. In the off-line measurements the control group number of samples was substantially less compared to the patient group (21 samples analyzed out of 37). Therefore in order to prevent statistical bias of the classifier due to these unbalanced numbers an oversampling approach was applied that synthetically duplicates the minority class samples [22, 23]. Thus, the control data was consequently multiplied three times (and by so doing gender and other relevant ratios were kept to avoid creating new confounds) to give a 63 control data set that was used to build the predicting classifier, after which it was evaluated by cross validation analysis. For the GC-MS, Student T-Tests and/or Tukey-Kramer HSD tests were used to determine statistical differences of the VOCs’ abundance between the PD groups. Multiple testing correction was undertaken using the Benjamini and Hochberg false discovery rate (FDR) method [24] for intergroup comparison of the VOCs (FDR online calculator, Carbocation Corporation). Statistical analysis was performed using JMP Pro15.0.0 (SAS Institute Inc., USA).
RESULTS
The main objective was to assess the feasibility and ability of breath sample analysis to diagnose and track a moderately large cohort of patients with PD over time. To that end, over 1,100 off-line and 900 on-line breath samples collected from 177 patients with PD and 37 healthy controls were evaluated (Table 1). Due to time constraints in the clinic, it was not always possible to collect all of the on-line samples but this clearly shows that the use of this technique in the clinic setting is feasible.
Test population data
NA, not available.
Patient demographics
The PD cohort and control subjects were well matched in terms of age although the majority of the control subjects were female, while males made up the bulk of the PD group. Almost 1/3 (29%) of the participants provided breath samples from two different sessions (and 8% provided samples over 3 or more follow up sessions).
The ability of the breath test to diagnose PD
The breath collection sampling was done using two strategies— an off-line and on-line/in clinic approach— and we compared these two different approaches.
Initial evaluation of the patients vs. controls was done based on the off-line measurements of the breath using the electronic nose. Classification among the two groups resulted in good separation (Fig. 1) with an accuracy of 76% and a sensitivity of 77% and a specificity of 73% based on the DFA cross validation analysis. The positive predictive value was 87% and the negative predictive value 57%. The area under the curve (AUC) of the receiver operating characteristic (ROC) analysis was 78% (Fig. 1b). Given the differing ratios of male/female between the PD and control groups (Table 1), we sought to exclude the confounding effect of sex on the model classification, by evaluating it based on the sex data. We found that there was minimal effect of sex on the model supporting our original classifier model (Supplementary Figure 1). Similarly, we also evaluated treatment effects by comparing treated∖not-treated with Levodopa patients and found this did not influence the classification of PD vs. control as reflected by t-tests of the canonical output (see Supplementary Figure 2). The within-stability responses of three sensors used on patients with more than one sample at different time points, showed a mean standard error average of 5.38%, 10.7%, and 5.94%.
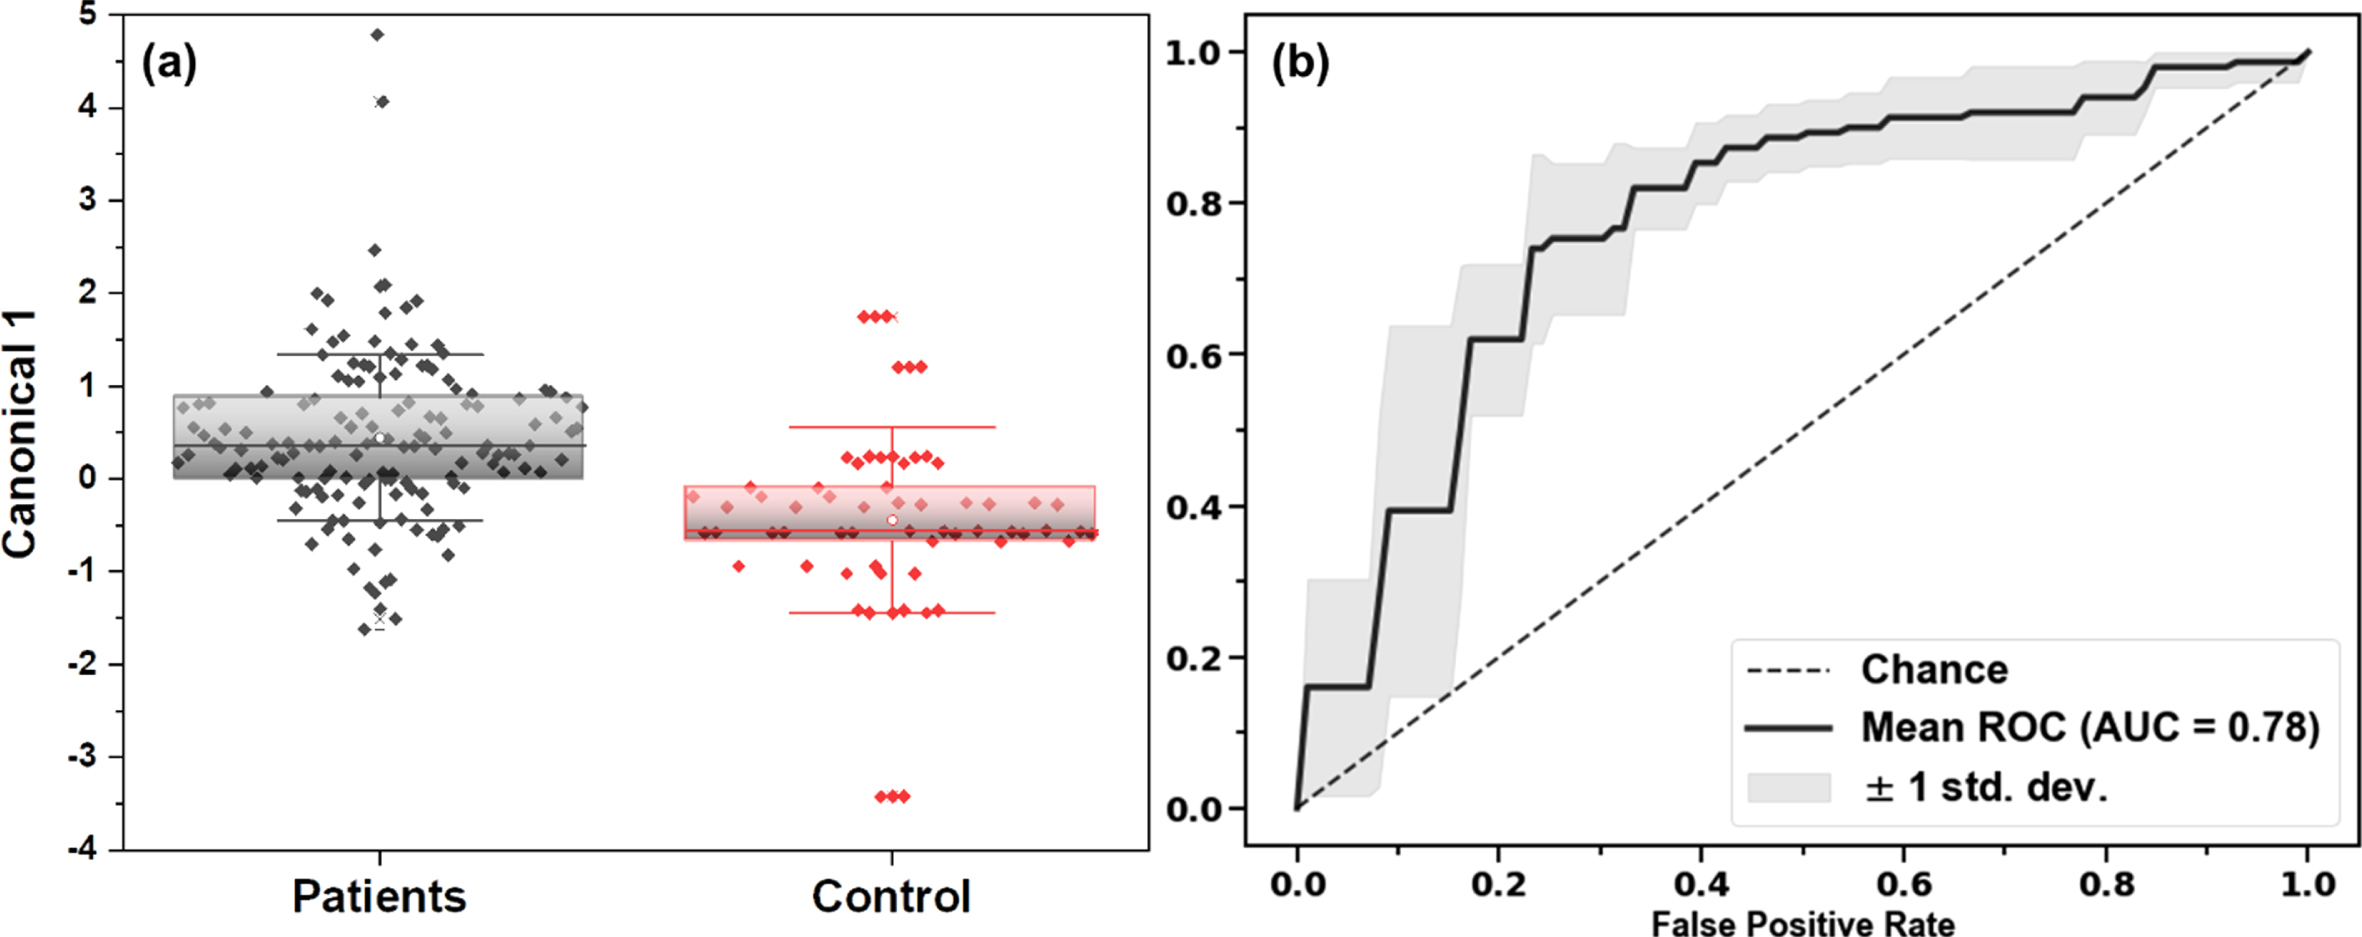
Data classification of the clinical cohort based on leave-one-out cross validation DFA of the sensor array results. (a) Box plots on the first canonical score of the data for Patients vs. Controls. (b) ROC analysis of the data set, including the AUC.
Further correlative changes in the breath test with disease duration and key disease milestones were also evaluated. The analysis examined the changes in breath signature as a function of: 1) Disease duration: more/less than 6 years; 2) Cognitive function using the Addenbrooke’s Cognitive Examination (ACE) score total: more/less than 90 points; and 3) Hoehn & Yahr stage of disease: (three subgroups: 0–1, 2, & 3–5).
For the last comparison, a binary model was done for each of the two sub-groups. Some data was not available for all participants and thus the number of samples varies for some analyses. Additional confounding factors were also evaluated: Gender, Smoking, Patient age at PD diagnosis.
The results achieved for the above variables within the PD group are summarized in Tables 2 and 3, for both off-line and on-line sampling (respectively).
TD-Nose; off-line sampling binary classification results. Last three rows represent possible confounding factors classification
† ACE 1 < = 89, ACE 2 > = 90; ‡ More/less than 6 years; § Three subgroups analyzed: 1 = H&Y scores 0–1, 2 = H&Y score 2, and 3 = H&Y scores 3–5.
NaNose online sampling binary classification results. Last three rows represent possible confounding factors classification
† ACE 1 < = 89, ACE 2 > = 90; ‡ More/less than 6 years; § Three subgroups analysed: 1 = H&Y scores 0–1, 2 = H&Y score 2, and 3 = H&Y scores 3–5.
In the off-line system, overall classification accuracies were good and varied between 76.4% for the lowest to 90.4% for the best classification. Similarly, sensitivity and specificity measures varied between 68.2% to 83% and 77% to 94.7% respectively. With regards to possible confounding factors, gender and smoking accuracies were found not to influence the classification. However with age, a few categories did show differences, e.g., Hoehn & Yahr (H&Y) group 3, which means the specific sub-groups results around H&Y stage might be influenced by age. A more likely explanation, though, is that it could be attributed to statistical variance due to large differences in the sample numbers in each of these sub-groups given that we only 22 patients with Hoehn & Yahr stage 3 or higher. Additionally, the results showed that those with a disease duration above six years could be distinguished from those with a duration of less than six years with 81.5% accuracy.
The on-line system prototype was used here for the first time in parallel. It provided us with similar trends as the off-line system with a slight increase in the cognitive classification accuracy based on ACE scores (80%) but with lower accuracies for disease duration difference (66.3%), H&Y stages (66.7–82.4%), with some sub-categories showing no efficient classification, e.g., gender, age smoking (Table 3).
Specific chemical analysis of VOCs within PD group
During the collection for the off-line system, a second breath tube (comprising of two sample bags) and an additional room air tube were collected for GC-MS analysis. Not all patients had a GC-MS sample or subgroup status, so for the H&Y stage, three subgroups were analyzed: 1 = H&Y scores 0–1 (n = 8), 2 = H&Y score 2 (n = 59), and 3 = H&Y scores 3–5 (n = 14) and for ACE scores, two subgroups were used; ACE1 (n = 19, scores < 89/100) and ACE2 (n = 54, scores > 90/100). After analyzing the environmental room air–breath gradient, room data was subtracted from the breath data. Initial results revealed 29 VOCs with a positive breath gradient in more than 70 percent of the samples and 11 VOCs in more than 85 percent (based on relative abundance of the area under the peak) of the PD cohort. These 11 VOCs were then screened in the database and only those found relevant∖reported in human breath sampling were considered further.
A more detailed analysis of those patients with advanced disease (greater cognitive impairment with lower ACE scores and/or H&Y > 3) revealed a few potential VOCs; propanal, acetone, pentane and isoprene, which showed elevation in the H&Y > 3 group (Fig. 2). However, after performing an FDR correction, only pentane remained statistically different (p < 0.05, Supplementary Table 1).
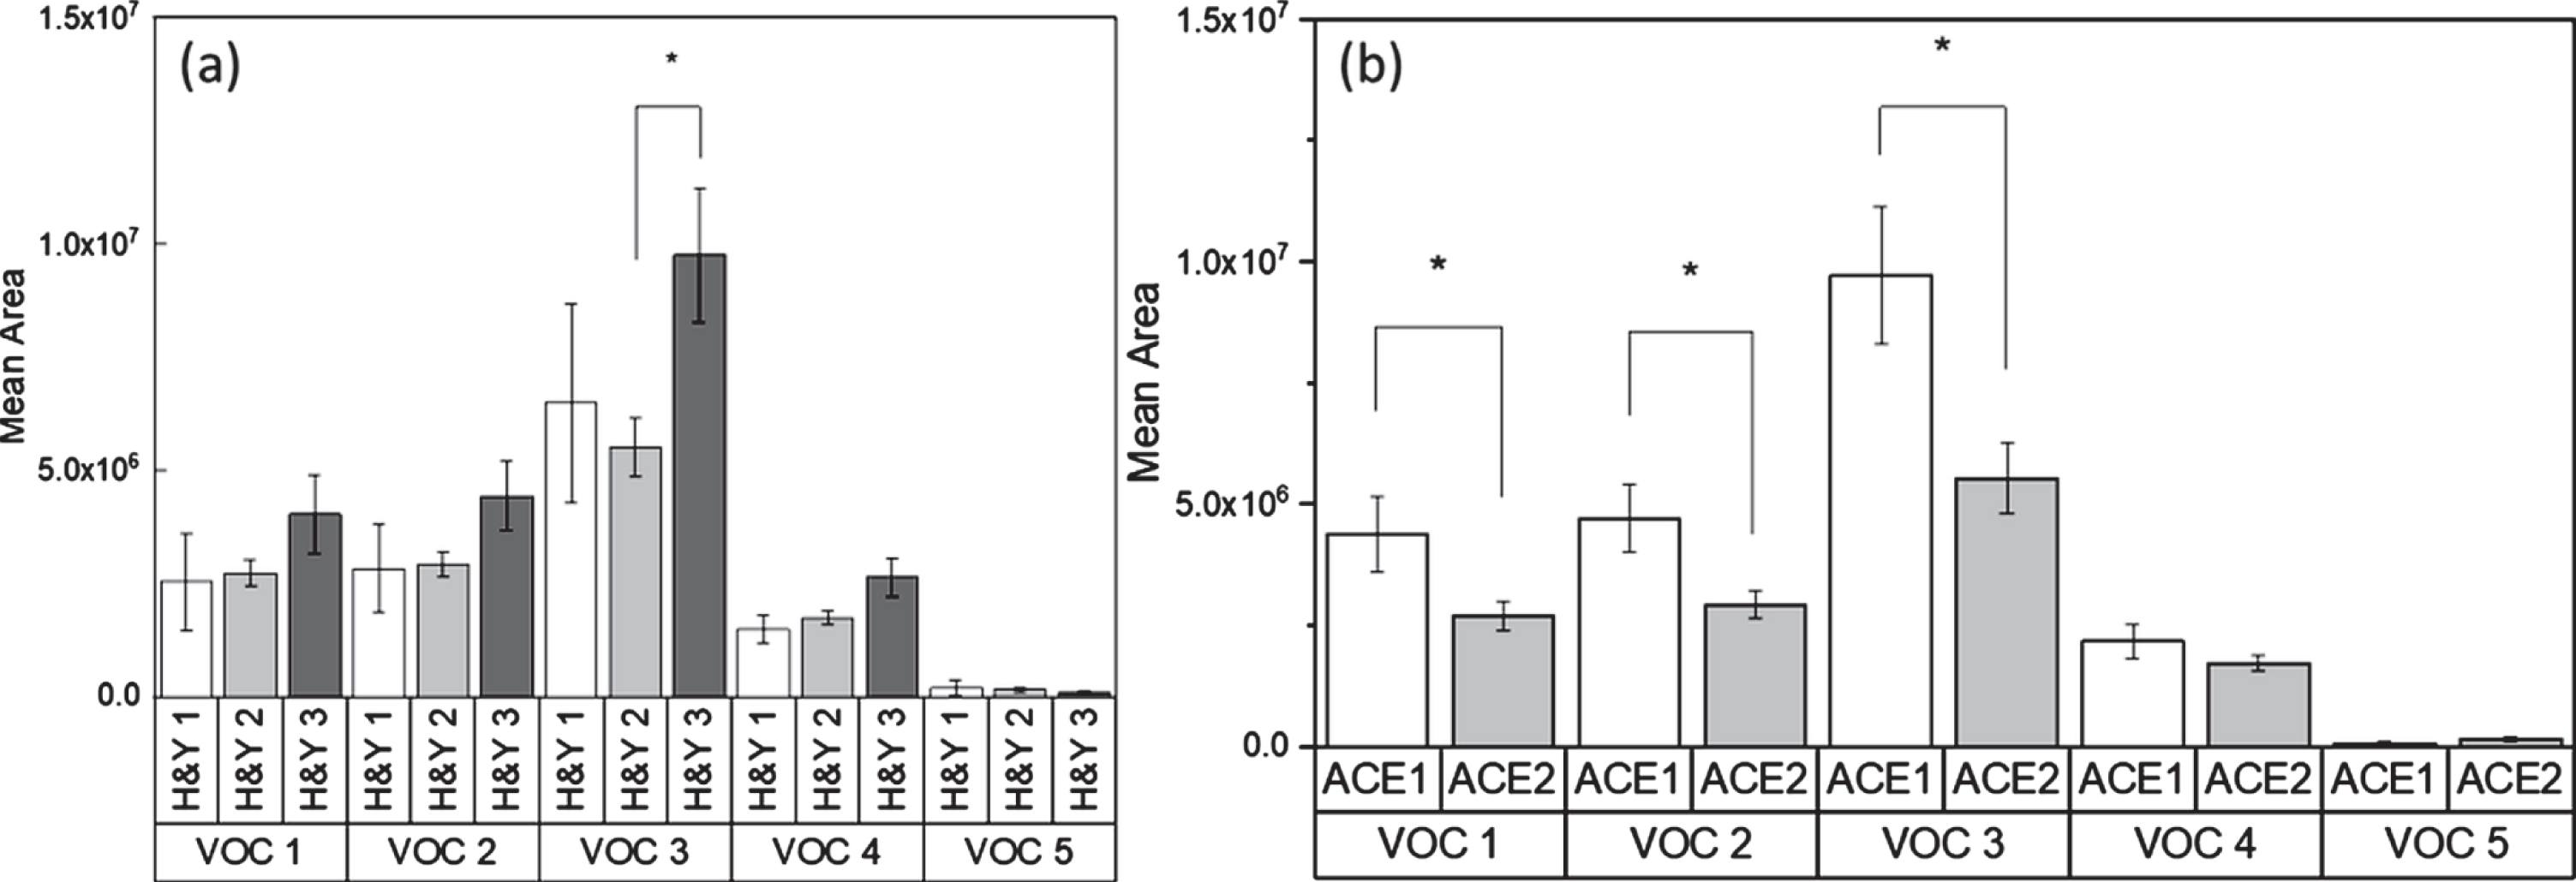
GCMS analysis for specific biomarkers as measured against: (a) Hoehn & Yahr stage; (b) cognitive performance based on ACE scores (ACE 1 < = 89, ACE 2 > = 90). VOC 1: Propanal; VOC 2: Acetone; VOC 3: Pentane; VOC 4 : 1,3-Butadiene, 2-methyl- (Isoprene); VOC 5 : 3-hydroxy-2-Butanone, (Acetoin).
In addition, we found that pentane, propanal, isoprene, and acetone levels were all elevated in the patients with the lower ACE scores. After performing FDR correction, only propanal, acetone, and pentane remained statistically different (p < 0.05, Supplementary Table 2). These products are known to be a byproduct of lipid peroxidation and have independently been shown to be elevated in PD [25–30]. Acetoin (3-hydroxy-2-Butanone) that was previously reported as a potential saliva metabolite-VOC in PD and linked to disease duration[31], was also found here, but did not show significant difference nor did it correlate with disease duration.
DISCUSSION
In this study, we sought to investigate the feasibility and validity of a new breath test as a diagnostic aid in a relatively large cohort of patients with PD. This test uses the assessment of VOCs in exhaled breath and compared two different ways of doing this: one, an on-line system used with the patient in clinic, the other relying on collecting samples in clinic and then sending them off to the lab for off-line assessment. We found that breath tests could be easily collected and that either approach enabled us to differentiate patients with PD from age-matched controls but that this was better for the off-line, compared to on-line, tests. However, both approaches showed good sensitivities and specificities. The on-line system in the current study was a preliminary prototype and future models streamlining the process will be needed. In addition, we undertook a preliminary investigation to see whether the VOC signatures so obtained correlated with disease duration, H&Y disease stage, or levels of cognitive impairment using a standard measure of global cognition. This revealed some correlations although this will need to be further evaluated in bigger cohorts followed longitudinally. Finally, we sought, using GC-MS analysis, to better interrogate the signature of differences in VOCs between patients and controls with the hope that it might identify possible pathways of disease which would (a) help validate the biological plausibility of what we had discovered and/or (b) reveal new pathways that may be playing a role in disease pathogenesis. In this respect, we found two VOCs that were linked to the PD cohort— pentane and propanal levels. The significance of these may link to the aggregation of alpha-Synuclein (α-syn) because it is known that this protein is involved in different oxidation processes in the body by interacting with fatty acids [32, 33] which have been shown to be intermediates in the oligomerization of α-syn [34]. While no data on specific VOCs can currently be directly connected to these processes, oxidative stress increases the propensity of α-syn to aggregate and accumulate [35]. Pentane is a known VOC-indicator of oxidative stress and so it is reasonable to assume that higher levels of pentane (as seen here) could be related to oxidative stress secondary to α-syn pathology. As such our approach may be a useful way by which to look at this aspect of PD pathogenesis and/or study therapeutic agents directed to this pathway. Nevertheless, further work is needed to prove this link, with larger sub-populations as well as other potential oxidative stress evaluations.
Of further relevance to our findings is the recent hypothesis that different microbial agents such as bacteria (mainly from the order of Actinomycete) and fungi can contribute to PD initiation [36]. Additionally, it has been suggested that specific microflora in PD patients can result in different secreted odors (such as VOCs) [37]. Here we found that different ketones, specifically, acetoin, were elevated in those PD patients with a low ACE score. In addition acetoin has been described as a VOC metabolic product of Actinobacteria and different molds [38], and was found to be elevated in our PD samples compared to controls, and intriguingly elevated in longer disease duration patients [31] although again how this links to our findings requires further work.
Although the findings reported here validate and extend those seen from earlier smaller studies using this approach, there are a number of limitations with our study. First the sample size is still relatively small, and the longitudinal data is not sufficient to allow any conclusions to be made about how well this test tracks disease course in the long term. Ideally a study starting with de novo patients followed from diagnosis would be ideal. Secondly most patients were in early stage disease with shorter disease durations and normal cognition as measured using the ACE-R, albeit with a spread of scores within the normal range. As such our study would have benefitted from a greater range of patients covering the true spectrum of disease states seen in PD. Thirdly, the ability of this technique to diagnose PD was not compared with other approaches being explored such as imaging or CSF α-syn/tau analysis and as such it cannot be said that this approach offers an advantage over these other approaches, outside the ease with which our samples were collected. Fourthly, the confound of anti-PD drugs on breath profile cannot be totally excluded, but we found no evidence that the taking of Levodopa impacted on our model classifiers, in line with our earlier studies exploring this technique in PD [14]. Finally, the biological significance of the identification of VOCs differentially expressed in PD and in those with lower ACE scores cannot be ascertained given the preliminary nature of the findings and thus all such findings remain speculative in terms of their pathogenic relevance.
CONCLUSIONS
Breath samples from a population of PD patients were collected without major issues via two systems (on-line/in clinic and off-line approaches) and analyzed using two totally different methods. The first used nanomaterial-based sensors to find a unique breath print. The second approach was based on GC-MS analysis looking for the chemical identification of specific potential biomarkers. We found that our sensor system could differentiate between patients and controls and that there were some correlations with disease characteristics such as disease duration, H&Y stage, and measures of global cognition. The off-line system gave the better results, but the more convenient on-line/in clinic system was almost as good. Thus, our study also confirms that individuals with PD have unique volatile signatures in their breath (which does not relate to medication) and that this could be used at their point-of-care as a fast and noninvasive diagnostic aid and monitoring approach. Furthermore, detailed chemical analysis of the samples revealed a number of potential molecules that could be linked to pathogenic pathways already identified in PD, highlighting their biological plausibility which could also have implications for end points used in clinical trials. However, further larger studies following patients over longer time periods, including all relevant control groups, are needed to validate the true utility of this novel easy to use test for PD diagnosis, stratification and tracking of disease course.
Footnotes
ACKNOWLEDGMENTS
The authors thank Molly O’Reilly, Marta Camacho & Lindsey Wilkin for their administrative support of the clinical study. Authors thank Dr Orna Barash for help in data collection and organization.
This study was supported by funding from the BIRAX2, The John Black Charitable Foundation and Parkinson’s UK as well as through an NIHR award (BRC-1215-20014) of a Biomedical Research Centre for Addenbrooke’s Hospital/University of Cambridge. The views expressed are those of the author(s) and not necessarily those of the NIHR or the Department of Health and Social Care.
CONFLICT OF INTEREST
S.S. is employed by the Cure Parkinson’s Trust. Y.Y.B. received funding from the European Commission and Israel Innovation Authority. A.G. and Z.W. have nothing to disclose. R.A.B. has received funding from the MRC, Wellcome, Parkinson’s UK, Cure Parkinson’s Trust, NIHR, ASAP, Michael J Fox Foundation, EU and Rosetrees Trust. He undertakes consultancy work for Novo Nordisk, BlueRock Therapeutics, Aspen Neuroscience and UCB. He receives royalties from Springer Nature and Wiley. H.H. has received funding from the European Commission, Israel Innovation Authority, Israel Ministry of Science & Technology, Israel Ministry of Health, Joy Ventures, and Greenberger fund. He is a member of the advisory board of Nanovation Ltd., FeelIt Ltd. And Nanose Ltd.