
Abstract
Background:
Degeneration of dopaminergic neurons within the brainstem substantia nigra (SN) is both a pathological hallmark of Parkinson’s disease (PD) and a major contributor to symptom expression. Therefore, non-invasive evaluation of the SN is critical for diagnosis and evaluation of disease progression. Hyperechogenicity (HE+) on midbrain transcranial sonography (TCS) supports the clinically established diagnosis of PD. Further, postmortem studies suggest involvement of neuromelanin (NM) loss and iron deposition in nigral neurodegeneration and HE+ emergence. However, the associations between HE+ and signs of nigral NM loss and iron deposition revealed by magnetic resonance imaging (MRI) have not been examined.
Objective:
To elucidate the magnetic resonance- (MR-) morphological representation of the HE+ by NM-weighted (NMI) and susceptibility-weighted MRI (SWI).
Methods:
Thirty-four PD patients and 29 healthy controls (HCs) received TCS followed by NMI and SWI. From MR images, two independent raters manually identified the SN, placed seeds in non-SN midbrain areas, and performed semi-automated SN segmentation with different thresholds based on seed mean values and standard deviations. Masks of the SN were then used to extract mean area, mean signal intensity, maximal signal area, maximum signal (for NMI), and minimum signal (for SWI).
Results:
There were no significant differences in NMI- and SWI-based parameters between patients and HCs, and no significant associations between HE+ extent and NMI- or SWI-based parameters.
Conclusion:
HE+ on TCS appears unrelated to PD pathology revealed by NMI and SWI. Thus, TCS and MRI parameters should be considered complementary, and the pathophysiological correlates of the HE+ require further study.
Keywords
INTRODUCTION
Degeneration of the substantia nigra (SN) is one of the core pathological signs of Parkinson’s disease (PD), a disorder characterized by progressive loss of motor control and eventual cognitive impairment [1, 2]. Loss of neuromelanin (NM)-containing dopaminergic neurons and deposition of iron in the SN are frequently observed in PD and associated with disease progression [3]. Prominent loss of pigmented SN neurons is thus considered a hallmark of PD [4]. Furthermore, NM content in the pre-synaptic terminals of dopaminergic neurons is an emerging candidate neuroimaging-based biomarker for PD [5], although whether increased iron deposition is a cause or effect from the loss of NM-containing neurons is still under debate [6, 7]. Nonetheless, a relationship between increased iron deposition and decreased NM in the SN of PD patients is widely accepted, suggesting that magnetic resonance imaging (MRI) sequences sensitive to NM and iron may be of great clinical value for PD diagnosis, monitoring of disease progression, and treatment evaluation [8].
There is mounting evidence that neurodegeneration associated with PD begins years before the emergence of clinical symptoms [9]. Indeed, by the time of motor symptom onset, about 60% of dopaminergic SN neurons have already degenerated [10–12]. Reliable markers for prodromal changes in PD are thus required for early diagnosis and possible neuroprotective intervention. Transcranial sonography (TCS) is a widely applied bedside test as it allows for the rapid, inexpensive, and reliable depiction of brain structures, including the SN for differential diagnosis of movement disorders [12]. In the majority of patients with PD (∼90%), alterations of the SN manifest as a hyperechogenic midbrain signal (HE+). However, the underlying basis of the HE+ is still debated [13]. Moreover, relationships with other imaging manifestations, such as MRI signals, are also unclear.
Pilot studies have confirmed that a larger HE+ is associated with increased SN iron content [10, 14]. However, ultrasound has demonstrated limitations for identifying PD biomarkers. For instance, measurements often differ among ultrasound devices, and the measurements depend on the skill and experience of the operator to a certain extent [15]. Additionally, other neurodegenerative disorders may be associated with midbrain HE+ [15]. Previous studies have recommended HE+ as a biomarker for disease diagnosis but not for disease progression and monitoring [16, 17]. Furthermore, the causes of this change in ultrasound reflection in PD are not entirely understood due to a lack of in-vivo studies on living patients [10]. Thus, there is an urgent need for further investigation on the histopathological basis of the HE+, including the relationships of HE+ characteristics with nigral NM and iron accumulation. In contrast to TCS, various magnetic resonance- (MR-) based imaging modalities can reveal both structural and functional changes in PD with an ever-improving spatial and temporal resolution for diagnosis and disease monitoring. In this study, two particularly well suited MRI sequences, NM-weighted imaging (NMI), which exploits the iron-binding properties of NM, and susceptibility-weighted imaging (SWI), which takes advantage of the different magnetic susceptibilities of tissues to generate iron-related images with visual contrast, were used to better characterize nigral pathology associated with TCS-derived HE+ [8]. The primary goal of this study is to elucidate the MR-morphological representation of the HE+. In this context, SWI provides an indirect measure of brain iron deposition and NMI a surrogate marker for neuromelanin levels in vivo. Although both measures recapitulate two important histopathological hallmarks of PD-related neurodegeneration only indirectly, they can serve for the longitudinal and non-invasive assessment of patients with neurodegenerative diseases. One of the critical factors for NM dependence is paramagnetic behavior, which confers high signal contrast between the target and surrounding structures, thereby facilitating precise measurements of NM distribution and concentration [18–20]. Alternatively, the resolution of SWI depends on magnetic field inhomogeneities generated by iron, causing changes in the phase maps subsequently processed with the magnitude images and yielding iron-sensitive images from which iron deposition can be quantified [21–23]. Therefore, the combination of NMI and SWI could serve as a useful strategy to assess nigral neurodegeneration and serve as a surrogate marker for the pathophysiological basis of HE+, thereby improving the utility of HE+ as a biomarker for PD [8, 24]. Also, this analysis will help distinguish the primary advantages of TCS and MRI for revealing different aspects of PD pathology, including dopaminergic neuron loss in the SN [25].
MATERIALS AND METHODS
Demographics
Thirty-four PD patients (mean age: 68.2±7.5 years) and 29 age- and sex-matched healthy controls (mean age: 69.9±6.3 years) were enrolled (Fig. 1). PD was diagnosed according to the well validated Movement Disorders Society clinical criteria by trained movement disorders specialists [26].
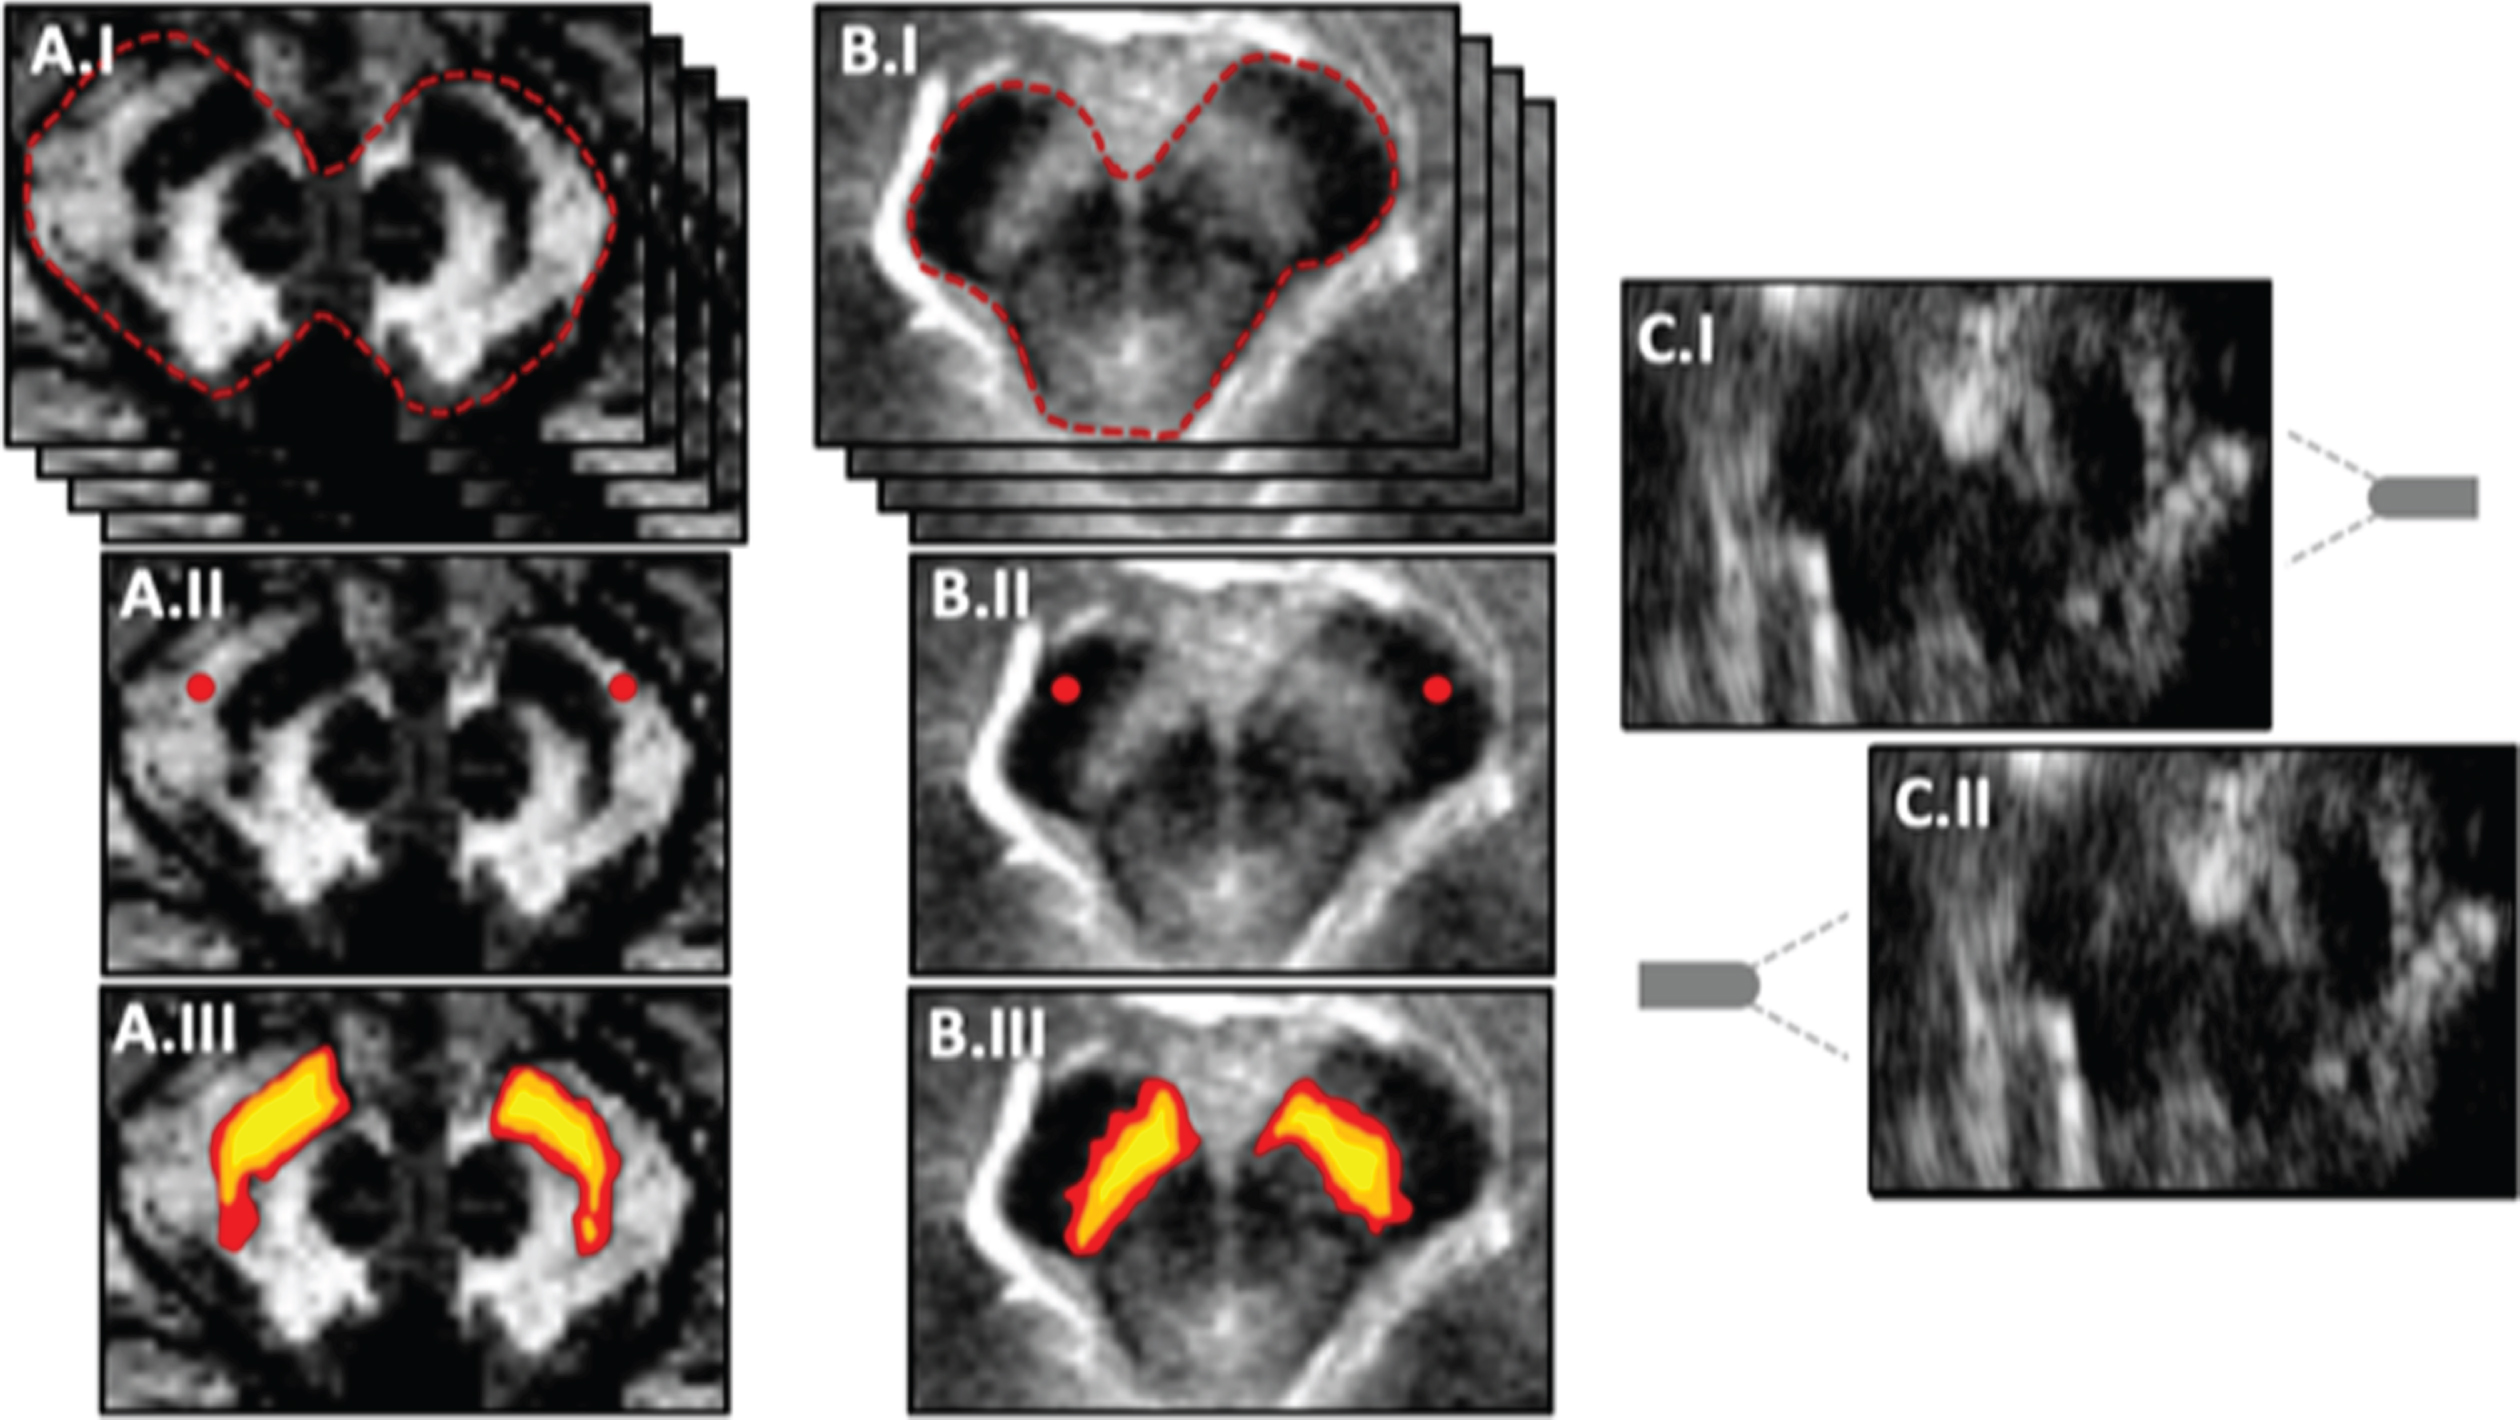
Schematic MRI and TCS data processing and analytical workflow. Panel A illustrates the analytical workflow of the susceptibility-weighted imaging (SWI). In accordance with A, B illustrates the workflow of neuromelanin-weighted imaging (NMI). In A.I and B.I, both raters have to visually identify the midbrain (red-dashed line) on respective axial slices, which contain the Substantia nigra (SN). In A.II and B.II, seeds (red) with a diameter of circa 6 mm are placed in non-SN midbrain tissues for both sides, and for all axial slices were the SN could be identified. Based on the mean signal intensities and the standard deviation (SD) of the placed seeds, thresholds with different rigor are defined ±(3SD): yellow; ±(4SD): orange; ±(5SD): red; see A.III and B.III). C demonstrates the detection of hyperechogenicity (HE+) via transcranial sonography (TCS). TCS has to be performed on both sides (C.I and C.II) to measure the ipsilateral HE+ planimetrically. The midbrain is marked with a red-dashed line and the expected location of the SN with a red-dotted line. The gray element depicts the direction of the ultrasound transducer.
Transcranial sonography
A conventional color-coded ultrasound system equipped with a 2.25 MHz phased array transducer (Esaote MyLab Alpha, Genoa, Italy) was employed for TCS examination. The TCS examination was performed through the temporal cranial bone window on both sides by an experienced sonographer. Scanning of the mesencephalic brainstem was conducted in the axial plane. After identification of the midbrain level at an insonation depth of ∼16 cm, representative SN images were stored and magnified. In the magnified images, the area of HE+ was manually defined and measured planimetrically utilizing eTouch software (Esaote, Genoa, Italy). The individual maximum HE+ was defined as the larger of the bilateral signals or the only available HE+ in case of an insufficient unilateral bone window. SN brightness was not considered an outcome parameter as brightness is influenced by the individual bone and observer-dependent settings [27].
MRI sequences and analyses
Structural MR imaging was performed at the CBBM Core Facility for Magnetic Resonance Imaging of the University of Lübeck using a 3-T Siemens Magnetom Skyra scanner equipped with a 64-channel head coil.
Neuromelanin-weighted imaging
A 2D dual gradient echo (GRE) sequence with the following acquisition parameters was used for NMI: TR = 475.0 ms; TE = 2.68 ms; MTC on; SWI off; flip angle 40° 0.7×0.7×3 mm3 resolution; 48×224×224 mm3 field of view; acquisition time 9.13 minutes; transverse orientation; phase-encoding direction anterior (A) > >posterior (P).
Susceptibility-weighted imaging
A 2D dual gradient echo (GRE) sequence with the following acquisition parameters was used for SWI: TR = 27 ms; TE = 20 ms; MTC off; SWI on; flip angle 15° 1×1×2 mm3 resolution; 120×220×220 mm3 field of view; acquisition time 4.54 minutes; transverse orientation; phase-encoding direction P > >A. Repeated measurements were co-registered before averaging to increase the signal-to-noise ratio and reduce motion artifacts.
T1 imaging
Structural images of the whole brain were acquired using a 3D T1-weighted MP-RAGE sequence with the following parameters: TR = 1900ms; TE = 2.44 ms; TI = 900 ms; flip angle 9° 1×1×1 mm3 resolution; 92×256×256 mm3 field of view; acquisition time 4.33 minutes; sagittal orientation; phase-encoding direction A > >P. Images were evaluated by an experienced neuroradiologist to rule out conflicting structural lesions and relevant comorbidities.
Image analysis
Magnetic resonance images were analyzed as described by Langley et al. [8]. As proper segmentation of the SN was critical for this study, we did not place any regions-of-interest (ROIs) in the SN directly. Rather, NMI and SWI images were visualized using the MRIcron software package (v.1.0.20190902) [28] and reference ROIs (each approximately 6 mm in diameter) were placed on bilateral non-SN midbrain regions of all respective slices including the SN. Two independent raters blinded to clinical group performed this procedure on all included SW and NM images. Only axial image slices on which both raters identified the SN visually were considered for further analyses. Based on standard fslutils (fslmaths and fslstats) functions from the FMRIB library (v.6.0), thresholds were defined for segmentation of the SN by each imaging modality [29]. In these analyses, mean intensity of non-SN midbrain tissue ±3 standard deviations (SD), ±4 SD, and ±5 SD were used as thresholds. Based on the subsequent SN segmentation, the mean area, maximal area, mean signal intensity, maximum signal intensity (for NMI), and the robust minimum (for SWI) were calculated for both sides and for all three predefined thresholds separately. The analytical workflow is illustrated in Fig. 1.
Statistics
All statistical tests were performed using SPSS 26 (IBM Corp. Released 2019. IBM SPSS Statistics for Macintosh, Version 26.0. Armonk, NY: IBM Corp.). We also assessed the inter-rater reliability (IRR) by intraclass correlation coefficient analyses (ICC; two-way mixed, single-measure). The mean values of the aforementioned variables were then calculated and used for all subsequent analyses. As we had no prior knowledge regarding the overall suitability of these thresholds, we employed exploratory statistics without additional correction for multiple comparisons. Potential group differences were assessed using Wilcoxon-Mann–Whitney U tests. We did not include any covariates as our aim was to investigate NMI or SWI signs associated with HE+. Therefore, we computed Spearman’s rho correlations of all SWI and NMI variables with the ipsilateral HE+. As previous statistical tests revealed no relevant group differences for defining a clear cut-off between PD patients and HCs, the aforementioned correlations were calculated for all study participants and only for PD patients.
Ethics statement
This study was approved by the ethics committee of the University of Lübeck and performed in compliance with the Declaration of Helsinki (as revised in 2013). Written informed consent was obtained from all study participants.
RESULTS
Participant demographics
Thirty-four PD patients and 29 healthy controls (HCs) were recruited for this study. There was no significant difference in mean age or sex ratio between groups (Table 1).
Demographic, clinical parameters, and HE+ values of Parkinson’s disease (PD) patients and healthy controls (HCs)
aas calculated by two-tailed Fisher’s exact test; bas calculated by Mann–Whitney U test. f, female; HE+, hyperechogenicity; LEDD, Levodopa-equivalent daily dosage; m, male; MDS-UPDRS, Movement Disorders Society Unified Parkinson’s Disease Rating Scale; n, number; n. a., not applicable; SD, standard deviation.
Neuromelanin-weighted and susceptibility-weighted segmentation-based analyses of the substantia nigra showed acceptable inter-rater reliability
The ICCs demonstrated strong inter-rater agreement for all NMI and SWI parameters across areas and intensities using a threshold of (3SD), supporting the reliability of these measures (Table 2). However, ICCs were weaker for area and intensity parameters at high thresholds (4SD) and (5SD). The ICCs ranged from 0.34 (SWI maximum area (4SD) left) to 0.97 (NMI intensity mean (3SD) left) (Table 2).
Inter-rater reliabilities (IRR) of susceptibility-weighted imaging (SWI) and neuromelanin-weighted imaging (NMI) parameters across different thresholds
p-values are reported without statistical correction for multiple comparisons. IRRs were calculated using the intraclass correlation coefficients (two-way mixed, single-measure). ICC, intraclass correlation coefficient; n, number; SD, standard deviation.
The area of the hyperechogenicity but not the MRI-derived measures differed between patients with PD and healthy controls
After calculating the mean values from both raters, group comparisons were performed using the Wilcoxon-Mann–Whitney U test. Mean area, mean intensity, maximum voxel intensities (for NMI), and minimum voxel intensities (for SWI) did not differ significantly between PD patients and HCs at any threshold (Table 3).
Group differences between Parkinson’s disease patients and healthy controls
This table provides an overview of group comparisons for the multimodal imaging of the substantia nigra (SN). Included are the neuromelanin-weighted imaging-based parameters (NMI) and the susceptibility-weighted imaging-based parameters (SWI) for both sides. NMI- and SWI-based parameters are again listed with different rigorous thresholds. The p-values are reported without statistical correction for multiple comparisons. The non-parametric Wilcoxon-Mann–Whitney U test was used for group comparisons. arb. units, arbitrary units; HCs, healthy controls; n, number; NMI, Neuromelanin-weighted imaging; PD, Parkinson’s disease; SD, standard deviation; SWI, susceptibility-weighted imaging; U, Wilcoxon-Mann–Whitney U.
Neither neuromelanin-weighted nor susceptibility-weighted imaging-based measures of the substantia nigra correlated with the area of the hyperechogenicity
The primary goal of this study was to elucidate the MR-morphological correlate of the HE+. Therefore, we investigated the potential correlations of the HE+ with mean parameters derived from multimodal MRI (Table 4). Again, there were no group differences in MRI measures and only weak correlations between HE+ and mean parameters for the whole cohort. In some instances, there were moderate correlations between HE+ and mean values from PD subjects at the (3SD) threshold. However, as we had no a priori knowledge for defining optimal thresholds, the number of statistical tests could not be reduced in advance. Therefore, relevant p-values are subject to multiple testing errors. The most parsimonious conclusion is that there are no significant associations between these MRI-derived SN measures and HE+.
Correlations of neuromelanin-weighted imaging- and susceptibility-weighted imaging-based parameters with ipsilateral hyperechogenicity on transcranial sonographic images
Non-parametric Spearman’s correlation coefficients are listed for Parkinson’s disease (PD) only and for the entire cohort (PD patients combined with healthy controls). The p-values are reported without statistical correction for multiple testing. ρ, Spearman’s rho; p, p-value; HCs, healthy controls; HE + , hyperechogenicity; n, number; NMI, neuromelanin-weighted imaging; PD, Parkinson’s disease; SD, standard deviation; SWI, susceptibility-weighted imaging; TCS, transcranial sonography.
DISCUSSION
In this study, we employed three imaging modalities, TCS, NMI, and SWI to investigate pathological alterations of the SN in patients with PD. Our primary goal was to examine whether NM loss as measured by NMI and (or) iron accumulation as measured by SWI can account for the HE+ observed by TCS. In addition to elucidating the pathophysiology underlying HE+, it was hoped that these analysis would help support the utility of SWI and NMI for patient diagnosis and monitoring given that several previous studies have implicated nigral NM loss and iron deposition in PD [11, 13]. However, our findings strongly suggest that the HE+ is unrelated to either process and thus these modalities should be viewed as providing complementary independent clinical information on patient status.
These weak correlations are unlikely due to poor measurement reliability as TCS measures of HE+ have shown excellent IRR in larger cohorts [27], while all IRR values measured in the current study were highly significant. However, the correlations between measures became weaker when more strict thresholds were employed (4SD) and (5SD), which emphasizes the need for an a priori definition of the optimal threshold. More standardized MRI processing pipelines may also enhance the reliability of these metrics to facilitate elucidation of SN pathology during PD progression.
While the majority of correlations between measures were weak, there was a moderate correlation between SN area as measured by NMI and TCS (ρ= 0.361, p < 0.039 among PD patients and ρ= 0.201, p < 0.116 for the entire cohort; Table 4). Alternatively, the weak correlations between most measures are inconsistent with postmortem studies implicating NM loss and (or) iron deposition in the HE+ [13, 14]. These weak correlations with SWI-derived measures are particularly surprising as several studies have suggested that iron dysregulation is a key factor leading to increased SN echogenicity [13, 14]. Our results are also in contrast to previous epidemiological studies implicating genetic alterations of ferritin metabolism in the nigral HE+ [30–32]. Further, NM is directly involved in PD pathogenesis [5, 34] and several studies have reported that NM content within the SN can serve as a reliable marker for the assessment of disease duration and progression, whereas HE+ does not reflect individual disease progression [20, 35]. In contrast to recent reports, we were not able to find significant group differences based on the assessment of the SN via SWI or NMI. This can mainly be explained by the different methodological approach employed in this study. Here, we used a segmentation-based analysis (with three different thresholds derived from non-SN midbrain tissue, see Fig. 1). However, our segmentation-based approach provides a more meaningful correlation target for the assessment of the HE+ (which can be interpreted as an area as well). For the demonstration of, e.g., a peak-intensity based analyses by manually placed ROIs within the SN, the interested reader may refer to Prasuhn et al. (2021) [36]. The absence of relevant group differences may also stem from the lack of normalization in the preprocessing of NMI (or SWI) images as there are no widely accepted normalization procedures for TCS images and different SN imaging modalities.
Alternatively, NMI and TCS may reflect distinct pathophysiological properties of the SN, in accordance with the observation that nigral HE+ does not serve as a neuroimaging marker for individual disease progression [17, 37] while NMI does [20, 35]. However, it should be noted that SWI can only be considered a surrogate marker of brain iron deposition in general. The involvement of iron dyshomeostasis in PD mechanisms is most likely multi-faceted and is not limited to the total brain iron level in a given neuroanatomical structure. For example, the oxidative state of iron (ferrous vs. ferric iron) or the complexation of iron atoms within macromolecules substantially determines its pathophysiological role [38]. Furthermore, activated microglia may be a major contributor to nigral HE+ since epidemiological, animal model, and cell culture studies support microglia as key drivers of PD progression [39–41]. Microglial activation may be of particular importance to SWI manifestation as these cells contain large amounts of ferritin, the primary iron storage protein in mammals [31]. However, most of these results are from post-mortem studies, which can only reflect the final pathways of neurodegeneration and miss ongoing pathophysiological mechanisms, such as neuroinflammation, potentially more strongly related to HE+ [34].
Although our study used well-established approaches for NMI and SWI analysis, we cannot rule out the possibility that other image analysis approaches may yield more reliable SN segmentation. In future studies, the in-vivo assessment of nigrosome-1 may provide further insights into the origins of the HE+ in patients with PD. However, reliable and standardized segmentation methods for this substructure of the SN are currently lacking. The visual inspection of the nigrosome-1 concerning the presence of the so-called swallow-tail sign (STS) is still under debate for 3 T MRI [42]. The STS, as a dichotomous radiological sign, may only provide negligible benefits to enhance our understanding of the origin of the HE+. Potential alternatives are structural and functional connectivity-based segmentation algorithms of the SN or the combination of additional MRI sequences [43]. The combination of complementary MRI sequences, such as high-resolution quantitative multiparameter mapping (through R1, PD*, T2*, and R2* sequences) [44, 45], MR elastography [46], or advanced diffusion tensor imaging techniques [37, 47], could be more useful for revealing the MR-morphological origin of the HE+. Improvements in MRI acquisition schemes or studies on associations between the imaging manifestations from existing sequences and histopathology are therefore warranted. Additionally, MRI sequences directly sensitive to cytophysiological alterations, such as magnetic resonance spectroscopy imaging [48–51] or chemical exchange saturation transfer [52–54], may provide more relevant information on PD pathophysiology and should also be used to investigate fundamental neuroanatomical structures in vivo. The utility of ultra-high field MRI (7T or above) has already been demonstrated for microstructural imaging of the midbrain [55–57]. However, sparse availability and patient safety concerns have hindered widespread use for clinical research [58].
CONCLUSION
Neurodegenerative changes in the SN produce distinct manifestations on TCS and MRI images, although both modalities can be used to show differences between PD patients and HCs for diagnosis. Further, these NM- and iron-sensitive MRI modalities may advance our understanding of PD pathophysiology and identify new neuroimaging markers for improved diagnostic accuracy or to map disease progression [18, 22]. However, improved MRI sequences, defining suitable thresholds, and more advanced segmentation algorithms, among other possible improvements, should be considered. The lack of correlation between HE+ and our MRI findings is inconsistent with prior post-mortem studies implicating NM loss and iron accumulation in PD pathogenesis [13, 14]. Nonetheless, TSC and specific MRI modalities (e.g., with multiparameter mapping [45]) or higher magnetic field strengths [57]) may provide complementary information for clinical research and patient management.
Footnotes
ACKNOWLEDGMENTS
JP received funding from the Parkinson’s Foundation (Miami, Florida, USA), Deutsche Parkinsongesellschaft (Berlin, Germany), and Deutsche Forschungsgemeinschaft via the Clinician Scientist School Lübeck (DFG-GEPRIS 413535489). This study was supported by a grant from the Deutsche Forschungsgemeinschaft (FOR2488) to NB.
CONFLICT OF INTEREST
The authors have no conflict of interest to report.