
Abstract
Background:
Several biomarkers have been evaluated in Parkinson’s disease (PD); cerebrospinal fluid (CSF) levels of lactate may reflect cerebral metabolism function and CSF amyloid-β42 (Aβ42), total tau (t-tau) and phosphorylated tau (p-tau) concentrations may detect an underlying neurodegenerative process.
Objective:
CSF levels of lactate, Aβ42, t-tau, and p-tau were measured in patients with mild to moderate PD. CSF levels of dopamine (DA) and its metabolite 3,4-Dihydroxyphenylacetic acid (DOPAC) were also assessed, exploring their relations with the other CSF biomarkers.
Methods:
101 drug-naive PD patients and 60 controls were included. Participants underwent clinical assessments and CSF biomarker analysis. Patients were divided into subgroups according to their Hoehn & Yahr stage (PD-1, PD-2, PD-3).
Results:
PD patients showed higher lactate levels (M = 1.91; p = 0.03) and lower Aβ42 (M = 595; p < 0.001) and DA levels (M = 0.32; p = 0.04) than controls (Mlactate = 1.72; MAβ42 = 837; MDA = 0.50), while no significant differences were found in t-tau, p-tau and DOPAC concentrations. Considering the subgroup analysis, PD-3 group had higher lactate (M = 2.12) and t-tau levels (M = 333) than both PD-1 (Mlactate = 1.75, p = 0.006; Mt - tau = 176, p = 0.008) and PD-2 groups (Mlactate = 1.91, p = 0.01; Mt - tau = 176, p = 0.03), as well as the controls (Mlactate = 1.72, p = 0.04; Mt - tau = 205, p = 0.04). PD-2 group showed higher lactate levels than PD-1 group (p = 0.04) and controls (p = 0.03). Finally, CSF lactate levels negatively correlated with DA (r = –0.42) and positively with t-tau CSF levels (r = 0.33).
Conclusion:
This CSF-based study shows that lactate levels in PD correlated with both clinical disease progression and neurodegeneration biomarkers, such as tau proteins and DA. Further studies should explore the clinical potential of measuring CSF biomarkers for better understanding the role of brain energy metabolism in PD, for research and therapeutic options.
INTRODUCTION
Parkinson’s disease (PD) is the second most frequent neurodegenerative disorder affecting the adult and elderly population [1–3]; over the years, numerous studies focused on improving the knowledge of genetic and environmental factors promoting PD neurodegeneration. Although the pathological cascade underlying PD pathogenesis is not yet completely known, converging evidence supports the hypothesis that oxidative stress, neuronal metabolism dysregulation and α-synuclein (α-syn) pathology contribute to the dopaminergic system damage [4–7]. In this context, several biomarkers have been tested to early identify PD pathology from the pre-motor clinical phases and to better predict and track disease time-course and progression; however, the results cannot be considered fully comprehensive [8–11].
Cerebrospinal fluid (CSF) represents the best tissue to deepen the pathological mechanisms at the basis of central nervous system (CNS) diseases. CSF biomarkers are widely considered as useful tools to improve the diagnosis of neurodegenerative disorders, including Alzheimer’s disease (AD) [12]. Following the previous results documented in AD, the CSF amyloid-β42 (Aβ42), total tau (t-tau), and phosphorylated-tau (p-tau) proteins levels have also resulted to be a potential cornerstone in understanding the pathogenesis of PD, as well as identifying the increased risk and progression of some PD non-motor symptoms (NMS), such as cognitive impairment and dementia [13–15]. Conversely, although CSF α-syn species turn out to be a feasible CSF biomarker for recognizing PD since they reflect the Lewy bodies accumulation in the brain [16], they are not currently included in the biomarker setting for improving PD diagnosis and management [17, 18]. Indeed, the different α-syn species cannot yet be considered an ideal PD biomarker, since their reliability and reproducibility in the sampling and dosing is still low, enabling the discrimination among different synucleinopathies, which lead to contrast results in the literature [18–20].
In the past decades, CSF monoamine dosages have been considered in patients with PD, but only recently the clinical significance of CSF monoamine was acknowledged [21], although the difficulties in determining their CSF levels still limit their clinical potential [21–23]. Finally, other emergent biomarkers have been studied, such as lysosomal enzymes, neurofilament light chain, markers of neuroinflammation and oxidative stress, however, they have not yet been proved reliable markers for PD diagnosis and disease progression [11, 25].
The constant need to detect new specific biomarkers for PD pathology encourages the identification of novel CSF candidates. Among them, lactate emerged as a reliable biomarker of cerebral metabolic pathway integrity since neuronal mitochondria inefficiency may correspond to the increase of CSF lactate levels, as recently documented in patients affected by AD [26–28]. Regarding patients with PD, previous studies with small samples documented normal CSF lactate concentrations; however, mitochondrial complex I activity of the skeletal muscle was significantly decreased in PD [29, 30]. In a recent study, the assessment of lactate allowed to differentiate the CSF profile of young-onset from late-onset PD [31].
To better understand the clinical potential of several CSF biomarkers in PD, the present study measured the levels of CSF lactate, Aβ42, t-tau, and p-tau in a large population of patients with mild to moderate PD, distributed based on Hoehn & Yahr (H&Y) stage. Moreover, the study also assessed the CSF levels of dopamine (DA) and its metabolite 3,4-Dihydroxyphenylacetic acid (DOPAC) in a subgroup of patients, exploring their possible relations with the other CSF biomarkers.
METHODS
Participants and study design
Patients with PD were consecutively recruited at the PD centre of the Neurology Unit at the University of Rome “Tor Vergata” from 2012 to 2014. All of them received the diagnosis of idiopathic PD according to the UK Parkinson’s Disease Society Brain Bank criteria [32]. At the time of enrolment, patients’ clinical disability was assessed using the motor examination section of the Unified Parkinson’s Disease Rating Scale (UPDRS-III). Patients were also required to meet the following inclusion criteria: no intake of drugs acting on the CNS, including antiparkinsonian treatment; H&Y stage of 1–3; no cognitive impairment, defined by presenting a Mini-Mental State Exam score > 24. Exclusion criteria were the following: systemic and/or neurologic infectious, inflammatory, or autoimmune diseases; diabetes; radiculopathies; abnormal cell count (> 4 cells/mcL) at the CSF sample analysis.
A group of controls similar for age and sex with patients with PD was also recruited. Specifically, the control group included inpatients at the Neurology Unit of the University of Rome “Tor Vergata” undergoing neurologic examination, laboratory tests, cognitive examination, brain MRI and lumbar puncture for diagnostic purposes. Inclusion criteria for controls were the following: no CNS diseases confirmed by clinical and instrumental examinations; no cognitive decline measured with MMSE; no systemic disorders or diabetes; no cell count abnormalities and no alterations in biomarkers assessment at the CSF analysis. The exclusion criterion was the intake of CNS active drugs.
The study protocol was approved by the internal review board of the Local Ethical Committee. Written informed consent was obtained from all participants in the study.
CSF biomarkers analysis
All CSF samples were obtained by lumbar puncture performed in the decubitus position between 8:00 and 9:30 AM, using an atraumatic needle. All procedures followed the internal protocol and CSF samples were collected in polypropylene tubes using standard sterile techniques [33]. The first 4 mL CSF sample was used for routine biochemistry analysis, including the total cell count and lactate levels. Chemistry assays, including CSF lactate, were carried out using commercially available kits following the manufacturer’s specifications (Flex reagent cartridge, Dimension Vista System, Siemens Healthcare Diagnostics GmbH, Munich, Germany), as previously described [26, 27]. A second 4 mL CSF sample was centrifuged to eliminate cells and cellular debris and immediately frozen at –80°C until the analysis to assess t-tau, p-tau, and Aβ42 levels, as previously reported [34–37]. The levels of classical CSF biomarkers were measured by using commercially available assays, following standard procedures. In particular, Aβ42 and t-tau were determined by using an automated chemiluminescent enzyme immunoassay (Lumipulse, Fujirebio), whereas p-tau was analysed by using the corresponding manual sandwich enzyme-linked immunosorbent assay (Innotest, Fujirebio). The results of our laboratory [36, 37] are in line with those of the external quality control program for the CSF biomarkers, promoted by the Alzheimer’s Association [38].
In a subgroup of patients with PD, DA and its metabolite DOPAC were also measured, as part of a collaboration with the clinical Neurocardiology centre of the National Institute of Health (NIH). 1.5–2 mL of CSF was considered for this supplemental analysis. The CSF was aliquoted into 6–8 aliquots of 200μL in plastic sample tubes. To each 200μL, aliquot 4μL of 0.01 M perchloric acid was added. The samples were frozen after a few minutes at –80°C and kept frozen continuously at –80°C until shipped in dry ice to the clinical Neurocardiology centre of the NIH. All the samples arrived frozen solid at the clinical centre of NIH and were stored at –80°C until thawed for assays, which were done within 2 weeks of receipt according to previously published procedures [21, 39]. Then, CSF levels of DA and DOPAC were measured in NIH laboratory by batch alumina extraction followed by liquid chromatography with series electrochemical detection, as described previously [40]. Limits of detection for catechols were about 10 pmol/l, or 10 fmol per assayed ml of CSF [40, 41].
Statistical analysis
Data were analysed using the Statistica program (Statsoft Inc, Tulsa, OK, USA) [42]. Data are reported as mean±standard deviation. Categorical data are reported as counts and percentages. The Kolmogorov-Smirnov test was used to check for the normal distribution of the data. All demographic, clinical, and CSF data were then compared between the PD patients and the controls using the Student’s t-test. For the PD patient’s subgroup analyses, patients were first divided into subgroups according to their H&Y stage (PD-1, PD-2, PD-3) and then differences between CSF lactate and AD biomarkers were tested using one-way ANOVA, followed by Tukey’s post hoc analysis. Considering the small number of patients distributed in the three subgroups, the subgroup analyses were not performed for CSF DA and DOPAC levels.
Moreover, in the entire PD patients’ group, correlations between CSF levels of Aβ42, t-tau, p-tau, and lactate were performed using the parametric Pearson test. Statistical significance was set at p≤0.05.
RESULTS
Demographic and clinic data
A total of 144 patients with PD participated in the study. Forty-three patients were excluded from the analysis because 22 patients were affected by diabetes, 16 refused to perform lumbar puncture, 5 presented a total cell count of more than > 4 cells/mcL. Therefore, 101 patients with PD were included. Thirty-two PD patients showed H&Y stage of 1 (PD-1), 41 PD patients showed H&Y stage of 2 (PD-2), and the remaining 28 PD patients showed H&Y stage of 3 (PD-3). Moreover, 60 controls, similar for age and sex with PD patients were included in the study. Demographic and clinic data are reported in Table 1.
Participants’ demographic and clinic data
Data are presented as mean±SD. F, Female; M, Male; MMSE, Mini-Mental State Examination; NA, non-applied; NS, non-significant; UPDRS-III, Unified Parkinson’s Disease Rating Scale - motor section.
CSF lactate and AD biomarkers levels
Patients with PD showed higher CSF lactate levels and lower CSF Aβ42 levels than controls, while no differences were found in t-tau and p-tau CSF concentrations between PD patients and controls (Table 2). Considering the three PD subgroups, the PD-3 group showed lower CSF Aβ42 levels and higher CSF lactate levels when compared to both PD-1 and PD-2 groups, as well as controls. Moreover, PD-2 patients showed significantly higher CSF lactate levels than the PD-1 group and controls. No significant differences were found in CSF lactate levels between PD-1 patients and controls. Finally, PD-3 patients showed higher CSF t-tau levels when compared to PD-2 and PD-1 patients, and controls. No other differences were found for t-tau and p-tau levels among the subgroups. Differences among the H&Y groups and CSF biomarkers are presented in Table 3 and Fig. 1.
CSF data in patients with PD and controls
Data are presented as mean±SD. Aβ42, amyloid-β42; NS, non-significant; t-tau, total tau; p-tau, phosphorylated tau.
CSF data in patient subgroups
Data are presented as mean±SD. *Significant differences between PD-3 vs PD-1. †Significant differences between PD-3 vs PD-2. #Significant differences PD-2 vs. PD-1. Abbreviations: Aβ42, amyloid-β42; H&Y, Hoehn & Yahr; NS, non-significant; t-tau, total tau; p-tau, phosphorylated tau.
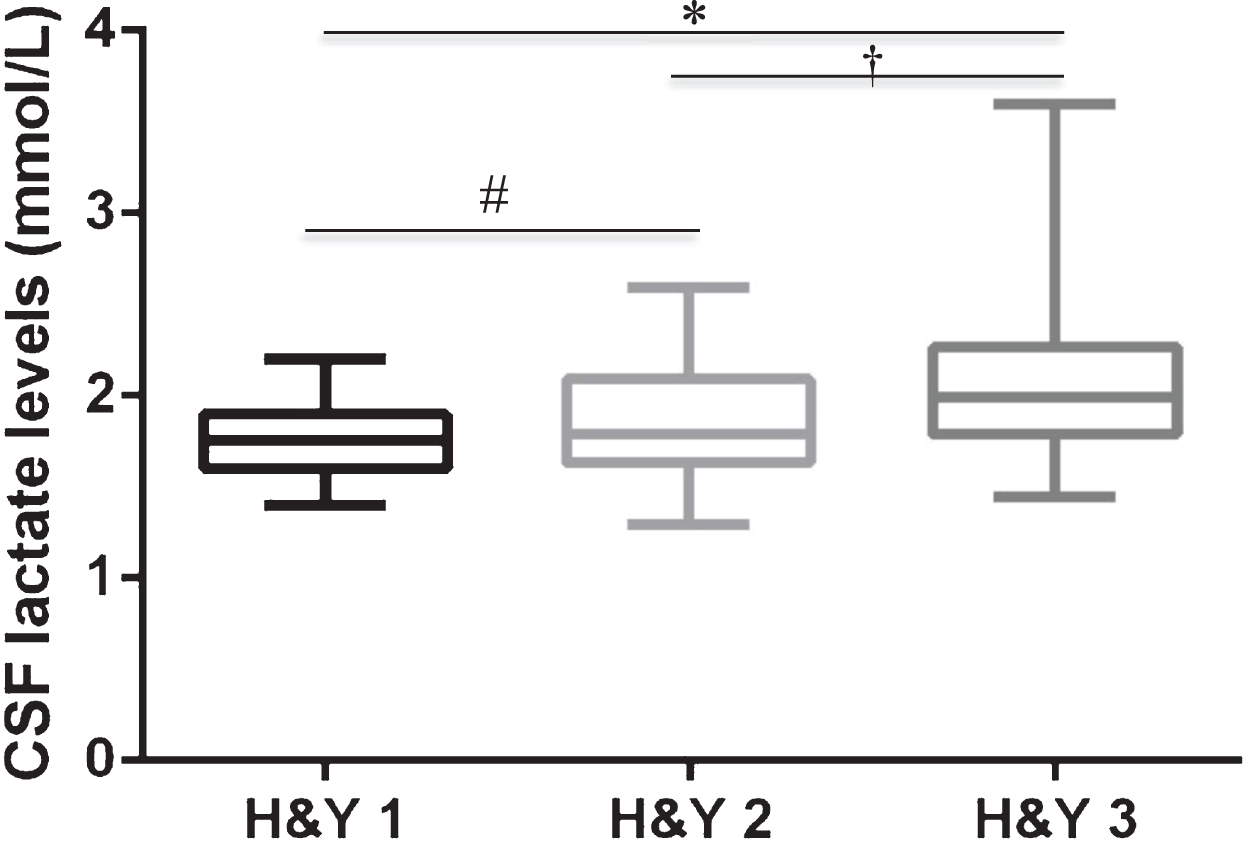
CSF lactate levels among PD patients distributed based on H&Y stage. Note: The Box plot describes the distribution of the CSF lactate levels (mmol/L) in the H&Y stage groups on a five-number statistical summary, which consists of minimum, first quarter, median/second quarter, third quarter, maximum. *Significant differences between PD-3 vs PD-1. †Significant differences between PD-3 vs PD-2. #Significant differences PD-2 vs. PD-1. H&Y, Hoehn & Yahr.
CSF DA and DOPAC levels
The DA and DOPAC levels were measured in a subgroup of 38 patients and compared to a group of 16 controls. Specifically, PD patients showed significant lower CSF DA levels than controls, while no significant differences in DOPAC levels were found between the PD patients and controls (see Table 4).
DA and DOPAC data among the subgroups
DA, dopamine; DOPAC, metabolite 3,4-Dihydroxyphenylacetic acid; F, Female; H&Y, Hoehn & Yahr; M, Male; MMSE, Mini-Mental State Examination; NA, Non-applied; NS, non-significant; UPDRS-III, Unified Parkinson’s Disease Rating Scale.
Correlation analysis
Pearson correlation analysis among the CSF biomarkers documented a significant positive correlation between CSF lactate levels and t-tau levels in the whole group of PD patients (r = 0.33; p < 0.05). Regarding the CSF DA and DOPAC levels, a negative correlation was found between CSF DA and lactate levels (r = –0.42; p < 0.05). No other significant correlations were found among CSF biomarkers, clinical, and demographic data.
DISCUSSION
The CSF biomarker analysis may be a precious and reliable aid in improving the accuracy of PD diagnosis and disease management, by contributing to better define clinical features, estimating the direction of the neurodegenerative process, and predicting the development of important NMS, such as cognitive impairment [43].
Numerous CSF biomarkers have been tested in PD patients over the years, but only a few of them turn out to be feasible. Among them, CSF Aβ42 levels are currently used for predicting cognitive decline in PD, whereas CSF tau proteins levels may differentiate PD from other neurodegenerative disorders [13–15, 44], thus resulting useful for PD diagnosis. In addition, CSF lactate levels have been recently investigated in PD [45], even as an indicator of neuronal metabolic pathways in young and late-onset disease [31].
Considering the interest in the role of biomarkers in PD, this study measured the CSF levels of a biomarker panel (t-tau, p-pau, Aβ42, lactate, DA and DOPAC) in an overall large sample of drug-naive patients with PD, classified according to the severity of disease, as stated by the H&Y stage.
The results of the present study confirmed that patients with PD showed lower CSF Aβ42 levels when compared to controls [10, 15]. Similarly to previous studies reporting normal or slightly decreased levels of t-tau and p-tau in PD, our results showed no differences in CSF t-tau and p-tau concentrations between the entire PD patients group and controls [20, 47]. However, patients in advanced stages (H&Y 3) showed an increase in CSF t-tau levels compared to those in the early-moderate stages (H&Y 1 e 2), thus suggesting that CSF t-tau levels may be related to the progression of the disease. Although PD is not recognized as a tauopathy, dysregulation in tau proteins has been documented in sporadic PD brains, since tau pathology can be found in Lewy bodies accumulating in different cerebral areas [48]. Furthermore, alpha-synuclein can contribute to the accumulation and phosphorylation of tau in various mouse models, and thus increased levels of t-tau and p-tau can be found in the CSF of PD patients [49, 50]. The importance of quantifying CSF tau proteins levels has been proposed in the past to evaluate the progression of motor impairment in PD patients [47]. However, further evidence is needed to better understand the role of tau pathology in PD pathology and the clinical potential of dosing CSF levels of t-tau and p-tau.
This study also showed that patients with PD present higher CSF lactate levels than controls. Hence, the most interest finding of the present study is that CSF lactate levels progressively raise, in parallel with the progressive increase of CSF t-tau levels, as the disease progresses from H&Y stage 1 to stage 3. Moreover, patients with PD also showed lower CSF DA levels when compared to controls; and a significant negative relation was found between CSF DA and CSF lactate levels, thus suggesting that PD-related neurodegeneration may be associated with the progressive malfunction of brain energy metabolism.
Different lines of evidence suggested that CSF lactate levels can represent a trustworthy marker of brain metabolic damage since glycolysis converts glucose to pyruvate and pyruvate oxidation starts Krebs tricarboxylic acid cycle in mitochondria, thus when defects in this metabolic cascade occur, the malfunction of brain energy metabolism leads to the increase of lactate and pyruvate extracellular levels, as proved in patients with AD [26–28, 51]. Therefore, high CSF lactate levels have been interpreted as the possible result of energy metabolites accumulation due to brain mitochondrial impairment. Accordingly, CSF lactate levels have become reliable in vivo instruments for detecting mitochondrial damage and changing brain energy metabolism [27, 52]. There is a growing consensus that PD is a multifactorial systemic condition, in which several factors may determine its etiopathogenesis. A large amount of experimental animal data reported that PD is featured by brain energy metabolism dysfunction from the early or premotor/preclinical stages. Accordingly, the involvement of energy metabolism in specific protein processing (Aβ and α-syn) and signalling pathways (counting tau proteins functioning) has been largely supposed in PD [53, 54]. The finding that CSF lactate levels, expression of cerebral energy metabolism malfunction, increase with the H&Y stage, and correlate with the reduction of CSF DA levels, may biochemically mirror the neuropathological processes progression in patients with PD. Therefore, it is plausible to hypothesize a model in which brain energy metabolism may concur or move in parallel to PD neuropathological processes, thus allowing the speculation that monitoring cerebral energy functioning may help in identifying the stage of PD neurodegeneration.
Despite the novelty of this study by including a large number of drug-naive patients with H&Y 1-3, there are some limitations that need to be addressed. First, the cross-sectional design of the study did not allow the assessment of CSF biomarkers from the early to severe stages of PD disease. Second, the quantification of CSF pyruvate levels was not performed thus reducing the possibility to monitor the progression of the mitochondrial damage. In keeping with these limitations, this study suggests the possibility to measure and longitudinally monitor brain energy metabolism in PD. Moreover, this study propose the quantification of brain energy metabolsm in the ongoing clinical trials and thus opens to new targets in biomarkers research.
In conclusion, the role of brain energy metabolism in the development of neurodegenerative processes has been largely investigated, and biomarkers linked to mitochondrial energy function have been acknowledged as potential biomarkers of neurodegeneration. This study documented the potential of measuring CSF lactate levels as a marker of cerebral metabolic malfunction in PD. Moreover, our results documented that CSF lactate concentrations may also reflect the degree of neurodegeneration along the clinical progression of PD. The hypothesis of using lactate as a biomarker, not only of glucose metabolism inefficiency but also of dopaminergic system degeneration or diffuse neuronal damage may be taken into account in the diagnosis and clinical follow-up of the disease. Hence, further studies should also explore the role of brain energy metabolism in PD for future clinical or experimental research, but also for prospective therapeutic options.
CONFLICT OF INTEREST
The authors have no conflict of interest to report.