
Abstract
Background:
Constipation has been linked to cognitive impairment development in Parkinson’s disease (PD).
Objective:
Our aim was to analyze cognitive changes observed in PD patients and controls from a Spanish cohort with regards to the presence or not of constipation.
Methods:
PD patients and controls recruited from 35 centers of Spain from the COPPADIS cohort from January 2016 to November 2017 were followed-up during 2 years. The change in cognitive status from baseline (V0) to 2-year follow-up was assessed with the PD-CRS (Parkinson’s Disease Cognitive Rating Scale). Subjects with a score ≥1 on item 21 of the NMSS (Non-Motor Symptoms Scale) at baseline (V0) were considered as “with constipation”. Regression analyses were applied for determining the contribution of constipation in cognitive changes.
Results:
At V0, 39.7% (198/499) of PD patients presented constipation compared to 11.4% of controls (14/123) (p < 0.0001). No change was observed in cognitive status (PD-CRS total score) neither in controls without constipation (from 100.24±13.72 to 100.27±13.68; p = 0.971) and with constipation (from 94.71±10.96 to 93.93±13.03; p = 0.615). The PD-CRS total score decreased significantly in PD patients with constipation (from 89.14±15.36 to 85.97±18.09; p < 0.0001; Coehn’s effect = –0.35) compared to patients without constipation (from 93.92±15.58 to 93.14±17.52; p = 0.250) (p = 0.018). In PD patients, to suffer from constipation at V0 was associated with a decrease in the PD-CRS total score from V0 to V2 (β= –0.1; 95% CI, –4.36 – –0.27; p = 0.026) and having cognitive impairment at V2 (OR = 1.79; 95% CI, 1.01 – 3.17; p = 0.045).
Conclusion:
Constipation is associated with cognitive decline in PD patients but not in controls.
INTRODUCTION
Constipation is a frequent non-motor symptom (NMS) in Parkinson’s disease (PD). When pooling results from the most homogeneous studies in PD, a median constipation prevalence of 40% to 50% emerges [1]. Constipation may be present in all stages of PD and can be an especially disabling NMS in advanced PD patients [2]. Moreover, different studies have identified a higher risk of PD development in subjects with chronic constipation, and constipation has been considered a premotor symptom in PD [3–5]. This link between constipation and the risk of PD has been suggested in relation with the hypothesis of a gut–brain axis in etiopathogenesis of PD, with emerging evidence indicating that α-synuclein deposition may start in the enteric nervous system and then propagate to the brain [6]. Gastrointestinal involvement in PD may further contribute to disease progression and motor symptom development through alteration of the microbiome-gut-brain axis, a system of bidirectional interactions among gut bacteria, the enteric nervous system and the brain/central nervous system [7].
In this context, motor and NMS, including cognitive impairment, can be related to disruption of the microbiome-gut-brain axis and hypothetically could improve with restoration of the gut-microbiota environment [8]. Results in animal models demonstrated improvement in some cognitive functions after treatment with prebiotics and/or probiotics [9–11], suggesting that a disrupted gut-microbial environment in conjunction with elevated stress hormones may create an imbalance of pro-inflammatory vs. anti-inflammatory cytokines that induces potentially reversible cognitive impairments [7]. In PD patients, some recent studies have linked constipation to cognitive impairment [12–15]. Leta et al. [12]. observed that constipation was associated with the development of cognitive impairment in a longitudinal analysis of two international cohorts of the novo PD patients, 196 from the Non-motor International Longitudinal Study (NILS) and 423 from the Parkinson's Progression Markers Initiative (MMPI) study. In 360 PD patients from the PPMI study evaluated at baseline and after 5 years of follow-up, Kong et al. [13] found that constipation and probable REM sleep behavior disorder were strongly associated with future decline in some cognitive measures, more prominently in men. Remarkably, a secondary analysis of the PPMI observed that cognitive performance was uniquely associated with gastrointestinal symptoms and unrelated to non-gastrointestinal autonomic symptoms [8]. Tucker et al. [14] reported in a cross-sectional study conducted in 58 PD patients that bradyphrenia was constipation-linked and driven by sequential processes, unlike in 71 controls. Other recent studies suggest that the presence of gastrointestinal symptoms and/or constipation may serve as an early marker of cognitive impairment in PD [7, 15]. Contrary to previous reports, Sheng et al. [16] found in a transversal study that anosmia but not constipation was associated with cognitive impairment in 107 PD patients. Although two randomized placebo-controlled trials have provided class I evidence for probiotics as a treatment for constipation in PD, the effects of probiotics on other PD aspects, such as motor disability and cognitive function, and its long-term efficacy have not been investigated adequately [17]. In summary, the evidence is not entirely clear, and the lack of a control group in the analysis of big cohorts is noteworthy. Furthermore, markers of inflammation and/or microbiota function were not included in these studies.
With the aim of exploring the possible relationship between cognition and constipation in PD, the objective of this study was to compare the cognitive status of PD patients and controls from a Spanish cohort and the changes experimented in cognition after 2-year follow-up with regard to the presence or absence of constipation. Moreover, serum biomarkers (SB) from blood sample collections obtained per protocol in the COPPADIS Study [18] were also analyzed and compared between patients with and without constipation and/or cognitive impairment.
METHODS
PD patients and controls, who were recruited from January 2016 to November 2017 and evaluatedagain at 2-year follow-up from 35 centers of Spainfrom the COPPADIS cohort [19], were included inthe study. Methodology about COPPADIS-2015 st-udy can be consulted in https://bmcneurol.biomedcentral.com/articles/10.1186/s12883-016-0548-9 [18]. This is a multi-center, observational, longitudinal-prospective, 5-year follow-up study designed to analyze disease progression in a Spanish population of PD patients. All patients included were diagnosed according to UK PD Brain Bank criteria [20]. Exclusion criteria were: atypical parkinsonism, dementia (Mini-Mental State Examination [MMSE] < 26 [21]), age < 18 or >75 years, inability to read or understand the questionnaires, to receive any advanced therapy (continuous infusion of levodopa or apomorphine, and/or with deep brain stimulation at baseline), and the presence of comorbidity, sequelae, or any disorder that could interfere with the assessment.
Information on sociodemographic aspects, factorsrelated to PD, comorbidity, and treatment was collected. V0 (baseline visit) and V2 (2 years±1 month) evaluations included motor assessment (Hoenh & Yahr [H&Y], Unified Parkinson’s Disease Rating Scale [UPDRS] part III and part IV, Freezing of Gait Questionnaire [FOGQ]), non-motor symptoms (Non-Motor Symptoms Scale [NMSS], Parkinson’s Disease Sleep Scale [PDSS], Visual Analog Scale-Pain [VAS-Pain], Visual Analog Fatigue Scale [VAFS]), cognition (MMSE, Parkinson’s Disease Cognitive Rating Scale [PD-CRS]), mood and neuropsychi-atric symptoms (Beck Depression Inventory-II [BDI-II], Neuropsychiatric Inventory [NPI], Questionnaire for Impulsive-Compulsive Disorders in Parkinson’s Disease-Rating Scale [QUIP-RS]), disability (Schwab & England Activities of Daily Living Scale [ADLS]), and quality of life (QoL) (the 39-item Parkinson’s disease Questionnaire [PDQ-39], PQ-10, the EUROHIS-QOL 8-item index [EUR-OHIS-QOL8]) [18]. In patients with motor fluctuations, the motor assessment was made during the OFF state (without medication in the last 12 h) and during the ON state. On the other hand, the assessment was only performed without medication in patients without motor fluctuations. The same evaluation as for the patients, except for the motor assessment, was performed in control subjects at V0 and at V2 (2 years±1 month) [18].
Cognitive assessment and cognitive status classification
The cognitive status at V0, at V2, and the change from V0 to V2 was assessed with the PD-CRS [22]. This is a cognitive screening battery validated to assess the cognitive status of patients with PD. The total score is the sum of the fronto-subcortical sub-score (item 1, immediate free recall verbal memory; item 3, sustained attention; item 4, working memory; item 5, unprompted drawing of a clock; Item 7, delayed free recall verbal memory; item 8, alternating verbal fluency; item 9, action verbal fluency) and the posterior-cortical score (item 2, confrontation naming; item 6, copy drawing of a clock). According to the PD-CRS total score, patients were classified as cognitively preserved (PD-CRS-NC[PD-CRS – Normal Cognition] = PD-CRS total score > 80), with PD-CRS-MCI (PD-CRS – Mild Cognitive Impairment) (PD-CRS total score < 81 and > 64), and with PD-CRS-D (PD-CRS – Dementia) (PD-CRS total score < 65) [23].
Constipation definition
Subjects were classified as with or without constipation according to the item 21 of the NMSS (Non-Motor Symptoms Scale) at baseline (V0) [24]. This item is one of the 30 items of this scale and is included in domain 6 (gastrointestinal symptoms; items 18, 19, and 21). The score range is from 0 (without the symptom) to 12 (the most frequent and severe). Subjects with a NMSS-item 21 score = 0 were considered as “without constipation” whereas subjects with a NMSS-item 21 score≥1 (from 1 to 12) were considered as “with constipation”. Regarding constipation severity, patients were classified in groups according to the score on the NMSS-item 21: G0 = 0 points; G1, from 1 to 4 points; G2, from 5 to 8 points; G3, from 9 to 12 points.
Serum biomarkers determination
Blood sample collection for the determination of different SB included S-100b protein, tumor necrosis factor (TNF)-α, interleukin (IL)-1, IL-2, IL-6, vitamin B12, methylmalonic acid, homocysteine, uric acid, ultrasensitive CRP (US-CRP), ferritin, andiron. SB levels were determined from frozen blood samples obtained from subjects participating in the COPPADIS-2015 study from 9 centers of Spain. The extraction of the sample was carried out no longer than 3 months after the first clinical assessment (V0) in the absence of infections and/or fever. The analysis was conducted at a common laboratory: REFERENCE LABORATORY (http://www.reference-laboratory.es). Different methods were used: visible spectrophotometry (iron); immunoluminescence (S-100b protein, ferritin, vitamin B12, and homocysteine); enzimoimmunoassay (IL-1, IL-2, and TNF-α); immunoassay (US-CRP); mass spectrometry (methylmalonic acid); enzymatic technique (uric acid). Outliers were excluded from the analysis.
Data analysis
Data were processed using SPSS 20.0 for Windows. For comparisons between patients and controls with and without constipation and/or cognitive impairment, the Student’s t-test, Mann-Whitney U test, Chi-square test, or Fisher test were used as appropriate (distribution for variables was verified by one-sample Kolmogorov-Smirnov test).
General linear model (GLM) repeated measure was used to test whether the mean differences of the PD-CRS total score, sub-scores and items between the two visits (V0 and V2) were significant in both PD patients and controls with regard to the presence of constipation or not. Age, gender, educational level, time since motor symptoms onset, H&Y-OFF at V0, NMSS total score at V0, BDI-II at V0, and LEDD (levodopa equivalent daily dose) at V0 and at V2 were included as covariates in PD patients (age, gender, and educational level in controls). This test was also applied for testing the difference between V2 and V0 in other variables, being age, gender and LEDD at V0 and at V2 added as covariates (age and gender in controls). Only all subjects with the data at V0 and V2 were included for each comparative analysis. In the latter models, an interaction for visit and group was tested before testing for a group difference over time. Cohen's d formula was applied for measuring the effect size (in PD patients). It was considered: small effect = 0.2; medium effect = 0.5; large effect = 0.8.
For exploring the association between constipation and the probability of suffering from cognitive decline, regression models were used. Firstly, linear regression models with the change from V0 to V2 in the PD-CRS total score as dependent variable (ΔPD-CRS = PD-CRSV2 – PDCRSV0). Tolerance and variance inflation factor (VIF) were used to detect multicollinearity (multicollinearity was considered problematic when tolerance was less than 0.2 and, simultaneously, the value of VIF 10 and above). Secondly, binary logistic regression models with presenting PD-CRS-MCI or PD-CRS-D (PD-CRS < 81) as dependent variable. Any variable with univariate associations with p-values < 0.20 were included in a multivariate model, and a backwards selection process was used to remove variables individually until all remaining variables were significant at the 0.05 level [25, 26]. Age, gender, time since motor symptoms onset, educational level and PD-CRS total score at V0 were included ascovariates.
Two decimals were used except for the percentage values, in which a single decimal was used (in the case of zero, it was omitted). The p-value was considered significant when it was < 0.05.
Standard protocol approvals, registrations, and patient consents
For this study, we received approval from the Comité de É tica de la Investigació n Clí nica de Galicia from Spain (2014/534; 02/DEC/2014). Written informed consents from all participants in this study were obtained. COPPADIS-2015 was classified by the AEMPS (Agencia Españ ola del Medicamento y Productos Sanitarios) as a Post-authorization Prospective Follow-up study with the code COH-PAK-2014-01.
Data availability
The protocol and the statistical analysis plan are available on request. Deidentified participant data are not available for legal and ethical reasons.
RESULTS
Data about cognitive status was recorded at V0 and V2 in 500 PD patients (59.3% males, mean age 62.4±8.65; mean time since motor symptoms onset 5.52±4.23 years) and 124 controls (47.6% males; mean age 62.4±7.44) from the COPPADIS cohort.
Cognitive status in PD patients vs. controls
After 2-year follow-up, the mean PD-CRS totalscore significantly decreased in PD patients (from92±15.65 to 90.26±18.07; p < 0.0001; Coehn's effect = –0.207) compared to no significant change observed in controls (from 99.65±13.56 to 99.68±13.73; p = 0.368) (difference between groups, p = 0.018) (Table 1 and Fig. 1A). When PD-CRS sub-scores were considered, fronto-subcortical sub-score significantly decreased in PD patients compared to controls (p = 0.009; Table 1 and Fig. 1B) but not posterior-cortical sub-score (p = 0.929; Table 1 and Fig. 1C). In PD patients, sustained attention (Coehn’s effect = –0.257) and working memory (Coehn’s effect = –0.246) were the items presenting the most significant score decrease. The change in other symptoms (motor and NMS) and aspects related to QoL and disability from V0 to V2 in PD patients and/or controls is shown in Table 1.
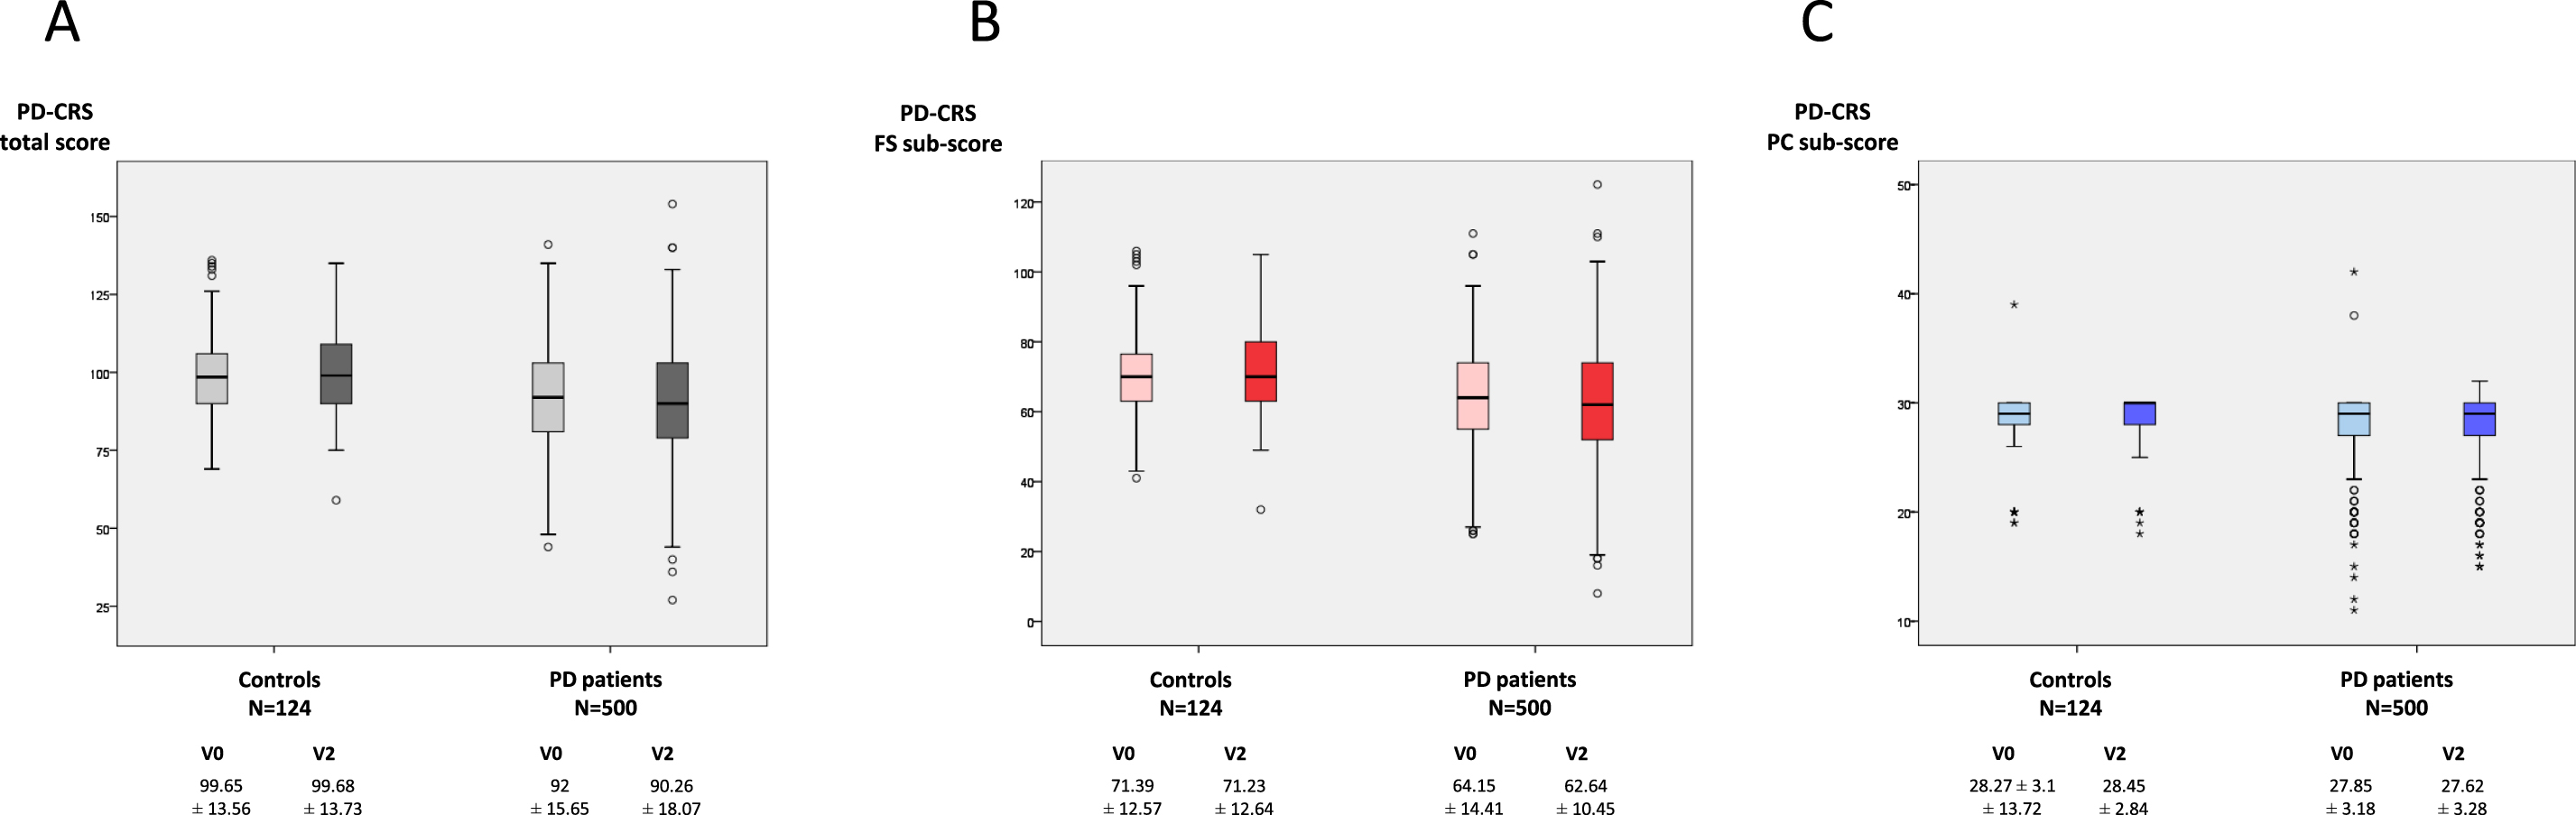
A) Change in PD-CRS total score from V0 (baseline) to V2 (2-year follow-up±1 month) in PD patients (N = 500) and controls (N = 124). V2 vs. V0 in PD patients, p < 0.0001; V2 vs. V0 in controls, p = 0.368. B) Change in PD-CRS fronto-subcortical sub-score from V0 to V2 in PD patients (N = 500) and controls (N = 124). V2 vs. V0 in PD patients, p < 0.0001; V2 vs. V0 in controls, p = 0.371. C) Change in PD-CRS cortical-posterior sub-score from V0 to V2 in PD patients (N = 500) and controls (N = 124). V2 vs. V0 in PD patients, p = 0.363; V2 vs. V0 in controls, p = 0.139. Data (A and B) are presented as box plots, with the box representing the median and the two middle quartiles (25–75%). p-values were computed using general linear models (GLM) repeated measures. Mild outliers (O) are data points that are more extreme than Q1 – 1.5 * IQR or Q3 + 1.5 * IQR. PD, Parkinson’s disease; PD-CRS, Parkinson’s Disease Cognitive Rating Scale.
Changes in cognition and other motor and non-motor symptoms, disability, and quality of life in PD patients and/or controls from V0 (baseline) to V2 (2 years±1 month)
p-values were computed using general linear models (GLM) repeated measures. The results represent mean±SD or %;pa, change over time (V2 vs. V0) in PD patients; pb, change over time(V2 vs. V0) in controls. Age, gender, and LEDD (levodopa equivalent daily dose) (except for assessing changes in this variable) at V0 and at V2 were included as covariates; for assessing changes in PD-CRS total score, sub-scores and items, cultural level, time since motor symptoms onset, H&Y-OFF at V0, NMSS total score at V0, and BDI-II at V0 were added as covariate; pc, group visit interaction; pd, PD vs. controls. PD vs. controls is not applicable if test of interaction was significant (a significant test of interaction means the rates of changes over time are different between the two groups). Only all patients with the data at V0 and V2 were included for each comparative analysis. For PD-CRS and its domains, N = 500 in PD patients and N = 124 in the control group. ADLS, Schwab & England Activities of Daily Living Scale; BDI-II, Beck Depression Inventory-II; FOGQ, Freezing Of Gait Questionnaire; FS, fronto-subcortical; NMSS, Non-Motor Symptoms Scale; NPI, Neuropsychiatric Inventory; PC, posterior-cortical; PD-CRS, Parkinson’s Disease Cognitive Rating Scale; PDSS, Parkinson’s Disease Sleep Scale; QUIP-RS, Questionnaire for Impulsive-Compulsive Disorders in Parkinson’s Disease-Rating Scale; UPDRS, Unified Parkinson’s Disease Rating Scale; VAFS, Visual Analog Fatigue Scale; VAS-Pain, Visual Analog Scale-Pain.
Constipation and factors related
At V0, 39.7% (198/499) of PD patients presented constipation compared to 11.4% of controls (14/123) (p < 0.0001) (1 patient and 1 control without data). In PD patients, the presence of constipation at V0 was not associated with gender, time since motor symptoms onset, or H&Y stage, but itwas with older age, motor phenotype (PIGD), and higher LEDD (Table 2). In general, motor and non-motor status, QoL, and autonomy for ADL was worse in PD patients with constipation compared to those ones without constipation (Table 2). Specifically, the PD-CRS total score and both fronto-subcortical and posterior-cortical sub-scores were significantly lower in PD patients with constipation compared to patients without constipation (PD-CRS total score, 89.14±15.36 vs. 93.92±15.58 [p < 0.0001]; PD-CRS fronto-subcortical sub-score, 61.78±14.46 vs. 65.75±14.17 [p = 0.003]; PD-CRS posterior-cortical sub-score, 27.36±3.28 vs. 28.17±3.08 [p = 0.003]) (Table 2). When patients were classified according to the PD-CRS FS-subscore (< 60 vs. ≥60), constipation was more frequent in PD patients with PD-CRS FS-subscore < 60 (86/186; 46.2%) than in PD patients with PD-CRS FS-subscore≥60 (112/313; 35.8%) (p = 0.014). Again, when patients were classified according to the PD-CRS CP-subscore (< 25 vs. ≥25), constipation was more frequent in PD patients with PD-CRS CP-subscore < 25 (31/57; 54.4%) than in PD patients with PD-CRS CP-subscore≥25 (167/442; 37.8%) (p = 0.012).
Disease related characteristics, motor and non-motor symptoms, autonomy for activities of daily living and quality of life in PD patientswith and withoutconstipation at baseline (N = 499)
The results represent mean±SD, median [p25, p75], or %; in all cohort, tha range is also shown (min – max). Chi-square or Mann-Whitney-Wilcoxon test were applied for comparissons between both groups, PD patients with vs. without constipation at baseline. ADLS, Schwab & England Activities of Daily Living Scale; BDI-II, Beck Depression Inventory-II; FOGQ, Freezing Of Gait Questionnaire; FS, fronto-subcortical; NMSS, Non-Motor Symptoms Scale; NPI, Neuropsychiatric Inventory; PC, posterior-cortical; PD-CRS, Parkinson’s Disease Cognitive Rating Scale; PDSS, Parkinson’s Disease Sleep Scale; QUIP-RS, Question naire for Impulsive-Compulsive Disorders in Parkinson’s Disease-Rating Scale; RBD, REM behavior disorder; UPDRS, Unified Parkinson’s Disease Rating Scale; VAFS, Visual Analog Fatigue Scale; VAS-Pain, Visual Analog Scale-Pain.
Changes in cognition regarding constipation
No change in the PD-CRS total score from V0 to V2 neither in controls without constipation(from 100.24±13.72 to 100.27±13.68; p = 0.971) or with constipation (from 94.71±10.96 to 93.93±13.03; p = 0.615) was observed (Fig. 2A). How-ever, the PD-CRS total score decreased significa-ntly in PD patients with constipation (from 89.14±15.36 to 85.97±18.09; p < 0.0001; Coehn’s effect = –0.35) compared to patients without constipation (from 93.92±15.58 to 93.14±17.52; p = 0.250) (p = 0.018) (Table 2 and Fig. 2A). By domains and compared to PD patients without constipation, the PD-CRS fronto-subcortical sub-score of patients with constipation reduced significantly (p = 0.021) but not the posterior-cortical sub-score (p = 0.207) (Table 3 and Fig. 2B, C).
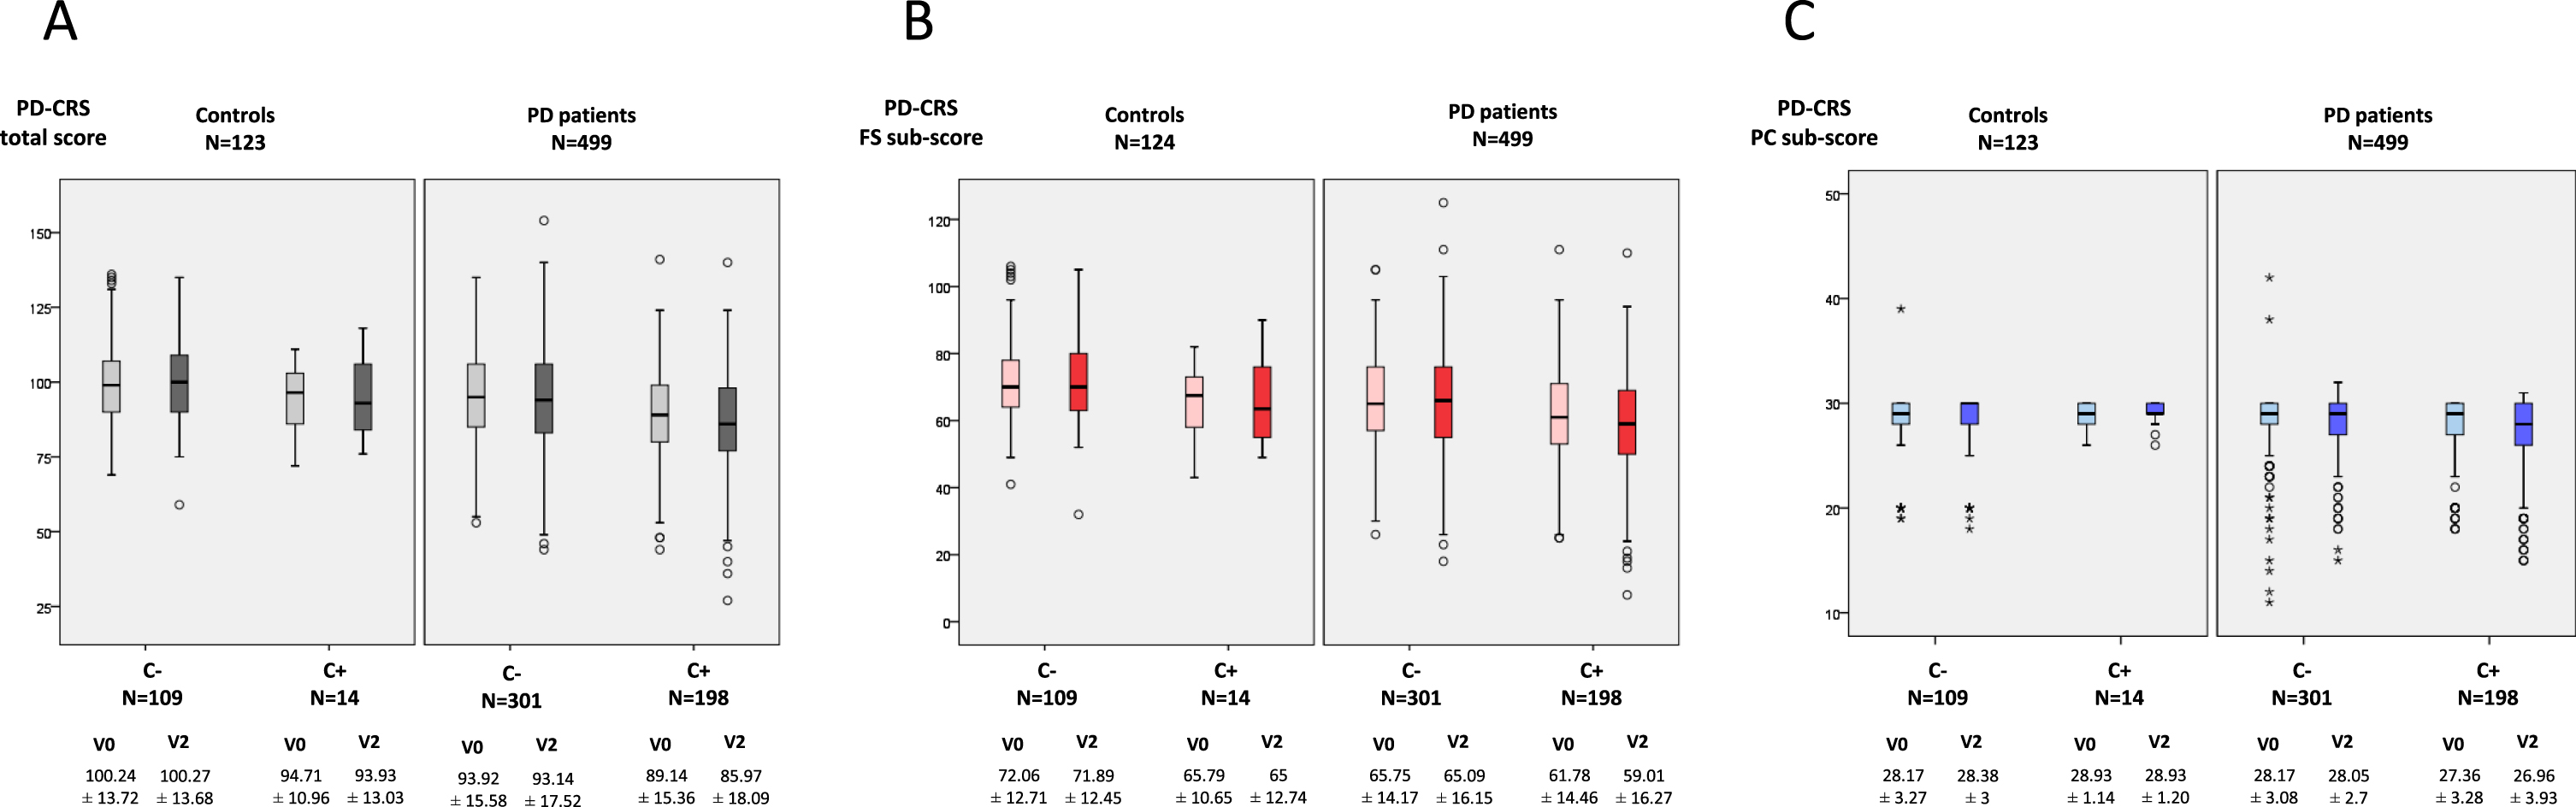
A) Change in PD-CRS total score from V0 (baseline) to V2 (2-year follow-up±1 month) in PD patients (N = 499) and controls (N = 123) regarding the presence or not of constipation. V2 vs. V0 in controls with constipation (N = 14), p = 0.615; V2 vs. V0 in controls without constipation (N = 109), p = 0.971; V2 vs. V0 in patients with constipation (N = 301), p < 0.0001; V2 vs. V0 in patients without constipation (N = 198), p = 0.250. B) Change in PD-CRS fronto-subcortical sub-score from V0 to V2 in PD patients (N = 499) and controls (N = 123) regarding the presence or not of constipation. V2 vs. V0 in controls with constipation (N = 14), p = 0.627; V2 vs. V0 in controls without constipation (N = 109), p = 0.812; V2 vs. V0 in patients with constipation (N = 301), p < 0.0001; V2 vs. V0 in patients without constipation (N = 198), p = 0.063. C) Change in PD-CRS posterior-cortical sub-score from V0 to V2 in PD patients (N = 499) and controls (N = 123) regarding the presence or not of constipation. V2 vs. V0 in controls with constipation (N = 14), p = 1.000; V2 vs. V0 in controls without constipation (N = 109), p = 0.258; V2 vs. V0 in patients with constipation (N = 301), p = 0.094; V2 vs. V0 in patients without constipation (N = 198), p = 0.838. Data (A and B) are presented as box plots, with the box representing the median and the two middle quartiles (25–75%). P values were computed using general linear models (GLM) repeated measures. Mild outliers (O) are data points that are more extreme than Q1 – 1.5 * IQR or Q3 + 1.5 * IQR. C+, with constipation; C–, without constipation; PD, Parkinson’s disease; PD-CRS, Parkinson’s Disease Cognitive Rating Scale.
Changes in cognition from V0 (baseline) to V2 (2 years±1 month) in PD patients with and without constipation
P values were computed using general linear models (GLM) repeated measures. The results represent mean±SD or %; pa, change over time (V2 vs. V0) in PD patientswit constipation; pb, change over time(V2 vs. V0) in PD patients without constipation. Age, gender, cultural level, disease duration, H&Y-OFF at V0, NMSS total score at V0, BDI-II at V0, and LEDD (levodopa equivalent daily dose) at V0 and at V2 were included as covariates; pc, group visit interaction; pd, PD patients with constipation vs.PD patients without constipation. PD patients with constipation vs. PD patients without constipation is not applicable if test of interaction was significant (a significant test of interaction means the rates of changes over time are different between the two groups). All patients with the data at V0 and V2 were included for each comparative analysis (N = 198 in PD patients with constipation and N = 301 in PD patients without constipation). FS, fronto-subcortical; N.A., not applicable; PC, posterior-cortical; PD, Parkinson’s disease; PD-CRS, Parkinson’s Disease Cognitive Rating Scale.
When subjects were categorized by groups according to the PD-CRS total score, the frequency of PD-CRS-MCI (PD-CRS total score from 65 to 80) and PD-CRS-D (PD-CRS total score≤64) was higher at both V0 and V2 in PD patients compared to controls (p < 0.0001 for both analysis) (Fig. 3A). After 2-year follow up, the frequency of PD-CRS-MCI and PD-CRS-D changed from 17.8% to 18.8% and from 5.6% to 8.4%, respectively, in PD patients (p = 0.035), compared to the insignificant change in controls (p = 0.735) (Fig. 3A). After considering PD patients as with or without constipation, more PD-CRS-MCI and PD-CRS-D cases were detected at V2 in the subgroup of patients with constipation compared to the subgroup without constipation (PD-CRS-MCI, 24.2% vs. 15%; PD-CRS-D, 11.1% vs. 6.6%; p = 0.003) (Fig. 3B). For groups (PD-CRS-NC, PD-CRS-MCI, and PD-CRS-D), the frequency at V2 of PD-CRS-MCI and PD-CRS-D was higher than at V0 in patients with constipation (p = 0.020) but not in those ones without constipation (p = 0.298; difference between groups, p = 0.297) (Fig. 3B).
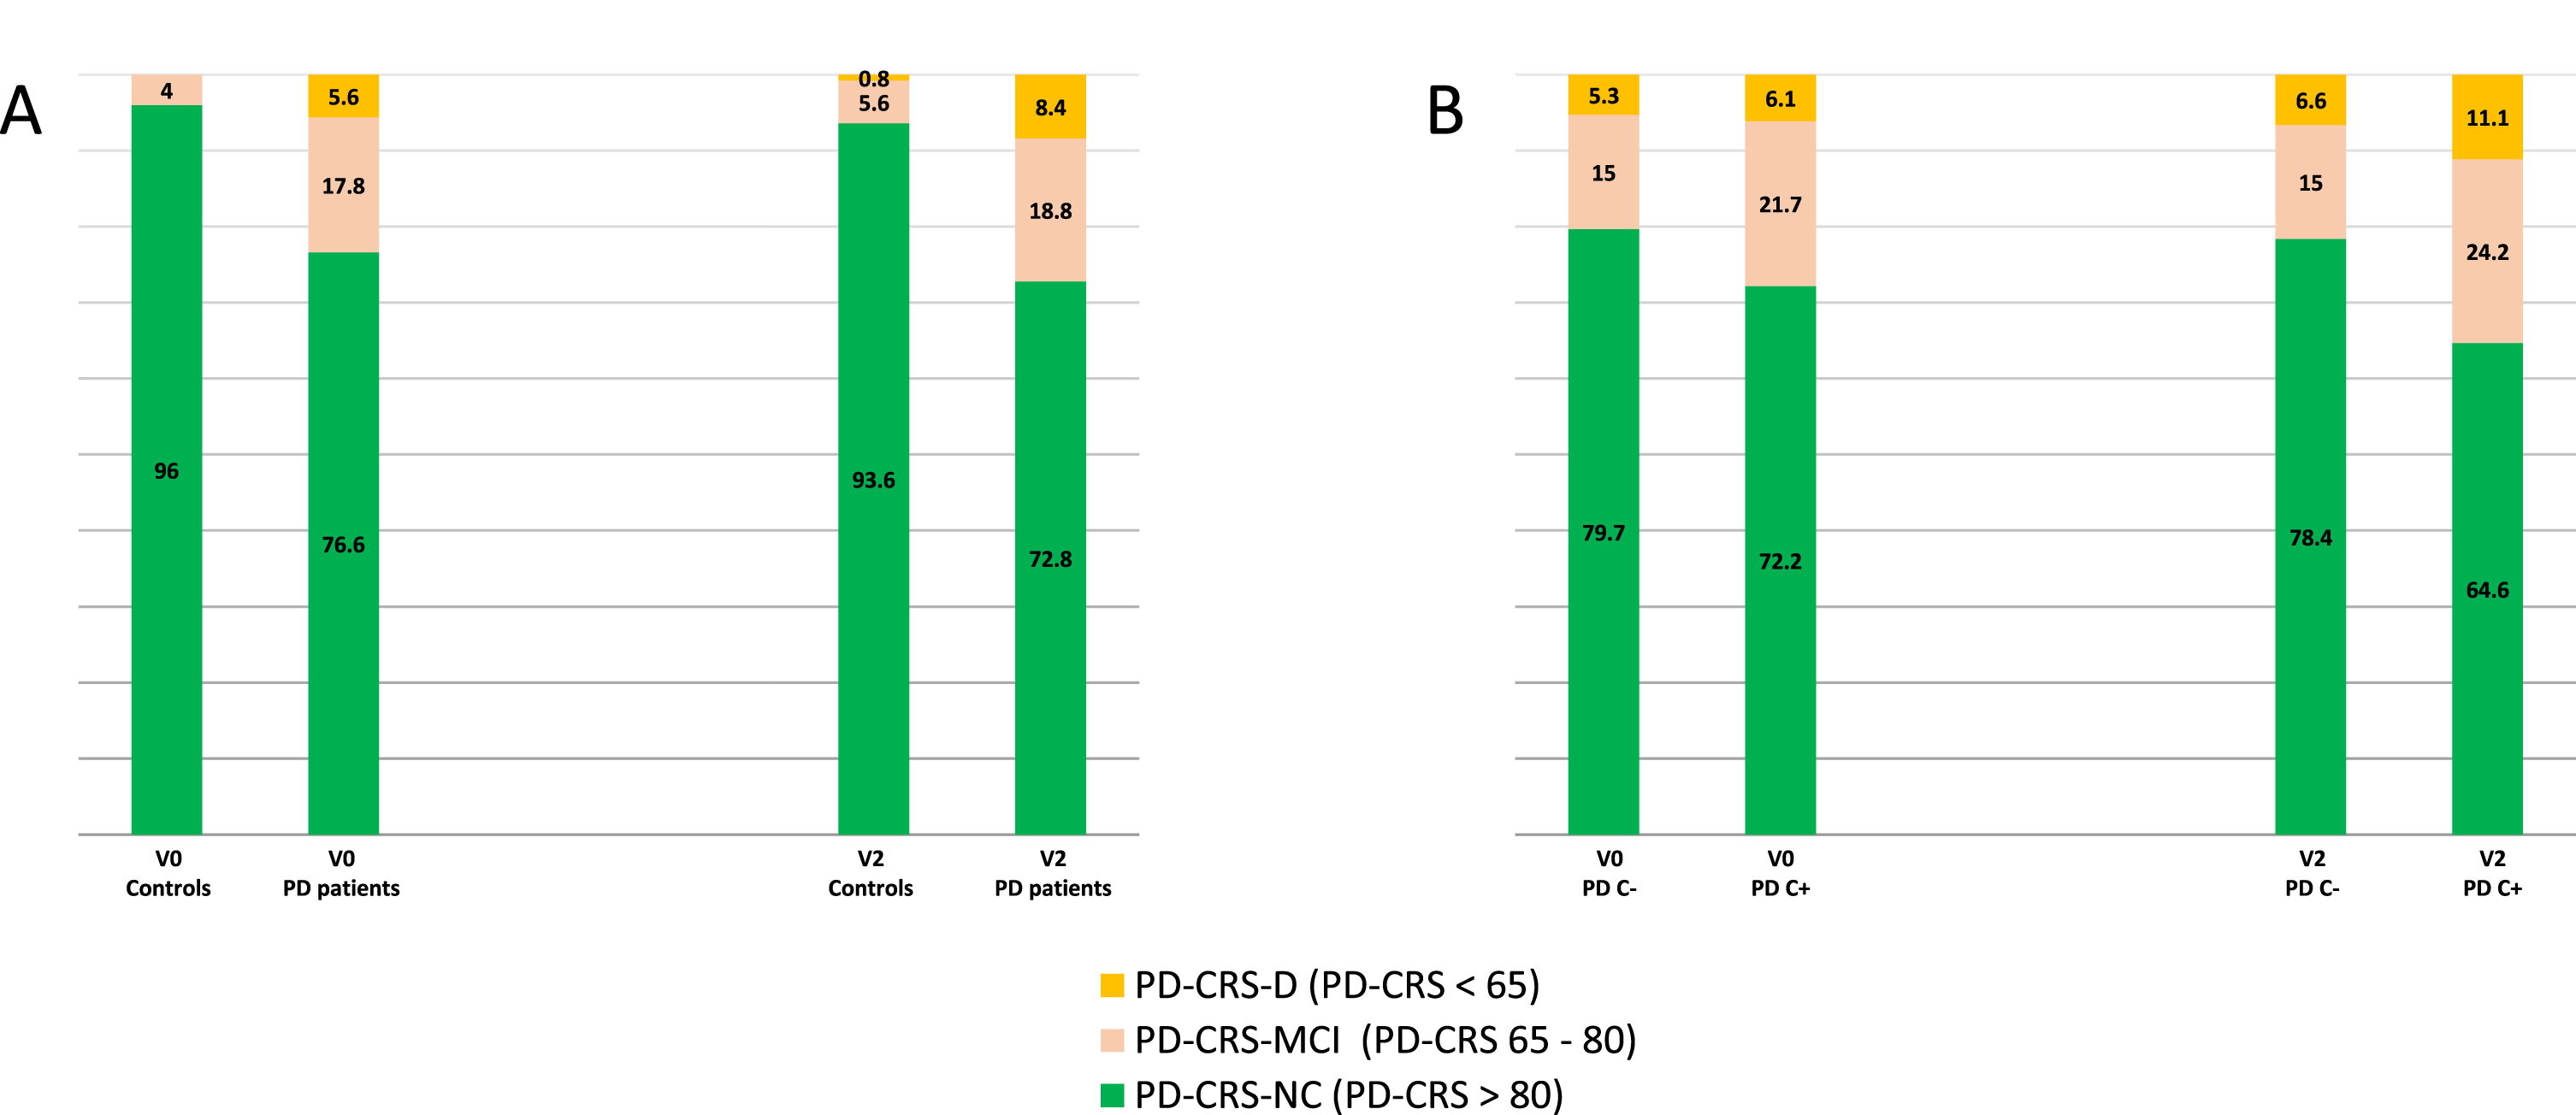
A) Percentage of controls and PD patients with normal cognition (PD-CRS-NC; PD-CRS total score > 80), mild cognitive impairment (PD-CRS-MCI; PD-CRS total score from 65 to 80) and dementia (PD-CRS-D; PD-CRS total score < 65) at V0 and at V2. Patients vs. controls at V0, p < 0.0001; patients vs. controls at V2, p < 0.0001; V2 vs. V0 in patients, p = 0.035; V2 vs. V0 in controls, p = 0.735. B) Percentage of PD patients with constipation (PD C+) and without constipation (PD C–) with PD-CRS-NC, PD-CRS-MCI and PD-CRS-D at V0 and at V2. V2 vs. V0 in PD C+, p = 0.020; V2 vs. V0 in PD C–, p = 0.298. p-values were computed using general linear models (GLM) repeated measures.
Sub-analysis in PD patients with a PD-CRS total score >64 at V0
Given that patients with PD-CRS-D at V0 could confound the results due to faster cognitive decline and mobility and dietary changes, a secondary ana-lysis was conducted in which only patients with a PD-CRS total score at baseline > 64 were included (N = 472). At V0, 18.9% of patients presented PD-CRS-MCI (89/472) whereas at V2, 18.6% were PD-CRS-MCI (18/472) and 5.1% PD-CRS-D (24/472). Regarding constipation, 23.1% of PD patients with constipation at V0 presented PD-CRS-MCI compared to 15.8% of PD patients without constipation (p = 0.031) (Supplementary Figure 1). At V2, 7% and 25.3% of PD patients with constipation presented PD-CRS-D and PD-CRS-MCI, respectively, compared to 3.9% and 14% of PD patients without constipation (p = 0.002). Considering the 3 groups (PD-CRS-NC; PD-CRS-MCI; PD-CRS-D), a significant change in the frequency of different groups from V0 to V2 was observed in PD patients with constipation (p = 0.001) but not in PD patients without constipation (p = 0.066) (Supplementary Figure 1). Although the change in the PD-CRS total score from V0 to V2 was significant in both groups, PD patients with constipation (from 91.23±13.26 to 87.51±16.52, p < 0.0001) and without constipation (from 95.76±13.84 to 94.79±16.26, p = 0.043), the effect size (Cohen’s d) was medium in the first group (d = 0.45) compared to small in the second one (d = 0.13) (p = 0.031).
Serum biomarkers
Higher serum levels of IL-2 (1.81±6.52 vs. 1.56±3.98; p < 0.0001), methylmalonic acid (0.17±0.14 vs. 0.11±0.06; p < 0.0001) and homocysteine (14.46±5.78 vs. 12.76±5.11; p = 0.006), and lower serum levels of Vitamin B12 (388.39±160.48 vs. 446.06±259.76; p = 0.031), were detected in PD patients compared to controls (Supplementary Table 1). When SB were compared between subjects with vs. without constipation and with vs. without cognitive impairment, no significant differences were observed in the first group, but lower serum levels of ferritin in PD patients with cognitive impairment compared to those ones without cognitive impairment (109.53±149.64 vs. 123.09±10.8.08; p = 0.039) were detected. After classifying PD patients in 4 sub-groups according to suffering at baseline from constipation and/or cognitive impairment, global comparison between all groups was conducted and only a trend of significance was observed for methylmalonic acid (p = 0.057) and homocysteine (p = 0.061), being for both SB the highest serum levels observed in those patients with constipation plus cognitive impairment and the lowest in those ones without constipation or cognitive impairment (Supplementary Table 2). When PD patients were classified in groups according to the score on the NMSS-item 21 (from G0 to G3), those patients of group G3 presented the highest levels of methylmalonic acid (G0, 0.15±0.09; G1, 0.2±0.24; G2, 0.2±0.14; G3, 0.26±0.21 [p = 0.036]) and homocysteine (G0, 13.47±3.85; G1, 15.52±8.35; G2, 14.54±14.07; G3, 18.03±7.26 [p = 0.020]).
Constipation as a predictor of cognitive decline in PD patients
To suffer from constipation at V0 was associated with PD-CRS total score decrease from V0 to V2 in PD patients (β= –0.09; 95% CI, –4.51 – –0.26; p = 0.028). After adjustment to age, gender, time since motor symptoms onset, educational level and PD-CRS-total score, constipation wasassociated with decrease in the PD-CRS total score in the multivariate model as well (β= –0.1; 95% CI, –4.36 – –0.27; p = 0.026; adjusted R-squared 0.16; Durbin-Watson test = 1.83) (Table 4). PD-CRS total score at V0 (β= –0.35; p < 0.0001), age (β= –0.27; p < 0.0001), ADLS score at V0 (β= 0.15; p = 0.005), and RBD according to the neurologist's opinion at V0 (β= –0.09; p = 0.033) were the other factors associated with PD-CRS total score decrease from V0 to V2. In the final linear model, tolerance was from 0.82 to 0.95 and VIF from 1.02 to 1.25. Similar results were obtained when only PD patients with a PD-CRS total score > 64 at V0 were considered (Supplementary Table 3).
Analysis about the impact of constipation on cognitive status change after 2-year follow-up in the PD group (N = 499)
Dependent variable: ΔPD-CRS = PD-CRSV2 – PDCRSV0 in the first model (linear regression model); PD-CRS total score < 81 in the second model (binary logistic regression model). Any variable with univariate associations with p-values < 0.20 were included in a multivariable model, and a backwards selection process was used to remove variables individually until all remaining variables were significant at the 0.05 level. Age, gender, time since motor symptoms onset, educational level and PD-CRS total score at V0 were included as covariates. ADLS, Schwab & England Activities of Daily Living Scale; PD-CRS, Parkinson’s Disease Cognitive Rating Scale; RBD, REM behavior disorder.
Constipation doubled the probability of suffering from cognitive impairment at V2 (PD-CRS-MCI or PD-CRS-D; PD-CRS total score < 81) (OR = 1.99; 95% CI, 1.33 – 2.96; p = 0.001). Even after adjustment to age, gender, time since motor symptoms onset, educational level and PD-CRS-total score, constipation was associated to suffer from cognitive impairment at V2 in the binary regression model (OR = 1.79; 95% CI, 1.01 – 3.17; p = 0.045; adjusted R-squared 0.51; Hosmer and Lemeshow test = 0.95) (Table 4). When age was considered as a dichotomous variable, being older than 70 years old increased the probability of cognitive impairment at 2-year follow-up more than 3 times (OR = 3.2; 95% CI, 1.67 – 6.14; p < 0.0001) after adjustment to the same covariates in the model (for constipation, OR = 1.83; p = 0.030). When SB were included in the models, no SB were associated with cognitive decline. Finally, when the analysis was conducted only in PD patients with a PD-CRS total score > 64 at baseline, constipation was a predictor of cognitive impairment as well (OR = 1.89; 95% CI, 1.04 – 3.42; p = 0.038; adjusted R-squared 0.47; Hosmer and Lemeshow test = 0.44) (Supplementary Table 3).
Constipation severity and cognitive impairment
Mean NMSS-item 21 score was significantly higher in PD patients (N = 499) than controls (N = 123) (1.61±2.82 vs. 0.37±1.29; p < 0.0001) but not when only subjects with constipation were selected (4.05±3.2 vs. 3.21±2.42; p = 0.375). However, only 14 controls presented constipation vs. 198 PD patients. When subjects were classified in groups according to the NMSS-item 21 score (from G0 to G3), cases in groups G3, G2, and G1 were more frequent in PD patients than controls (p < 0.0001): G1, 26.9% (134/499) vs. 8.1% (10/123); G2, 9.2% (46/499) vs. 3.3% (4/123); G3, 3.6% (18/499) vs. 0%. But again, when only subjects with constipation were considered, there were not significant differences between patients and controls (only 14 subjects) despite 9.1% of patients were G3 vs. 0% of controls (p = 0.482). In PD patients, there were no significant differences in the change of the PD-CRS total score from V0 to V2 between groups (G0 vs. G1 vs. G2 vs. G3) (p = 0.108) and the correlation between the NMSS-item 21 at V0 and the change in the PD-CRS total score from V0 to V2 was weak (r = –0.09; p = 0.039). Moreover, when NMSS-item 21 total score was introduced as variable(constipation severity) in the models instead of constipation, its association with cognitive decline from V0 to V2 and with cognitive impairment at V2 was not significant.
DISCUSSION
The present study observes that constipation was 4 times more frequent in PD patients than controls. It also found that PD patients with constipation had a worse cognitive status and cognitive decline after a 2-year follow-up compared to PD patients without constipation. However, constipation in controls was not associated with cognitive decline.
The frequency of constipation (40%) in our cohort is in line with data reported in other studies [1]. The percentage varies from 24% to 63% depending on the methods and samples [27], but as we detected, it is much more frequent in PD patients than in control subjects. A few studies included control subjects, and the frequency is similar to what we observed [28, 29]. Chronic constipation prevalence ranges from 1% to 8% in the general population, but in other studies the frequency is higher. Differences in the criteria used could account for these inconsistent results [1, 30]. One important point in the present study is that constipation was defined according to one specific question which asks for this symptom (item 21 from domain 5, gastrointestinal symptoms) from the NMSS; however, a specific validated scale or criteria for assessing constipation severity or an objective complementary study, such as x-ray, for assessing bowel evacuation was not used. In fact, this is a post-hoc analysis not initially considered in the COPPADIS study protocol [18]; therefore, caution is needed when interpreting these results. However, this methodology is not infrequent when scales are used (i.e., freezing of gait [31], motor fluctuations [32], dysphagia [33], etc.). Also, the NMSS is useful for detecting not only the presence of a symptom, such as the NMS-Quest [34], but the frequency and severity as well, being correct to divide the patients as without the symptom (score = 0) vs. with the symptom (score ≥1). Using this scale and methodology, Martinez-Martin et al. identified 202 out of 411 (49.1%) patients as PD patients with constipation [35].
The most interesting finding observed in this study is, firstly, the fact that cognitive function, assessed with the PD-CRS, worsened in the PD patient cohort but not in controls after a 2-year follow-up. Secondly, cognition worsened in the subgroup of patients with constipation compared to patients without constipation, but again not in controls. Moreover, to suffer from constipation at baseline was a predictor of cognitive decline and a predictor of having cognitive impairment (PD-CRS-MCI or PD-CRS-D) at the 2-year follow-up. Early identification of patients at risk of developing cognitive impairment in PD is still needed and could help to stratify the early PD population for prognostic information, improvement of clinical management, and personalized medicine [12]. Associations between gastrointestinal symptoms and cognitive dysfunction have been observed in some recent studies [12–15, 36]. Very interestingly, and for the first time, it has been reported that constipation in de novo PD patients seems to be associated with cognitive decline and may serve as a clinical biomarker for identification of patients at risk of cognitive impairment [12,15, 12,15].
Our results agree with findings observed by Leta et al. [12]. They found a slightly lower frequency of constipation in two cohorts (32.1% and 32.3%), but as in our cohort, constipation was related to disease severity and patients from both cohorts were de novo PD. As we observed, PD patients with constipation from NILS and PPMI cohorts presented in general with a worse motor and non-motor status and with a greater global NMS burden compared to patients without constipation. Also, as we observed, constipation was associated with age but not with time since motor symptoms onset. Severe constipation was associated with PD disease severity in other studies [16]. However, and unlike our findings, Leta et al. did not find differences in cognition at baseline between the two groups, patients with and without constipation. We used the PD-CRS scale whereas the MMSE and MOCA test were used for assessing cognition in NILS and PPMI cohorts, respectively. The PD-CRS is a sensitive screening measure which covers several cognitive domains, has high reliability and responsiveness, and is very sensitive and specific for detection of dementia and reasonably sensitive and specific for MCI [37]. Importantly, the MMSE is not as sensitive to detect cognitive problems as the PD-CRS [19, 37] and proof of this is that in our study up to more than 5% of the patients who presented at baseline a MMSE score ≥26 presented in the PD-CRS a score below the cut-off point for dementia.
The presence of constipation was not only associated with a poorer cognitive status at baseline inour cohort, but also with the development of cognitive impairment after 2-year follow-up even after adjusting to other covariates including cognitive status at baseline. Our results are in line with a recent study published by Jones et al. [7], who found thatmore severe gastrointestinal symptoms (constipation,hard stools, and involuntary loss of stools) were predictive of a less favorable trajectory of performance on tests of letter fluency, visuospatial, learning and memory. In our cohort, PD patients with constipation impaired significantly at 2-year follow-up in sustained attention, working memory, alternating verbal fluency, and action verbal fluency, and specifically in working memory and alternating verbal fluency compared to patients without constipation. Although constipation was more frequent in patients with both frontal-subcortical and posterior cortical cognitive dysfunction at baseline, patients with constipation impaired after 2-year follow-up in the fronto-subcortical but not in the posterior-cortical domain (a trend of significance) compared to those without constipation. Since frontal-executive dysfunction evolves independently with a more dopaminergic basis and better prognosis [38], studies for identifying better the pattern of cognitive dysfunction in relation to the presence of constipation and the risk of developing dementia in the long-term are necessary. However, not only the presence of constipation but also its severity is relevant. Using the MDS-UPDRS constipation item, Camacho et al. [15] found a significant relationship between constipation severity and progression to dementia. Contrary to this finding, we failed to demonstrate a relation-ship between constipation severity and cognitive impairment in our cohort, something that could be partly related to the limitations of the scale used to quantify the severity of constipation and the small sample of PD patients with the greatest constipation severity. On the other hand, Kong et al. [13] reported that REM sleep behavior disorder (RBD), independently and in combination with constipation, was related with the cognitive domains, namely processing speed and attention in men, suggesting that RBD, constipation, and cognitive impairment affecting processing speed and attention domains may be attributed to a similar neurodegenerative process, particularly in men. We also identified RBD as a predictor of cognitive decline in our cohort, which could support this hypothesis and the need for screening patients with PD for RBD [39].
Findings from the current study suggest a relationship between gut-health and cognitive functioning among individuals with PD. Regarding possible mechanisms underlying the relationship between cognitive functioning and gastrointestinal symptoms, some authors have suggested that gastrointestinal symptoms reflect longstanding disruption of gut microbiota [13, 40]. PD-related gut microbiotadysbiosis might lead to the impairment of short-chain fatty acids producing process, lipid metabolism, im-munoregulatory function, and intestinal permeability, which contribute to the pathogenesis of PD [41, 42] and subsequently lead to increased neuroinflammation and degeneration of neural systems important for cognitive functioning. Cognitive functions hypothetically could improve with restoration of the gut-microbiota environment [8]. Indeed, improvement in some cognitive functions after treatment with prebiotics and/or probiotics in previous animal models studies [9–11] suggest that a disrupted gut-microbial environment may create an imbalance of pro-inflammatory vs. anti-inflammatory cytokines that induces potentially reversible cognitive impairments [7, 41]. Unfortunately, direct measure of microbiota composition and its function are not available in the current study and neither other recent studies linking constipation with cognitive impairment in PD patients [12–14]. Contrary to the hypothesis of pro-inflammatory response as part of the PD-related gut microbiota dysbiosis [42], we did not find differences in inflammatory SB between PD patients with and without constipation. A correlation between serum IL-10 levels and gastrointestinal symptoms has been reported [43], but we only assessed IL-1, IL-2 and IL-6 but not IL-10 in our subjects. However, we found higher serum levels of methylmalonic acid and homocysteine in PD patients with constipation. Elevated plasma homocysteine concentrations have been associated with dementia, depression, and dyskinesia in PD patients [44]. Importantly, it has been demonstrated in mice that hyperhomocysteinemia decreases intestinal motility leading to constipation [45], suggesting a possible connection between cognition and constipation regarding homocysteine. Increase microbial production of homocysteine and folate deficiency in the gut communities of levodopa naïve patients with PD has been reported [46]. Hyperhomocysteinemia is considered a risk factor for the development of cognitive impairment and plasma hyperhomocysteinemia is significantly associated with some aspects of cognitive function in PD and may represent a treatable risk factor for cognitive decline in PD [47]. However, neither methylmalonic acid, homocysteine, nor any other SB was a predictor of cognitive decline in our cohort. SB were not analyzed in other studies [7, 12–14].
Regarding limitations, the current study was a secondary data analysis of the COPPADIS cohort. Analyses were limited in the number of cognitive tests/domains available. As it has been previously commented, diagnosis and grading severity of constipation was according to the item 21 of the NMSS at baseline, and specific criteria, such as Roma IV Diagnostic Criteria for Constipation, were not used. Also, non-PD related causes of constipation such as diet or dehydration were not taken into consideration. Moreover, the sample is heterogeneous and 10.4% of the patients were younger than 50 years old at baseline. However, similar results in linear and binary models were obtained (data not shown) when the analysis were conducted only in PD patients ≥50 years old at baseline. RBD was defined according to the neurologist’s impression after asking to the patients for typical symptoms but specific criteria or test were not used. The follow-up period may not be long enough to draw clearer conclusions. On the contrary, and unlike the recent published studies that relate cognitive impairment to constipation in PD [7, 13], our study includes a control group (N = 125) and the determination of serum molecular markers in patients (N = 225) and controls (N = 65).
In conclusion, the present study observes an impaired cognitive status in PD patients with constipation compared to patients without constipation but not in controls. Cognitive decline after 2-year follow-up is also observed in patients with constipation, being constipation an independent predictor of cognitive impairment. Higher serum levels of methylmalonic acid and homocysteine could be related to constipation.
Footnotes
ACKNOWLEDGMENTS
We would like to thank all patients and theircaregivers who collaborated in this study. Many thanks also to Fundación Española de Ayuda a laInvestigación en Parkinson y otras Enfermedades Neurodegenerativas (Curemos el Parkinson; www.curemoselparkinson.org), Alpha Bioresearch (www.alphabioresearch.com), and other institutions helping us.
CONFLICT OF INTEREST
The authors have no conflict of interest to report.
Adarmes AD, Almeria M, Alonso Losada MG, Alonso Cánovas A, Alonso Frech F, Alonso Redondo R, Álvarez I, Álvarez Sauco M, Aneiros Díaz A, Arnáiz S, Arribas S, Ascunce Vidondo A, Aguilar M, Ávila MA, Bernardo Lambrich N, Bejr-Kasem H, Blázquez Estrada M, Botí M, Borrue C, Buongiorno MT, Cabello González C, Cabo López I, Caballol N, Cámara Lorenzo A, Canfield Medina H, Carrillo F, Carrillo Padilla FJ, Casas E, Catalán MJ, Clavero P, Cortina Fernández A, Cosgaya M, Cots Foraster A, Crespo Cuevas A, Cubo E, de Deus Fonticoba T, de Fábregues-Boixar O, Díez-Fairen M, Dotor García-Soto J, Erro E, Escalante S, Estelrich Peyret E, Fernández Guillán N, Gámez P, Gallego M, García Caldentey J, García Campos C, García Moreno JM, Gastón I, Gómez Garre MP, Gómez Mayordomo V, González Aloy J, González-Aramburu I, González Ardura J, González García B, González Palmás MJ, González Toledo GR, Golpe Díaz A, Grau Solá M, Guardia G, Hernández Vara J, Horta-Barba A, Idoate Calderón D, Infante J, Jesús S, Kulisevsky J, Kurtis M, Labandeira C, Labrador MA, Lacruz F, Lage Castro M, Lastres Gómez S, Legarda I, López Ariztegui N, López Díaz LM, López Manzanares L, López Seoane B, Lucas del Pozo S, Macías Y, Mata M, Martí Andres G, Martí MJ, Martínez Castrillo JC, Martinez-Martin P, McAfee D, Meitín MT, Menéndez González M, Méndez del Barrio C, Mir P, Miranda Santiago J, Morales Casado MI, Moreno Diéguez A, Nogueira V, Novo Amado A, Novo Ponte S, Ordás C, Pagonabarraga J, Pareés I, Pascual-Sedano B, Pastor P, Pérez Fuertes A, Pérez Noguera R, Planas-Ballvé A, Planellas L, Prats MA, Prieto Jurczynska C, Puente V, Pueyo Morlans M, Puig Daví A, Redondo Rafales N, Rodríguez Méndez L, Rodríguez Pérez AB, Roldán F, Ruíz De Arcos M, Ruíz Martínez J, Sánchez Alonso P, Sánchez-Carpintero M, Sánchez Díez G, Sánchez Rodríguez A, Santacruz P, Santos García D, Segundo Rodríguez JC, Seijo M, Sierra Peña M, Solano Vila B, Suárez Castro E, Tartari JP, Valero C, Vargas L, Vela L, Villanueva C, Vives B, Villar MD.