
Abstract
Background:
Movement execution is impaired in patients with Parkinson’s disease. Evolving neurodegeneration leads to altered connectivity between distinct regions of the brain and altered activity at interconnected areas. How connectivity alterations influence complex movements like drawing spirals in Parkinson’s disease patients remains largely unexplored.
Objective:
We investigated whether deteriorations in interregional connectivity relate to impaired execution of drawing.
Methods:
Twenty-nine patients and 31 age-matched healthy control participants drew spirals with both hands on a digital graphics tablet, and the regularity of drawing execution was evaluated by sample entropy. We recorded resting-state fMRI and task-related EEG, and calculated the time-resolved partial directed coherence to estimate effective connectivity for both imaging modalities to determine the extent and directionality of interregional interactions.
Results:
Movement performance in Parkinson’s disease patients was characterized by increased sample entropy, corresponding to enhanced irregularities in task execution. Effective connectivity between the motor cortices of both hemispheres, derived from resting-state fMRI, was significantly reduced in Parkinson’s disease patients in comparison to controls. The connectivity strength in the nondominant to dominant hemisphere direction in both modalities was inversely correlated with irregularities during drawing, but not with the clinical state.
Conclusion:
Our findings suggest that interhemispheric connections are affected both at rest and during drawing movements by Parkinson’s disease. This provides novel evidence that disruptions of interhemispheric information exchange play a pivotal role for impairments of complex movement execution in Parkinson’s disease patients.
INTRODUCTION
Parkinson’s disease is a neurodegenerative disorder characterized by severe motor and nonmotor symptoms [1, 2]. Apart from the cardinal motor symptoms bradykinesia, rigidity, and tremor, complex motor skills like handwriting and drawing are impaired [3, 4]. While handwriting requires a high amount of cognitive, semantic, or lexical components [5], drawing spirals is independent from language skills [3]. Previous research revealed characteristics of deficient drawing in Parkinson’s disease applying linear measures: patients display increases in normalized jerk, pen altitude variations, the number of velocity and acceleration peaks, and enhanced velocity fluctuations [3, 7]. First order crossing and second order smoothness, indicating spatial irregularities, as well as the degree of severity of spiral drawings correlate with the motor section of the Unified Parkinson’s disease Rating Scale (UPDRSIII) scores and are sensitive to disease severity [8]. Irregularities in the temporal coordination of movement, on the other hand, have less been studied. Furthermore, drawing is governed by complex, dynamic, and nonlinear processes that occur across multiple temporal and spatial scales [9, 10]. Extending traditional analyses, nonlinear parameters might provide additional insights into motor impairment. We aimed to examine whether patients exhibit enhanced irregularities in the temporal organization of drawing spirals. To this end, we calculated sample entropy of velocity and acceleration, a nonlinear parameter that has been applied to biological signals like EEG, EMG, center of pressure during gait, or graphic movements in physiologic and diseased conditions, including Parkinson’s disease [11–14]. Sample entropy examines time-series for similar epochs to quantify their regularity [15].
Another aspect of Parkinson’s disease concerns the asymmetrical distribution of motor impairment between both sides of the body, which is most clearly pronounced at disease onset but pertains almost over the entire disease course [16, 17]. No equivocal pivotal hypotheses for asymmetric pathology and motor impairment exist [18]. The coexistence of bradykinesia and asymmetry markedly influence functional impairment and could represent the basis for the development of further symptoms like gait and speech impairments, postural deficits, and axial symptoms with lateral inclination [19, 20]. To see if drawing skills are also asymmetrically impaired, our second aim was to examine whether enhanced irregularities manifest differently within the more and less affected sides of the body.
The neural mechanisms underlying deficits in graphomotor tasks and asymmetrical impairment are not understood. Several studies revealed regions and networks that engage during graphic movements in healthy participants with the aid of MRI-compatible tablets during task-related functional MRI (fMRI) [5, 22]. While some regions specifically engage during writing, others are associated with linguistic processing, and particularly regions of the cortico-basal ganglia network control nonspecific motor execution [23]. Interregional communication in this network, measured by functional or effective connectivity, is impaired in Parkinson’s disease: during task execution, for example, Wu et al. [4] showed that consistent micrographia relates to decreased activity and diminished functional connectivity in the motor-circuit. Similarly, Nackaerts et al. [24] found that letter size correlates with reduced effective connectivity in cortical networks in patients concurrently affected by freezing of gait and micrographia. As opposed to letter size, which measures movement amplitude and relates to bradykinesia, a potential relationship between connectivity and movement irregularities in drawing as a distinct dimension of impairment remains elusive. Furthermore, widespread alterations of connectivity in Parkinson’s disease are also evident in the absence of a specific task and correlate with disease severity [25–27]. Luo et al. [28] demonstrated that alterations further extend towards interhemispheric communication between bilateral M1 areas. Impairments in network communication during rest could impede flexible information processing in response to current and prospective demands, as suggested by Bressler and Kelso [29], or could be indicative of disturbed processes in task-relevant pathways. Since it was previously shown that resting state connectivity is relevant for task activities and motor impairment [28, 30–32] an important and unresolved issue is how altered interregional connectivity during rest, as an indicator of disease state, disconnection, or pathological spread, relates to graphomotor performance. We investigated whether impairments in drawing spirals are associated to alterations in effective connectivity within the cortico-basal ganglia network including interhemispheric connections during rest. We calculated the time-resolved partial directed coherence (TPDC) of resting-state fMRI to identify regions that demonstrate altered effective connectivity when comparing medicated Parkinson’s disease patients with age-matched healthy participants [33]. Compared to functional connectivity measures, effective connectivity quantitatively reveals directions of interactions between regions and thus identifies the direction and strength of communication [34–36]. We correlated the strength of resting-state TPDC between these regions with the amount of irregularities in spiral drawing. To investigate whether altered connectivity during rest represents pathological mechanisms that extend to task-related processing, we finally examined whether a similar relationship exists for effective connectivity determined by EEG recorded during the drawing task.
In sum, we investigated whether Parkinson’s disease patients show an increased amount of temporal irregularities during spiral drawing. Furthermore, we expected deteriorated communication between regions among the cortico-basal ganglia network during resting-state fMRI and hypothesized that a high extent of deterioration is associated with reduced drawing performance. To evaluate if this extends to task-related processing, we additionally calculated the effective connectivity of the EEG recorded during spiral drawing.
MATERIALS AND METHODS
Participants and study protocol
Participants were recruited at the Department of Neurology, University Medical Centre of the Johannes Gutenberg University Mainz. In total, 32 Parkinson’s disease patients and 31 age-matched healthy control subjects participated in our study. The diagnosis of Parkinson’s disease was based on the Movement Disorder Society Clinical Diagnostic Criteria for Parkinson’s disease [37]. Demographics and disease related information are presented in Table 1. To evaluate graphomotor performance in a realistic functional setting with high external validity and to allow for comprehensive task execution, the Parkinson’s disease group was tested using their medication according to their usual schedule. In a first session, participants drew Archimedean spirals (Fig. 1), and EEG brain activity was recorded concurrently. In a second session, anatomical and resting-state functional MRI were recorded. Due to co-existing action tremor, three patients were excluded from our study, leaving 29 patients and 31 controls for statistical analyses.
Participant demographics and clinical information
N, number of participants; UPDRSIII, motor section of the revised Unified Parkinson’s Disease Rating Scale; *Mean (standard deviation); 1Data only available for 27 PD patients.
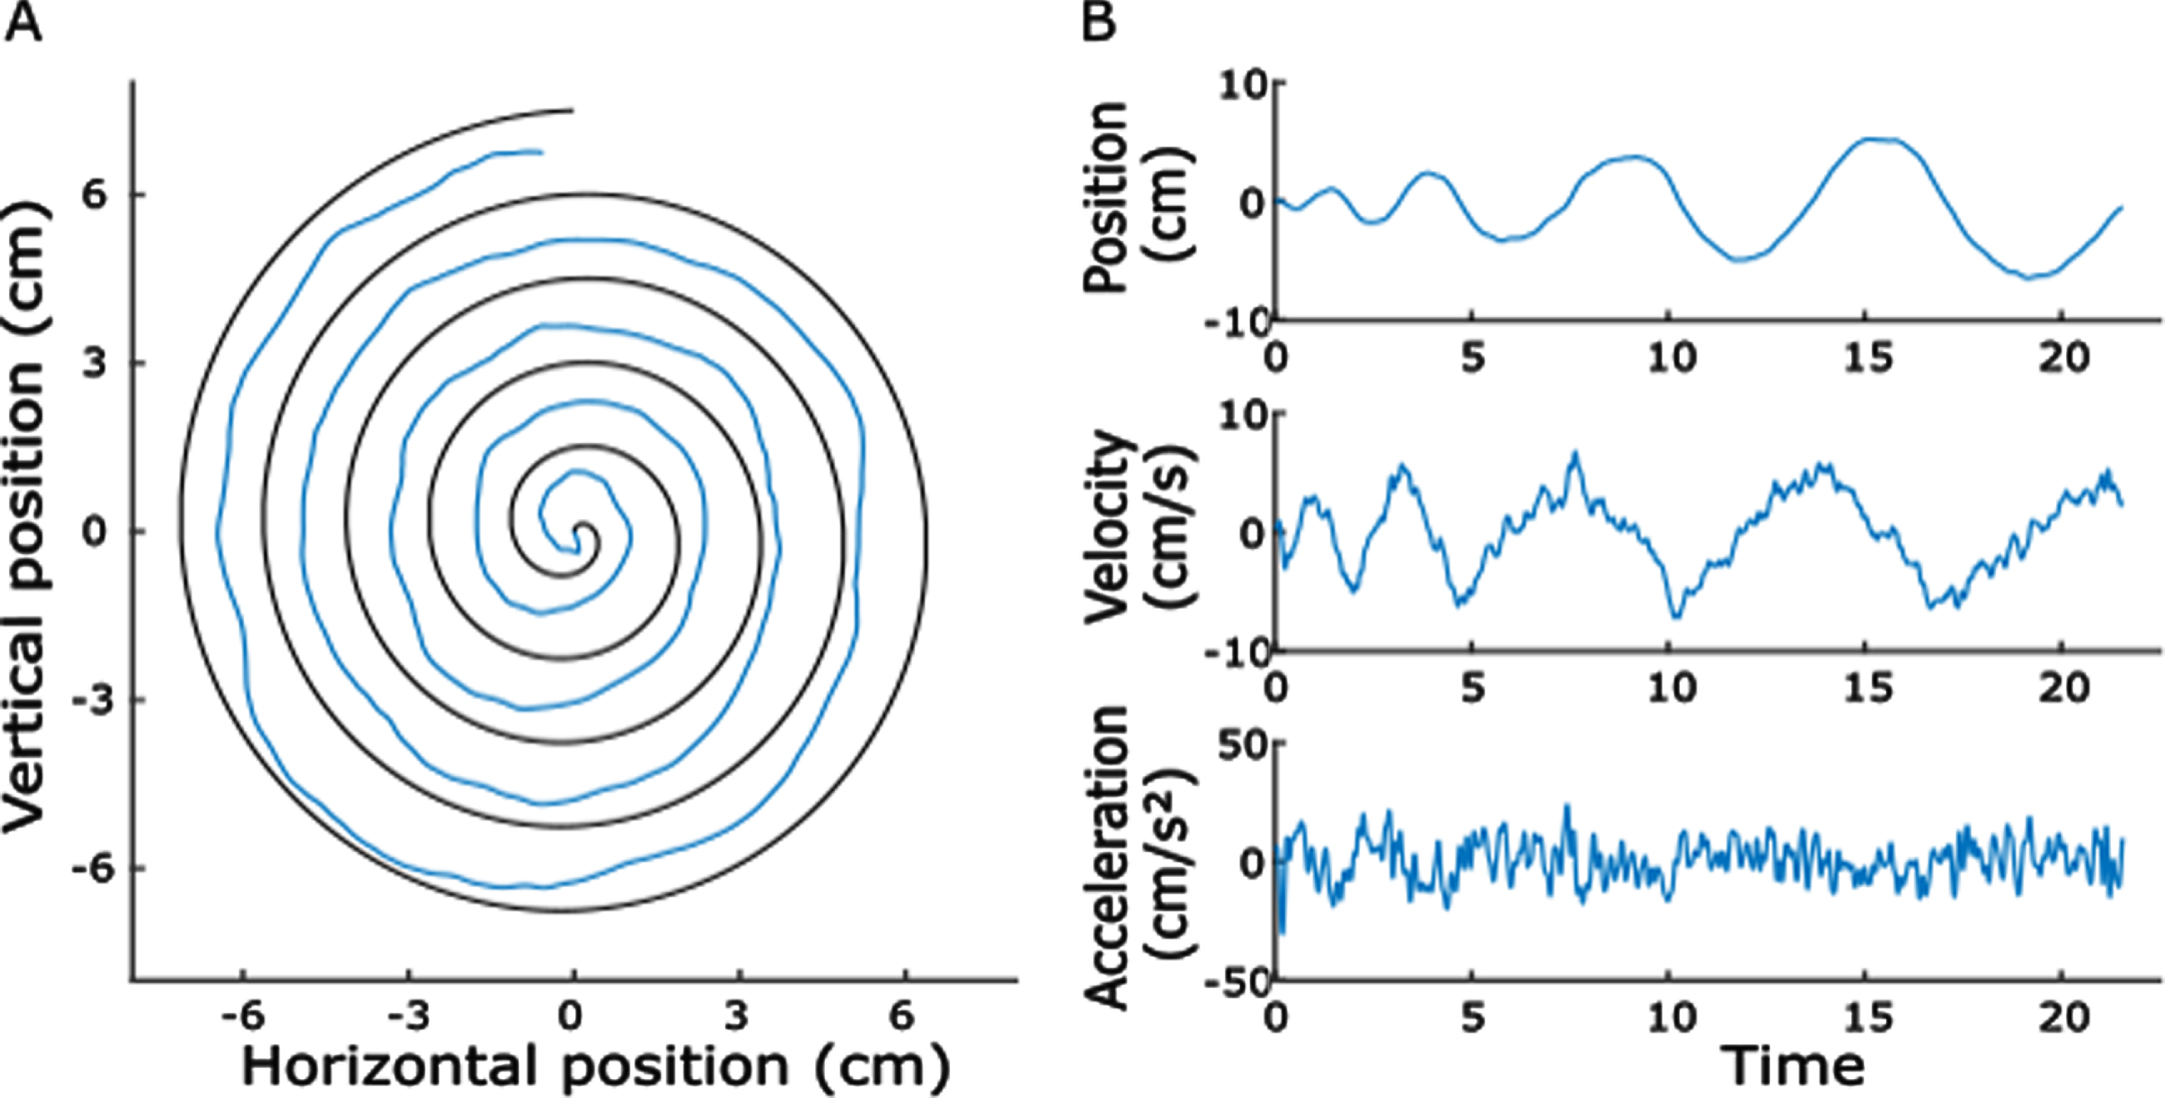
Example of a spiral drawn by a Parkinson’s disease patient and its kinematics. A) The blue line represents the drawn trace within the boundaries of the template. B) Horizontal pen position, velocity, and acceleration plotted against time.
Written informed consent was obtained from all subjects before participating in this study that was approved by the local Ethics Committee of the State Medical Association of Rhineland-Palatinate and has been conducted in accordance with the principles of good clinical practice of the Declaration of Helsinki.
Graphomotor task
Spiral drawing
Archimedean spirals were drawn on predefined templates (five loops, maximal radius = 7.5 cm, spacing = 1.5 cm; Fig. 1A). Participants comfortably sat in front of a table and used a wireless inking pen to draw the spirals on a sheet of paper (DIN A4 format: 21.0×29.7 cm) which was affixed to the surface of a digital tablet (Wacom Intuos Pro –Creative Pen Tablet, size L, resolution = 5080 lpi, maximal sample rate 200 Hz, pressure sensitivity = 2048 levels, Wacom Technology Corporation, Vancouver, WA). This setup has the possibility of storing kinematic time-series data for offline analyses. The experimenter (M.B.) instructed the participants before the task to sit with their shoulders in parallel to the lower side of the tablet and draw the spirals at their own drawing speed, starting from the center outwards without touching or crossing the boundaries of the template and without resting the arm or hand on the tablet. Subjects held the pen in the air and started to draw when the experimenter gave a verbal “go”-command. Five trials were performed for the right and left hand, each. The spirals were to be drawn clockwise (right hand) or counter-clockwise (left hand) and the experimenter demonstrated an example of task execution before the first trial.
Spiral analysis
We recorded kinematic time-series data using the free software Neuroglyphics (http://www.neuroglyphics.org/). Positional X- and Y-signals were exported to Matlab (The MathWorks, version R2017a) for further processing. A fourth-order 10 Hz low-pass Butterworth filter was applied to smooth the signal and reduce artefacts [3]. Instantaneous horizontal velocity and acceleration were calculated using the kinematics toolbox (http://www.diedrichsenlab.org/toolboxes/toolbox_kinematics.htm). The velocity signals were filtered using a second-order Gaussian Kernel filter, while acceleration signals were filtered with a fourth-order Gaussian Kernel filter. Due to the constraint of not touching the tablet, spiral-drawing was mainly performed by wrist and forearm movements, while the fingers were fixated to hold the pen. Since fine motor abnormalities may be caused by a reduced capability to coordinate finger and wrist movements and by reduced control of wrist flexion [6], and the wrist mainly contributes to horizontal movements, we focused our analysis on horizontal strokes. The analyses for vertical movements can be seen in Supplementary Table 2.
The velocity signal, starting from the first sample when the pen touched the tablet, was z-scored and movement onset was defined when the signal exceeded 0.5 standard deviations. To confirm the correct onset, all trials were visually checked and corrected, if necessary. Figure 1 shows a representative trial of a Parkinson’s disease-patient. We then calculated drawing duration, average velocity, average acceleration and sample entropy of the velocity and acceleration signals as indices of motor performance. Sample entropy estimates the regularity of a time-series and was calculated with the Matlab function “SampEn” (Lee, 2020; https://de.mathworks.com/matlabcentral/fileexchange/35784-sample-entropy/). For a time-series with N data points, sample entropy is the negative logarithm of the conditional probability that two sequences with the length of m data points, which are similar, remain similar when extending the sequence by one additional sample. The tolerance for similarity is defined as the maximum vector distance r. Lower values of sample entropy correspond to higher regularity within the time-series [15]. We chose the window length m = 2 and tolerance r = 0.2*SD [38, 39].
Because Parkinson’s disease can affect both hemispheres of the body differently [17], we also investigated whether the more severely affected hand (as identified by clinical evaluation) would be more severely affected in drawing performance. We calculated the difference of sample entropy for each patient by subtracting the nondominant hand value from the dominant hand value. While negative values indicate that sample entropy is lower for the dominant hand, positive values mean that it is increased. Values close to zero indicate that the entropy is similar in both tasks.
Magnetic resonance imaging
MRI data acquisition and pre-processing
We acquired anatomical and resting-state fMRI recordings of all participants. Subjects were instructed to keep their eyes closed, to not think of anything in particular, and to remain motionless inside the MRI scanner. MRI data acquisition was performed on a 3 Tesla scanner (Magnetom Tim Trio, Siemens Healthcare, Erlangen, Germany) with s 32-channel receive-only head coil. Earplugs were used to attenuate scanner noise and head motion was restricted with a foam pillow and foam padding. High-resolution anatomical images were acquired with 3D-MPRAGE sequence (TR = 1900 ms, TE = 2.52 ms, flip angle = 9°, field of view (FOV) = 256×256 mm2, 192 axial slices, 1 mm thickness, bandwidth 170 Hz/pixel). Blood-oxygen-level dependent (BOLD) data were acquired using a gradient echo (GR)-EPI sequence (TR = 3000 ms, TE = 30 ms, flip angle = 90°, field of view (FOV) = 192×192 mm2, matrix size = 64×64, spatial in-plane resolution: 3 mm, 49 slices with a slice thickness of 2 mm and an inter-slice gap of 1 mm, readout bandwidth (BW) = 2232 Hz/pixel). The scan duration was 10 min, resulting in a series of 200 volumes.
Pre-processing of fMRI scans and time series extraction were performed using statistical parametric mapping toolbox (SPM12; https://www.fil.ion.ucl.ac.uk/spm/software/spm12/) and REST toolbox (V1.8_130615; http://www.restfmri.net [40]). For each subject the first five images were discarded to ensure that the fMRI signal was at equilibrium and the remaining 195 images were realigned to the first image, co-registered to the high-resolution individual T1 image, segmented, and spatially normalized to align all the subjects’ specific MR sequences into the standard Montreal Neurological Institute (MNI) space. Root mean squared (RMS) movement of three translation and three rotation parameters was calculated to evaluate head motion and no participant had movement > 0.5 mm RMS [41]. We then applied a linear model approach on a voxel-by-voxel basis to remove the effects of the six movement parameters to control for motion effects.
Effective connectivity analysis
For the effective connectivity analysis, we extracted the averaged time-series of individual intra-hemispheric primary motor cortex (M1), supplementary motor area (SMA), caudate, putamen, external part of the globus pallidus (GPe), internal part of the globus pallidus (GPi), and subthalamic nucleus (STN) (Supplementary Figure 1). The definition was based on the Human Motor Area Template [42] and Basal Ganglia Human Area Template [43], and these regions were chosen because they are both part of the motor-basal ganglia network and involved in the peripheral motor control of graphic movements [23]. Time-series were filtered using a fourth-order Butterworth filter with a high-pass-frequency of 0.009 Hz and low-pass-frequency of 0.08 Hz [44]. Based on these regions we modelled a cortico-basal ganglia network where effective connectivity between each pair of the seven regions within each hemisphere was calculated using TPDC. We additionally calculated effective connectivity between homologue regions (for example left and right M1). The TPDC provides a model for time-frequency causality which allows to not only focus on a particular frequency but also on its temporal evolution [45]. It is based on dual-extended Kalman filtering, which estimates instantaneous state- and model- (i.e., the weights) parameters of an autoregressive system [35, 46]. Those coefficients are used to calculate the partial directed coherence for every time point, which estimates the causality between time-series [33]. The mean region-to-region connectivity during rest fMRI was estimated by taking the TPDC amplitudes for frequencies between 0.009 Hz and 0.08 Hz between all combinations of regions of interest (ROIs) within each hemisphere, and additionally their homologue regions.
EEG analysis
We recorded EEG data with a high-density 256 EEG-system during spiral drawing with a sampling frequency of 1000 Hz and CZ as reference. We used the fieldtrip Matlab toolbox for further processing [47]. Based on the findings of fMRI resting-state analysis (see results), we calculated the effective connectivity between electrodes covering the left and right M1 (c3, c4) during task execution. Data were re-referenced to a linked mastoids montage, resampled at 250 Hz, and filtered (sixth-order Butterworth filter: 4 Hz high-pass, 90 Hz low-pass, 45–55 Hz band-stop). Average spectral power of beta and gamma frequency bands was calculated with the “ft_freqanalysis”-function implemented in fieldtrip (mtmfft, hanning window, window length: 1 s) and compared between the two groups to check for potential artefact-related differences. There was no significant difference between the two groups (Supplementary Table 1). Given the relevance of beta and gamma oscillations for Parkinson’s disease [48–50], we calculated the average TPDC for these frequency bands (beta: 13–30 Hz, gamma: 31–45 Hz). The order parameter for TPDC was defined by the ARfit function (Tapio, 2020, https://de.mathworks.com/matlabcentral/fileexchange/174-arfit). Finally, we averaged over all trials of each subject for the correlation analysis.
Statistical analysis
All statistical analyses were performed using IBM SPSS Statistics, Version 22.0 (SPSS, Chicago, IL, USA) and Matlab (Version R2017a). Means and standard deviations (SD) were calculated. Demographic characteristics of Parkinson’s disease patients and healthy controls were compared using Fisher’s exact test for categorical data or independent t-tests.
To investigate graphomotor performance, the first trial was removed from the analysis to prevent the influence of the tasks’ novelty and the average of the remaining four trials was calculated for each individual. Normality was assessed visually and by evaluating skewness and kurtosis for each parameter and each group individually. In those cases in which the assumption of normality was not met, data were log-transformed [51]. This was the case for drawing duration and sample entropy of velocity. We then performed two-factorial mixed ANOVAs with “Group” as between-subject factor (Parkinson’s disease (N = 29) vs healthy controls (N = 31)) and “Task” as within-subject-factor (drawing with the dominant vs nondominant hand). To investigate whether hemispheric asymmetries in disease expression differentially affect spiral drawing, we further calculated the difference between dominant and nondominant hand performance and performed independent t-tests between the two subgroups of patients whose dominant hand was more affected (N = 19), and patients whose nondominant hand was more affected (N = 10) by Parkinson’s disease.
To identify connections that significantly differed in resting-state connectivity we performed independent t-tests between the groups for each pair of brain regions. False discovery rate (FDR)-correction was applied to control for false positives. To study whether handwriting performance could be associated with resting-state fMRI networks, we calculated the Pearson correlation coefficients between the TPDC values of connections that were identified to significantly differ between Parkinson’s disease patients and healthy controls and the entropy values (log-transformed when appropriate). Additionally, we performed Pearson correlation analyses between the spiral parameters and the TPDC values of the task EEG. As for the spiral analysis, we discarded the first trial of the EEG recordings. All correlations were performed separately for the PD and HC group, and Fisher r to z transformation was applied to compare the correlation coefficients between the two groups. Finally, we correlated TPDC of fMRI, TPDC of EEG, and entropy values with the UPDRSIII-scores (MDS-UPDRS, [52]). We termed the hemisphere contralateral to the dominant hand the dominant hemisphere, and the hemisphere ipsilateral to the dominant hand the nondominant hemisphere for all correlations. To accommodate for the high number of correlations, FDR-correction was applied for the comparisons within each modality. The significance threshold was set to p < 0.05 (two-tailed for ANOVAs and t-tests; one-tailed for correlation analyses). Effect sizes were calculated and interpreted as Cohen’s d (small: d s = 0.2, medium: d s = 0.5, and large: d s = 0.8) or partial eta squared (small: η2 p >0.01, medium: η2 p > 0.06, and large: η2 p > 0.14) according to Cohen [53].
Data availability
The data that support the findings of this study are available from the corresponding author, upon reasonable request.
RESULTS
We included data of 29 PD patients and 31 age-matched healthy control subjects. Demographics and disease related information are presented in Table 1. When evaluating the demographical variables, the two groups did not significantly differ in sex (Fisher’s exact test p = 0.451), handedness (Fisher’s exact test p = 0.229), or age (t = 0.985, df = 58, p = 0.329).
Spiral drawing analysis
To evaluate graphomotor performance, we calculated the drawing duration, average velocity, average acceleration, and the sample entropy of the horizontal velocity and acceleration signals. Due to nonnormality, drawing duration and sample entropy of the velocity were log transformed (see Supplementary Table 2 for nontransformed data). There were no significant differences between Parkinson’s disease patients and healthy controls for the log of drawing duration, average velocity, and average acceleration (all p > 0.05, Supplementary Table 2). Figure 2 shows the results of the mixed ANOVAs for sample entropy. As expected, there was a significant main effect of task on the log of entropy of velocity, demonstrating that the dominant hand displays significantly lower amount of irregularities (F(1,58) = 25.154, p
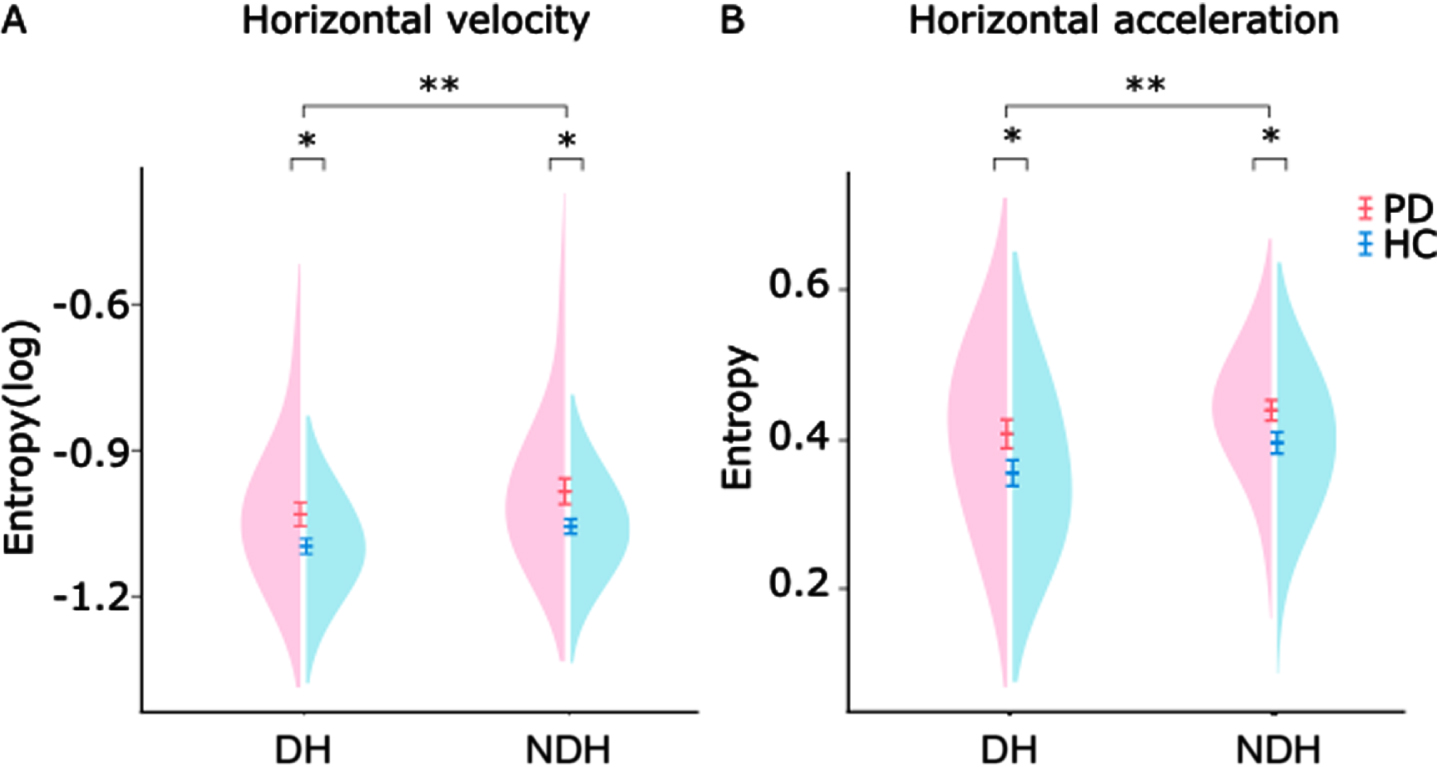
Distribution of sample entropy values of motor performance in patients (PD) and healthy controls (HC). A) Sample entropy of horizontal velocity of 29 patients (pink) and 31 controls (blue). Mixed ANOVAs revealed significant effects of task and group. B) Sample Entropy of horizontal acceleration of the same subjects. Mixed ANOVAs revealed significant effects of task and group. DH, dominant hand; NDH, nondominant hand; PD, Parkinson’s disease patients; HC, healthy controls. Error-bars denote standard error of the mean; *p < 0.05; **p < 0.0001.
We then investigated if there were differences in asymmetries between patients whose dominant hand is more affected and patients whose dominant hand is less affected (Supplementary Figure 2). The mean difference of sample entropy was negative in both patient subgroups (difference log sample entropy of velocity: –0.047±0.077 and –0.057±0.093; difference acceleration: –0.453±0.070 and –0.013±0.060), indicating that irregularities are enhanced in the nondominant hand, irrespective of which hand was more affected by the disease. For acceleration, patients whose dominant hand was less affected had values closer to zero. However, there was no statistical difference between the patient subgroups (velocity: t = 0.317, df = 27, p = 0.754; acceleration: t = –1.223, df = 27, p = 0.232). Finally, we did not find any significant correlations between the irregularity scores and the UPDRSIII scores (all p > 0.5, uncorrected).
Effective connectivity of resting-state fMRI
Our next aim was to identify connections that demonstrated altered effective connectivity when comparing medicated Parkinson’s disease patients with the healthy control-group. The TPDC analysis identified seven connections that significantly differed between Parkinson’s disease patients and healthy controls (Supplementary Table 3). However, after FDR-correction only the reduced interhemispheric connections from left M1 to right M1 (t = –3.4683, df = 58, p = 0.0487, corrected, 95%CI = [–0.074 –0.020], Cohen’s d s = 0.895) and right M1 to left M1 (t = –3.5135, df = 58, p = 0.0487, corrected, 95% CI = [–0.059 –0.016], Cohen’s d s = 0.915, Fig. 3) remained significant. None of the connections were correlated with the UPDRSIII scores (all p > 0.5, uncorrected).
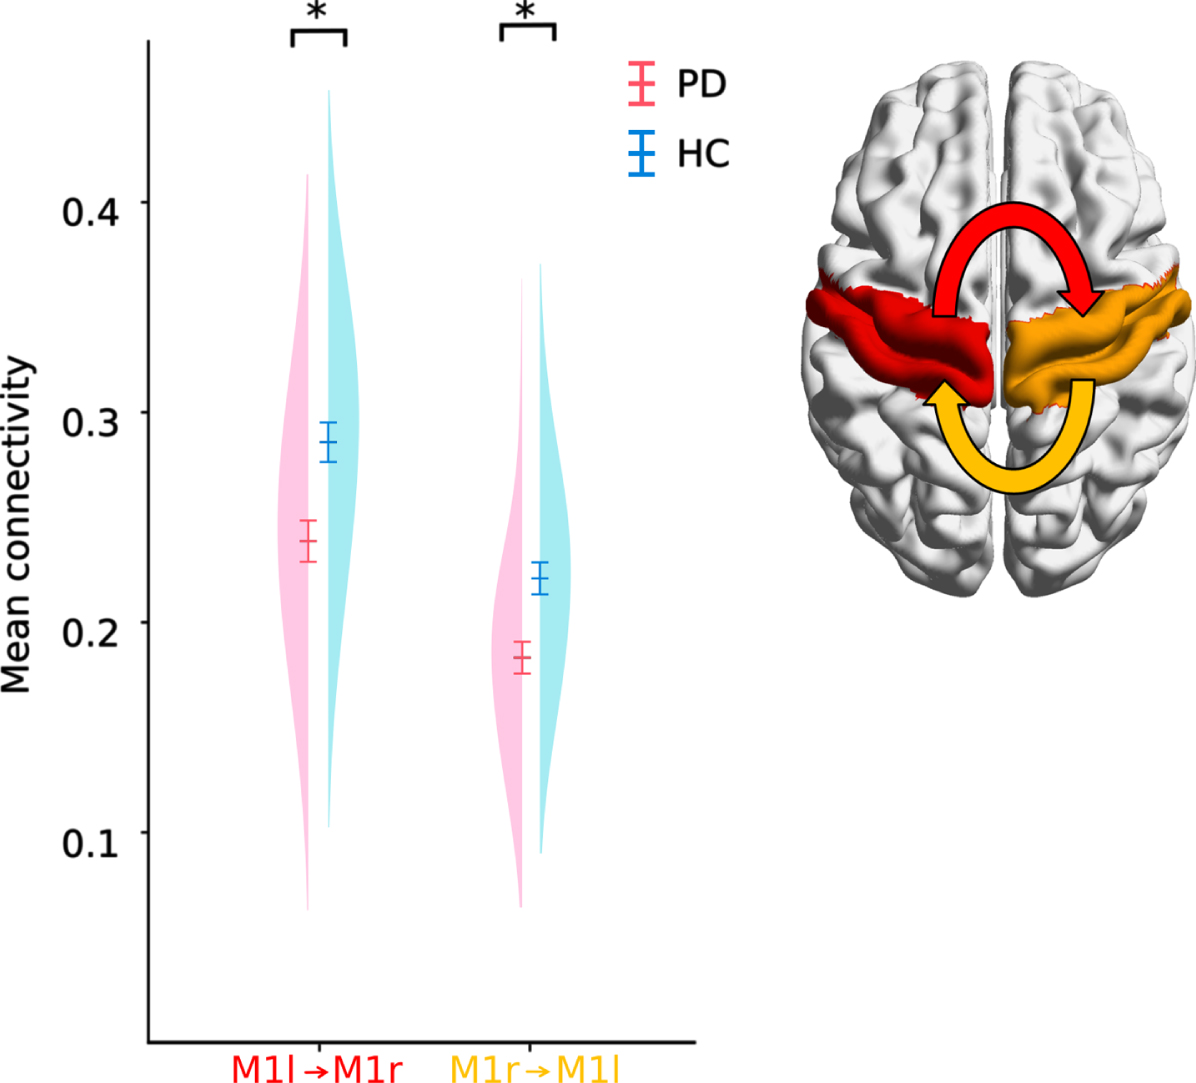
Distribution, mean and standard error of the TPDC of bilateral motor cortex areas. PD patients had reduced effective connectivity between left to right and right to left M1. *p < 0.05 (corrected).
The interrelation of resting fMRI effective connectivity measurements and task performance
To examine the functional relevance of impaired interhemispheric connectivity, we then investigated the associations between the TPDC values of the connections identified in the fMRI analysis and the entropy of velocity (log) and acceleration (Fig. 4). While there were no significant correlations in the healthy control group, we found significant negative correlations between the connectivity of the nondominant to dominant M1 and the log of sample entropy of the velocity signal of drawing both with the dominant (r = –0.447, p = 0.03, corrected) and nondominant hand (r = –0.513, p = 0.018, corrected) in Parkinson’s disease patients. This means that patients with lower interhemispheric connectivity concurrently had more irregularities during drawing. The Fisher’s test for comparing the correlations between the Parkinson’s disease- and healthy control groups showed a trend for different correlations between the groups (nondominant to dominant M1 with nondominant hand entropy (Fig. 5, z = 1.631, p = 0.051)). However, there was no significant difference between groups for the correlations of nondominant to dominant M1 connectivity with dominant hand entropy (z = 1.105, p = 0.135).
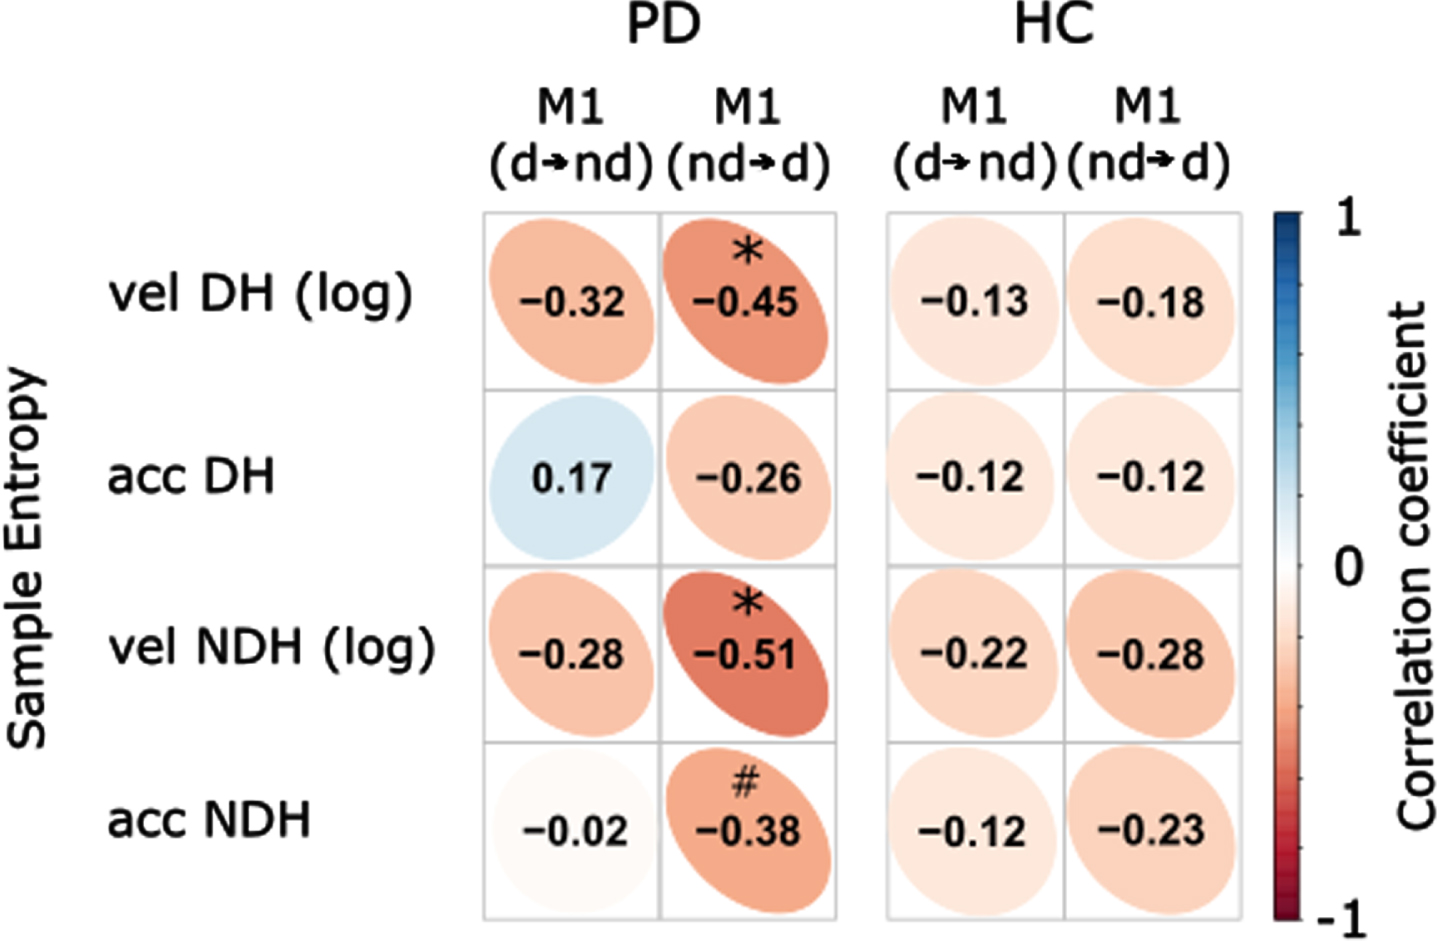
Correlation coefficients of resting-state fMRI effective connectivity between dominant and nondominant M1 and sample entropy. Significant inverse correlations were found between the connectivity of nondominant to dominant M1 and the sample entropy of the velocity signals during drawing with dominant as well as nondominant hand in PD patients. There was also a trend for the correlation between the connectivity of nondominant to dominant M1 and the sample entropy of the nondominant acceleration. Vel, velocity; acc, acceleration; d⟶nd, connectivity from dominant to nondominant M1; nd⟶d, connectivity from nondominant to dominant M1; DH, dominant hand; NDH, nondominant hand; PD, Parkinson’s disease patients; HC, healthy controls; Color bar represents the scale of correlation coefficient; *p < 0.05; #p < 0.1 (corrected).
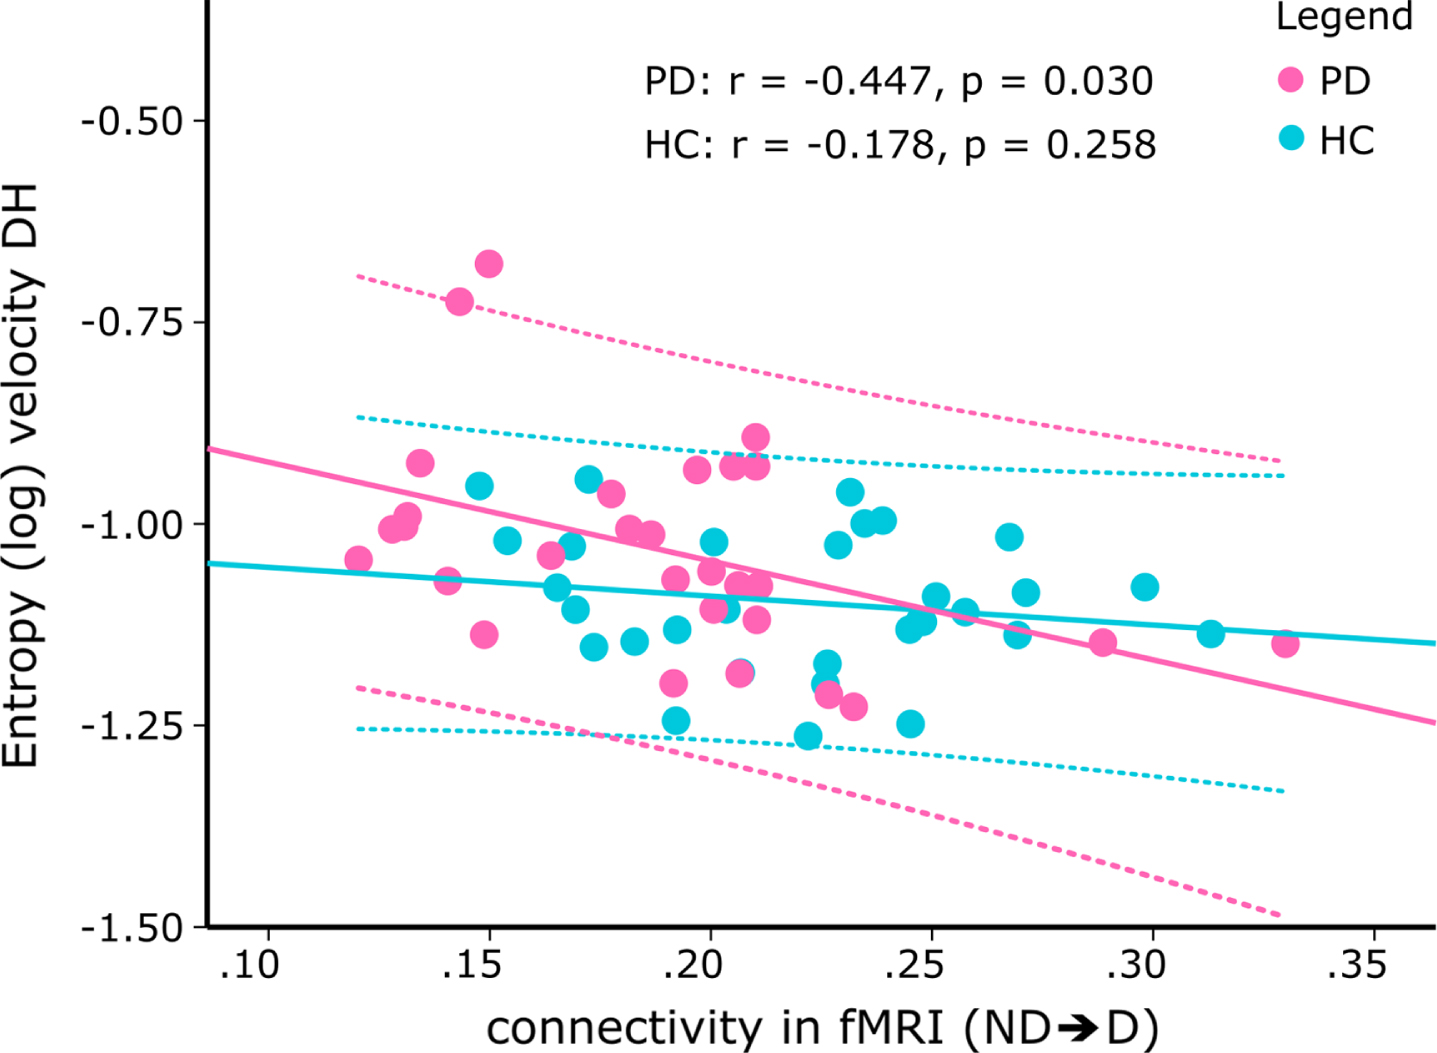
Scatterplot of the correlation between the effective connectivity from nondominant to dominant M1 during resting-state fMRI and the (log) entropy of the velocity during drawing with the dominant hand. While there was a significant inverse correlation in PD patients (pink; r = –0.447, p = 0.030, corrected), correlation was not significant in healthy controls (blue). The dotted lines denote the 95%confidence intervals of the correlation. ND⟶D, connectivity from nondominant to dominant M1; DH, dominant hand; PD, Parkinson’s disease patients; HC, healthy controls).
Correlation between task EEG effective connectivity and task performance
To investigate whether a similar relationship exists for task-related connectivity, we additionally examined the linear associations between the TPDC values of electrodes covering the dominant and nondominant M1 during both drawing tasks and the irregularity scores. There were no significant correlations in the healthy control group (Supplementary Figure 3). For Parkinson’s disease patients, the entropy of the acceleration during drawing with the dominant hand was inversely correlated with the connectivity from the nondominant to dominant M1 (Fig. 6, beta band: r = –0.461, p = 0.048, corrected; gamma band: r = –0.488, p = 0.047, corrected).
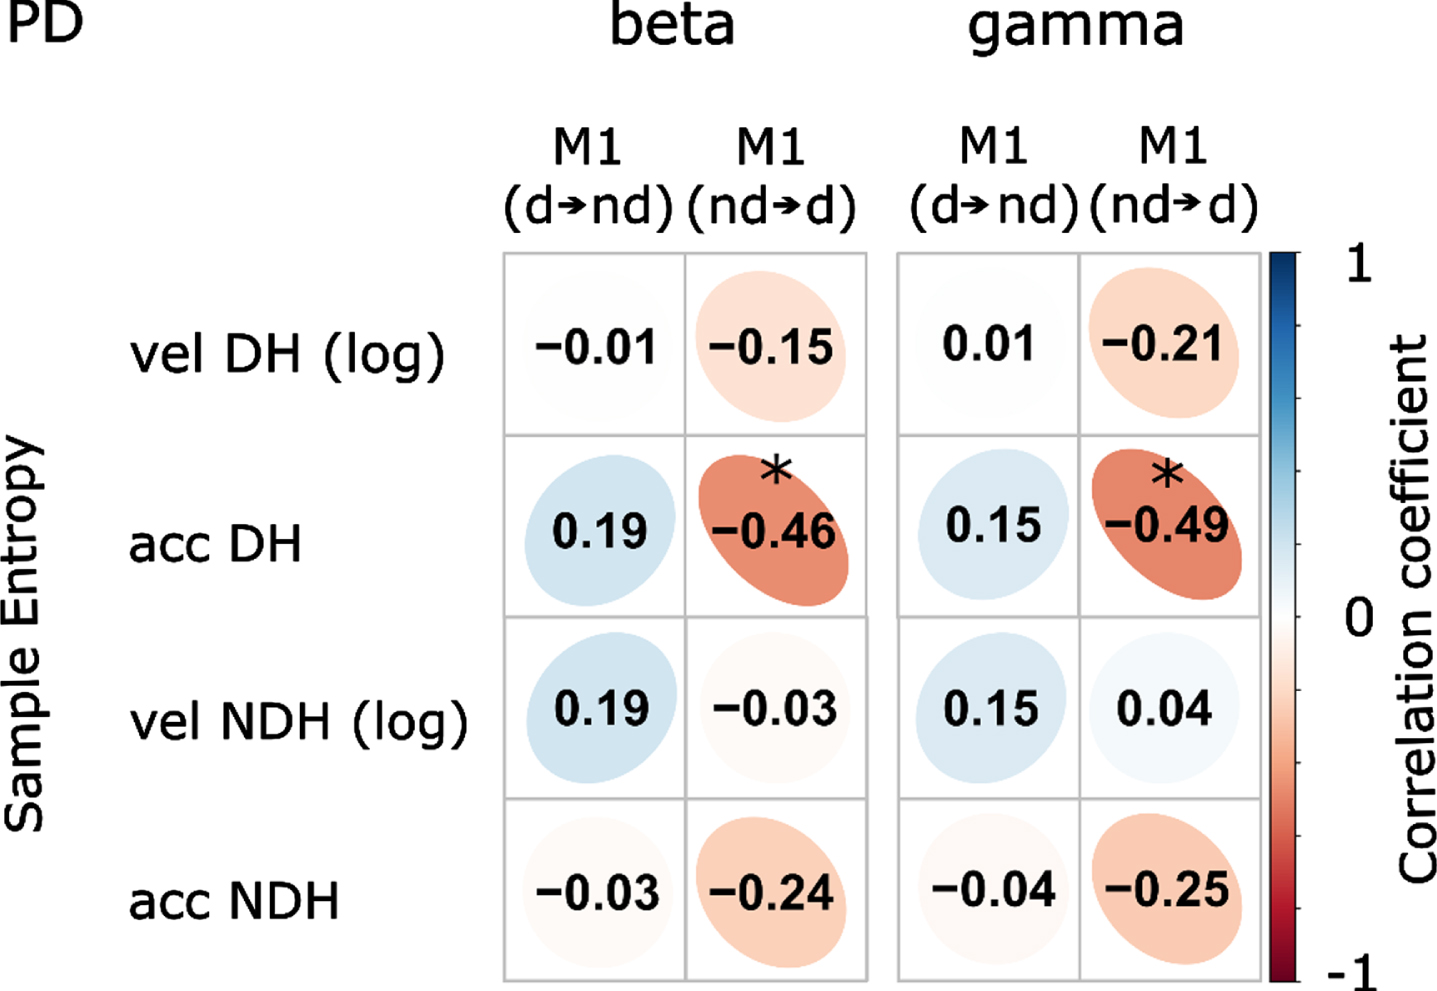
Correlation coefficients of motor performance and task-EEG effective connectivity in Parkinson’s disease (PD) patients. Significant inverse correlations were found between the entropy of acceleration during dominant hand drawing and the connectivity of electrodes covering the nondominant to dominant M1. vel, velocity; acc, acceleration; d⟶nd, connectivity from dominant to nondominant M1; nd⟶d, connectivity from nondominant to dominant M1; DH, dominant hand; NDH, nondominant hand; Color bar represents the scale of correlation coefficient; *p < 0.05 (corrected).
The Fisher test comparing the correlations between Parkinson’s disease patients and the healthy control group showed a trend for differing correlations in the beta band (Fig. 7, z = 1.462, p = 0.072) and in the gamma band (z = 1.534, p = 0.062). Correlation analyses between TPDC values of the EEG and the UPDRSIII scores were not significant (all p > 0.5, uncorrected).
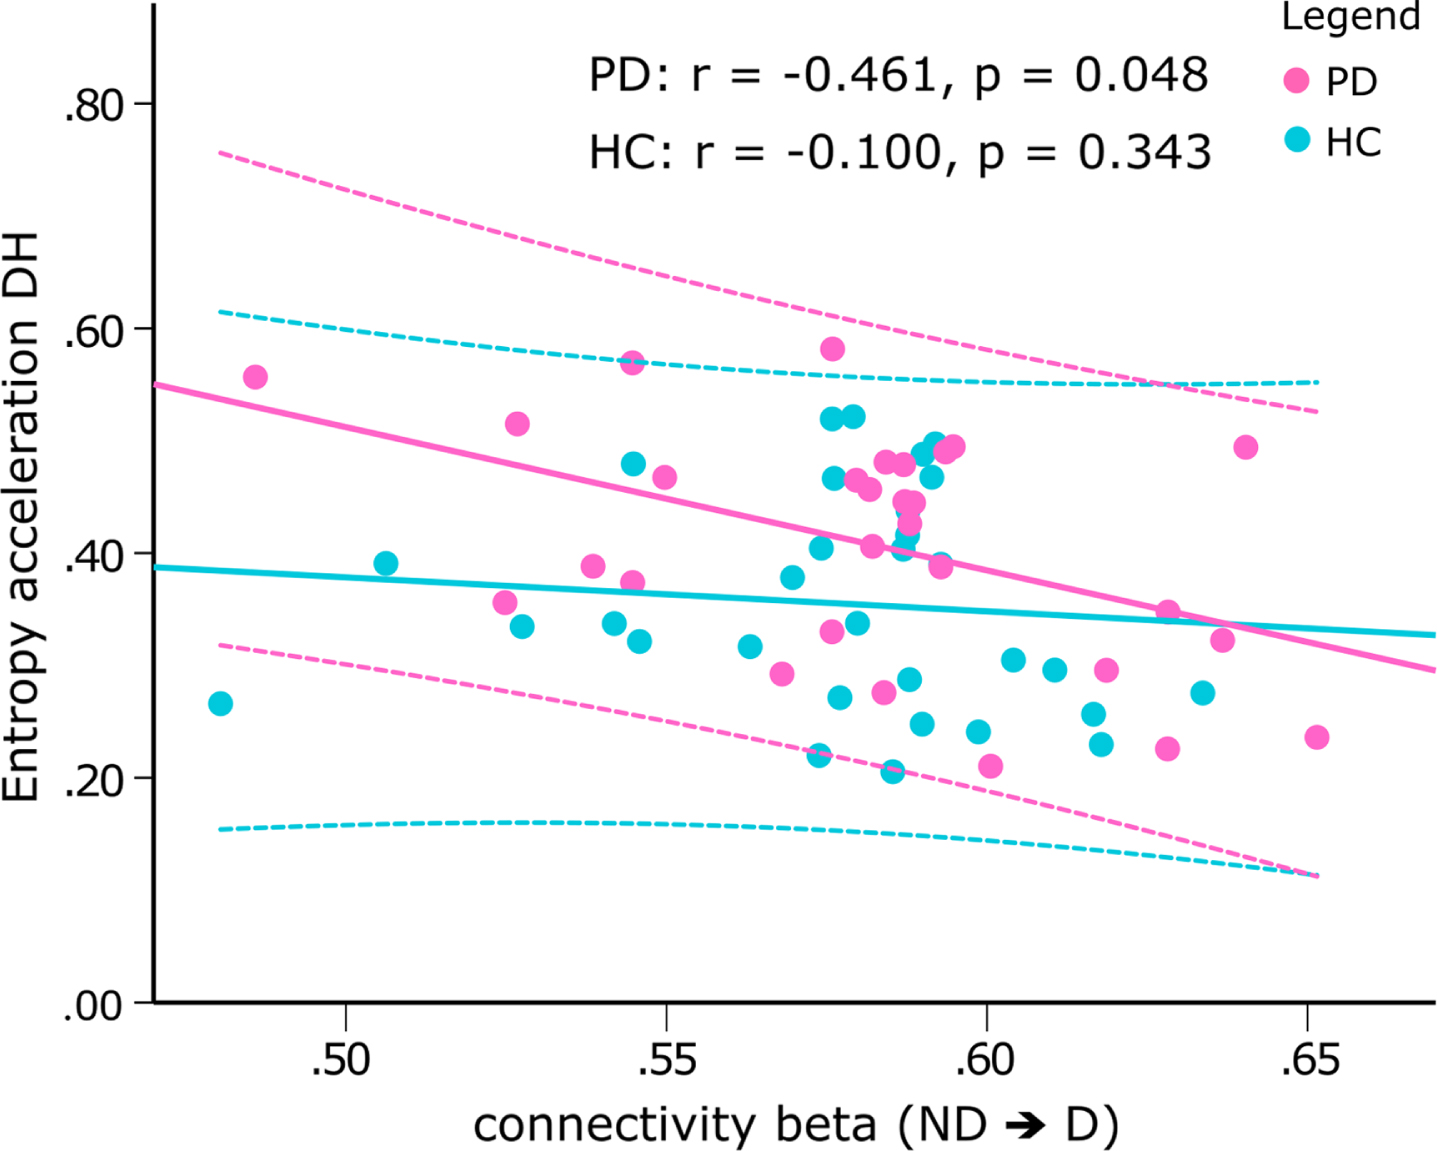
Scatterplot of the correlation between the sample entropy of the acceleration during drawing with the nondominant hand and the connectivity from electrodes covering the nondominant to dominant M1 in the beta band during drawing with the dominant hand. While there was a significant inverse correlation in PD patients (pink, r = –0.461, p = 0.048, corrected), correlation was not significant in healthy controls (blue). Z-test revealed a trend difference between correlations (z = –1.462, p = 0.072). The dotted lines denote the 95%confidence intervals of the correlation. ND⟶D, connectivity from sensors covering the nondominant to dominant M1; NDH, nondominant hand; PD, Parkinson’s disease patients; HC, healthy controls.
DISCUSSION
The present work reveals reduced effective connectivity in both directions of the bilateral M1 in Parkinson’s disease patients compared to an age-matched healthy control group. The connectivity in the nondominant to dominant direction inversely correlated with the (log) entropy of the velocity signal during a spiral drawing task in patients. Patients with decreased interhemispheric connectivity exhibited an increased amount of irregularities in their drawings, highlighting the practical relevance of these findings. Additionally, EEG recorded during spiral drawing revealed a similar relationship between interhemispheric connectivity of task-related activities and irregularities, corroborating the importance of connectivity particularly from the nondominant to dominant hemisphere.
Irregularities during spiral drawing reveal deficits in temporal organization of movement in Parkinson’s disease
We observed elevated sample entropy in spiral drawings in patients with Parkinson’s disease, indicating an increased amount of irregular dynamics of both velocity and acceleration. Contrary, in healthy subjects, the temporal evolution of those signals was more regular and predictable, potentially corresponding to stable and robust movement execution approaching optimal variability [54]. Sample entropy has previously been implemented to describe complications in graphic movements in patients with schizophrenia, illustrating its general feasibility to characterize movement irregularities [55]. Our results demonstrate the utility of nonlinear parameters, advancing previous studies that report an increased coefficient of variation during repetitive movements [56, 57]. An increased amount of irregularities might be associated with impaired control mechanisms (e.g., for the temporal organization of movement) that are unable to properly command regular movement patterns and fail to provide sufficient order for stable performance [11]. Because drawing involves the utilization of visual feedback to guide the path, impaired transformation of visual information could be another factor contributing to enhanced irregularities [58]. Furthermore, dysfunctions in smooth pursuit eye movements could cause a delay in visual information and thereby play an additional role [59].
Contrasting our results, Aghanavesi et al. [39] studied the temporal irregularities of drawing spirals on a smartphone and found a decreased temporal irregularity score in Parkinson’s disease patients. Nevertheless, caution must be taken when comparing these results with the current findings, since the temporal irregularity score calculation involved a temporal normalization and was based on approximate entropy, which is highly dependent on the length of the recording and may lead to inconsistent outcomes [11, 15]. Furthermore, differences in sampling rate (fixed vs dynamic) or size and friction of the recording device, which could affect the effectors used to draw the spirals, may impede a direct comparison between the results. Other studies have included entropy parameters of spiral drawings as features for disease- or motor state-classification with machine learning algorithms. For example, López-de-Ipiña et al. [60] showed that this can substantially improve the classification performance between essential tremor patients and healthy controls. Memedi et al. [38] included approximate entropy in a feature set to successfully classify spirals drawn by bradykinetic or dyskinetic Parkinson’s disease patients and distinguish between Parkinson’s disease patients and healthy subjects. However, the inclusion of nonlinear features (including sample entropy) did not substantially influence the classification between Parkinson’s disease and healthy controls [13]. Given the heterogeneous results in machine learning, the actual contribution of nonlinear parameters for the classification of healthy and diseased populations remains controversial, especially when a sufficient number of parameters, involving speed-, acceleration-, and pressure-measures, are available to provide accurate identification. Nonetheless, our results demonstrate elevated sample entropy of spiral drawings performed by Parkinson’s disease patients, suggesting that this parameter is a useful addition to traditional parameters when studying motor impairments. As a nonlinear measure, sample entropy describes movement characteristics that are not captured by linear variables, providing new insights into manifestations of motor impairment that have not been elucidated so far. Investigating such parameters can further our comprehension of motor impairment by revealing additional dimensions and the underlying mechanisms. This is particularly necessary since handwriting and drawing movements are complex, dynamic, and nonlinear processes occurring across multiple temporal and spatial scales [9, 10].
In contrast to earlier research on spiral drawing in PD [3, 8], (log) duration, velocity, and acceleration did not differ between the two groups. This could relate to the task instructions of drawing the spirals within the boundaries of the spiral template with a self-selected speed. In combination with the medication status, this could mask speed control impairments that are particularly prominent during fast movements and suggests that sample entropy measures are specifically sensitive to irregularities, even when impairments related to bradykinesia may be managed by l-dopa replacement therapy relatively well.
We did not find a linear correlation between sample entropy and the UPDRSIII score. Depending on visuomotor coordination, drawing involves at least three functional domains. First, proper executive functionality is needed to organize and coordinate movement. Second, the transformation of visual information is essential. Third, hand motor capabilities must meet the demands of the movements [6, 58]. While the UPDRSIII mainly measures rigidity, bradykinesia, tremor, and midline function [52], these scores mainly reflect motor capabilities and correlations may be absent or attenuated if sample entropy quantifies relevant aspects of motor function that are not measured [8, 58]. The lack of correlations therefore suggests that impairments in one of the other domains play a more important role for an increased amount of irregularities. This is further supported by our findings that illustrate that drawing performance can be similarly impaired in both hands, irrespective of which hand is clinically more affected, while asymmetries in motor impairment are often demonstrated in the UPDRSIII [17].
Since sample entropy compares the similarity of small windows within a time-series, it provides the ability to quantify higher frequency temporal irregularities in the magnitude of milliseconds that are not measured by the UPDRSIII but may impede complex everyday movements nonetheless. While the UPDRSIII serves as a great tool to examine the over-all motor state, the analysis of spiral drawings by sample entropy could improve our understanding of the impact of disease, medication, or deep brain stimulation on functional domains that are not extensively captured by conventional motor examination. Additionally, measuring irregularities during drawing extends the current possibilities of motor performance evaluation by characterizing a task that might be more closely related to challenges a patient might encounter in real life situations. Lastly, studying specific motor tasks provides the ability to study brain processes involved in the control of complex and realistic movements, and their relationship to the above mentioned subdomains of motor control.
Taken together, temporal irregularities as observed by drawing spirals relate to disturbances in motor coordination that are not completely captured by the UPDRSIII. Instead, they could relate to deficits in central mechanisms involved in the temporal control of movement or sensorimotor integration, as previously demonstrated in inter-limb movements [61] or visuomotor tracking tasks [58].
Reduced interhemispheric effective connectivity is associated with irregularities in spiral drawing
Relative to healthy age-matched subjects, patients with Parkinson’s disease displayed reduced bi-directional interhemispheric effective connectivity in M1. Being a key structure of sensorimotor circuits, its dysfunction has been considered to relate to motor disability in Parkinson’s disease, potentially resulting from an impaired ability to integrate sensorimotor information [28, 62]. In healthy awake subjects, the brain is thought to maintain a metastable equilibrium to accommodate flexible integration of information, depending on current and prospectively emerging demands [29]. The disruption of interhemispheric interactions during rest could be indicative of a perturbation of such equilibrium, leading to deficient interhemispheric cooperation, the reduced ability to perform complicated tasks, and disturbances of sensory processing or sensorimotor integration [28]. In this context, it has been demonstrated that both M1 areas act together to perform unilateral motor tasks, especially when task complexity increases [63–65]. Disrupted connectivity might interfere with dynamic processes of interhemispheric inhibition and facilitation, eventually causing observable motor deficits. Supporting this, resting-state fMRI studies on stroke patients demonstrated that the initial loss of sensorimotor function is accompanied by deterioration of interhemispheric M1 functional connectivity, and that the recovery of motor function is associated with increases in functional connectivity [31, 32]. Our analyses reveal an inverse relationship between the effective connectivity from the nondominant to dominant M1 during rest fMRI and the log of sample entropy of spiral drawing velocity in Parkinson’s disease patients. This shows that patients with reduced effective connectivity concurrently featured an increased amount of irregularities while healthy subjects did not show such an association. Illustrating that relatively reduced interhemispheric connectivity in Parkinson’s disease patients relates to enhanced irregularities during spiral drawing, our results corroborate the importance of interhemispheric M1 communication and suggest similar physiological mechanisms in Parkinson’s disease.
Surprisingly, irregularities during nondominant hand drawing were inversely correlated with connectivity from the nondominant to dominant hemisphere as well, while one would initially expect the reverse direction to be relevant. This suggests that impairment in the temporal organization of intended movement relates to reductions in interhemispheric connectivity especially from the nondominant to the dominant brain structures, indicating that disruptions within the physiologically predetermined networks linked to handiness and motor development that are eventually affected in Parkinson’s disease compromise the ability to perform complex tasks. Such relationship highlights the contribution of the nondominant hemisphere for motor performance in both dominant and nondominant hand drawing. This is supported by earlier findings that showed that the ipsilateral M1 contributes to motor performance in complex tasks [63] and that rTMS-induced inhibition of the ipsilateral M1 leads to an increased error rate in motor timing [66]. Thus, effective connectivity in the nondominant to dominant direction that inversely correlates with sample entropy in both hands indicates that a preserved amount of bilateral cooperation could maintain performance levels. A potential reason could be that each brain hemisphere processes different but complementary motor control strategies and that a low level of connectivity in the nondominant to dominant direction might depict impairments that are particularly influential both during dominant and nondominant hand drawing. Differential contributions of the two hemispheres, for example, have been demonstrated for action timing by Pflug et al. [67]. Further, it has been hypothesized that in right-handers, the left hemisphere is responsible for open-loop control, whereas closed-loop mechanisms involved in the adaptation of movement to unpredictable circumstances are rather located in the right (nondominant) hemisphere [68]. Thus, the integration of information from the nondominant hemisphere could be crucial for prolonged movements like spiral drawing, where feedback, e.g., about the pens’ position, is constantly processed.
Similar to rest fMRI connectivity, nondominant to dominant interactions between EEG sensors covering M1 related to the sample entropy of acceleration, corroborating the relevance of nondominant to dominant connectivity. However, a negative linear relationship in Parkinson’s disease patients was only evident during dominant hand drawing. Since only patients showed such associations, those who have relatively elevated interhemispheric connectivity might be able to alleviate impairments that are not occurring in healthy subjects. Patients with reduced effective connectivity, in contrast, might lack such ability, thereby exhibiting amplified sample entropy.
Interestingly, connectivity in both beta and gamma bands correlated inversely with sample entropy. This is intriguing because beta oscillations seem to reflect the maintenance of a current motor state, whereas gamma oscillations correspond to rather prokinetic processes, thereby contrasting the former activities [69]. However, both frequency bands can be further subdivided into distinct frequencies that correspond to different functions. Apart from supporting the status quo, higher frequencies of the beta band are potentially involved in attention, anticipation, sensorimotor integration, and updating motor predictions [70], as well as error evaluation and monitoring [71]. Similarly, gamma oscillations can be segregated into a finely tuned gamma band reflecting pro-kinetic and dynamic processing, and broadband activities that correspond to active motor control processes, feedback processing, or learning [72, 73]. Therefore, one possible explanation could be that the communication patterns from nondominant to dominant hemisphere discovered here could span frequencies that cover both beta and gamma oscillations. Further, drawing spirals involves the complex interplay between rapid activation and deactivation of agonist and antagonist muscles, meaning that both pro-kinetic and stopping processes could be pertinent.
Since most participants in our study were right-handed, we cannot exclude that our findings specifically relate to right-handed Parkinson’s disease patients. Whether handedness affects patients differently remains unclear so far. Handedness appears to affect patients in a way that both left and right handers more often experience the onset of symptoms on their dominant side (∼60%) [74]. Notably, most of our participants were also more severely affected on their dominant body hemisphere (19 vs 10). In a recent study it was suggested that genetic variants that influence the handedness phenotype by contributing to the lateralization of brain organization could also influence the predisposition to develop neurological disease like Parkinson’s disease [75]. Whether handedness affects Parkinson’s disease, or more specifically the temporal organization of movement, differently should be addressed in future studies.
Our results suggest that irregularities in spiral drawing result from impaired motor control mechanisms. However, we cannot fully exclude potential contributions from ocular movement dysfunction that was demonstrated in PD [59] and could delay the transformation of visual information. To disentangle between dysfunctions in executive control, in the generation of visual information, or in visual transformation, future studies should incorporate open loop movements that rely on visual information to a lesser degree (e.g., drawing spirals as fast as possible without providing a template), clinical assessments and questionnaires that measure dexterity (e.g., the Purdue Pegboard or the Dexterity Questionnaire 24), and combine these with eye tracking devices. Furthermore, manipulating the medication status could provide additional information on the mechanisms causing enhanced irregularities. Lastly, due to its nonnormal distribution, the sample entropy of velocity was log transformed [51], which added a layer of complexity to understanding and interpreting the data. Thus, the current interpretation based on this metric should be taken cautiously.
CONCLUSION
This study evidences that patients with Parkinson’s disease display an increased amount of temporal irregularities in the execution of a spiral-drawing task, as measured by sample entropy. In addition, the reciprocal effective connectivity between left and right M1 during resting-state fMRI is reduced. Connectivity specifically in the nondominant to dominant direction is linearly inverse correlated with the extent of irregularities. Similar associations with task-based EEG further highlight the functional relevance of nondominant to dominant M1 interactions. We demonstrate that nonlinear parameters of a spiral drawing task like sample entropy have the potential to unravel altered characteristics of graphomotor control in Parkinson’s disease patients that are not considered by the UPDRSIII. As a complex task that relates to challenges patients might experience in their daily routines, this affords to a) study pathological mechanisms that are not related to UPDRS, b) investigate therapeutic effects, c) investigate brain mechanisms that cause such impairment, and d) potentially aid in the differential diagnosis. While relatively elevated effective connectivity might facilitate stable and regular movement control, a disrupted interhemispheric pathway may render responsible for disease related impairments of the temporal organization of movement. Studying malfunctions of interhemispheric connectivity is crucial to further our understanding of motor physiology and impairment in Parkinson’s disease.
Footnotes
ACKNOWLEDGMENTS
The authors would like to acknowledge the support of the German Research Foundation (DFG; SFB-TR-128, SFB-CRC 1193, MU 4354/1-1) and the Boehringer Ingelheim Fonds (BIF-03).
CONFLICT OF INTEREST
The authors have no conflict of interest to report.