
Abstract
Background:
Recent randomized clinical trials using hydrophobic statins reported no influence on Parkinson’s disease (PD) clinical progression. Hydrophobicity is a key determinant for blood-brain barrier penetrance.
Objective:
Investigate a potential effect of statins on PD progression.
Methods:
Statin use was determined at baseline and subtyped according to hydrophobicity in 125 PD patients participating in the PD Biomarker Program (PDBP, 2012–2015) at our site. Clinical (N = 125) and susceptibility MRI (N = 86) data were obtained at baseline and 18-months. Movement Disorders Society-Unified PD Rating Scales were used to track progression of non-motor (MDS-UPDRS-I) and motor (MDS-UPDRS-II) symptoms, and rater-based scores (MDS-UPDRS-III) of patients in the “on” drug state. R2* values were used to capture pathological progression in the substantia nigra. Associations between statin use, its subtypes, and PD progression were evaluated with linear mixed effect regressions.
Results:
Compared to statin non-users, overall statin or lipophilic statin use did not significantly influence PD clinical or imaging progression. Hydrophilic statin users, however, demonstrated faster clinical progression of non-motor symptoms [MDS-UPDRS-I (β= 4.8, p = 0.010)] and nigral R2* (β= 3.7, p = 0.043). A similar trend was found for MDS-UPDRS-II (β= 3.9, p = 0.10), but an opposite trend was observed for rater-based MDS-UPDRS-III (β= –7.3, p = 0.10). Compared to lipophilic statin users, hydrophilic statin users also showed significantly faster clinical progression of non-motor symptoms [MDS-UPDRS-I (β= 5.0, p = 0.020)], but R2* did not reach statistical significance (β= 2.5, p = 0.24).
Conclusion:
This study suggests that hydrophilic, but not lipophilic, statins may be associated with faster PD progression. Future studies may have clinical and scientific implications.
Keywords
INTRODUCTION
Parkinson’s disease (PD) is a progressive neurodegenerative disorder marked clinically by motor dysfunction (bradykinesia, rigidity, and tremor), and pathologically by dopaminergic neuron loss and Lewy pathology characterized by α−synuclein aggregation [1–3]. There is a growing realization that PD involves many non-motor symptoms including cognitive decline, depression, autonomic, and olfactory change [4]. Despite effective symptomatic treatment, patients continue to experience progressive disability. Developing novel and/or disease-modifying therapies for PD is an urgent unmet need, although there currently are none showing efficacy [5–7].
Among agents being studied in this active research area [8], statins have been suggested to be neuroprotective [9, 10]. Previous epidemiological studies have focused on statins and incidence of PD, yielding inconsistent results [11–15]. The effect of statins on clinical PD progression has received less attention, although a recent retrospective study showed early-stage PD patients on long-term statin therapy had less motor impairment over four years [16]. Two recent clinical trials testing lovastatin [17] and simvastatin [18], however, reported no impact on motor symptom progression, although mean percentage change in the striatal 18F-dopa uptake ratio was less with lovastatin use [17].
Whereas statins are known for inhibiting cholesterol synthesis, in vitro studies also have demonstrated that they potentially antagonize pathological processes in PD [10, 19–22]. Statins, however, vary markedly in hydrophobicity and this impacts their ability to cross the blood-brain barrier (BBB) [23]. Since cholesterol synthesis in the central nervous system occurs de novo and is largely independent of that in the periphery [24], hydrophobicity may be an important determinant of statin effects on PD progression.
Leveraging a PD biomarker study cohort with longitudinal clinical and imaging data, we investigated a potential effect of statins on PD progression.
METHODS
Subjects
The study included 125 PD patients participating in the NINDS-funded PD Biomarker Program (PDBP, NS082151, baseline enrollment from 2012–2015) study recruited from a tertiary movement disorders clinic. Briefly, the PDBP was commissioned by NINDS in 2021 to discover biofluid biomarkers. The program mandated the use of CDEs to collect clinical, motor, and non-motor data annually for all PDBP-funded projects. To date, data have been collected on ∼1500 subjects (https://pdbp.ninds.nih.gov/parkinsons-data) and Penn State Hershey was one of the sites. The enrollment criteria for PD subjects included history of adequate response to dopaminergic therapy, history of asymmetric onset, and lack of neurological disorders other than PD. Controls had to be free of acute or neurological disorders. In addition to standardized clinical metrics, our site collected imaging data for biomarker development. All subjects gave written informed consent, consistent with the Declaration of Helsinki. The protocol was reviewed and approved by the Penn State Hershey Institutional Review Board.
PD diagnosis was confirmed by a movement disorder specialist according to UK brain bank criteria [25]. PD duration was defined as the date of study visit minus the date since PD first was diagnosed by a physician. Levodopa equivalent daily dosage (LEDD) was calculated according to published criteria [26]. Statin use was assessed by self-report at baseline. Statins were prescribed by non-movement disorder physicians, without consultation from the movement disorder specialists who managed PD symptoms. Statins were subgrouped as lipophilic (atorvastatin, simvastatin, lovastatin, pitavastatin) or hydrophilic (pravastatin, rosuvastatin). Eighty-six patients had high quality MRI for susceptibility analysis.
Clinical data collection
Patients were seen at baseline and then every six-months thereafter for three years in accordance with the NINDS PDBP protocol, although only baseline and 18-month data were used in this study. Demographic characteristics including age, gender, and education level were obtained at the baseline visit, and baseline serum cholesterol and LDL concentrations were available. Clinical data were collected as described previously [27]. Briefly, MDS-UPDRS data were collected by trained personnel. Participants took their regular PD medications prior to the study visit and MDS-UPDRS-III scores were obtained ∼1-2 hr after medication administration (in the “on” state), except for one subject who forgot to take their morning medications. MDS-UPDRS-III videos were rescored, except for rigidity scores, by raters with high inter-rater reliability as described previously [27].
MRI image acquisition and analysis
MRI image acquisition and analysis were performed as described previously [28]. Briefly, T1 weighted images were obtained at baseline and 18-month visits by a magnetization-prepared rapid acquisition gradient echo sequence with the following parameters: repetition time/echo time = 1540/2.34 ms, field of view = 256×256, slice thickness =1 mm (no gap), and slice number = 176. T2-weighted images were obtained with a fast spin echo sequence with repetition time/echo time of 2500/316 ms and the same spatial resolution settings as T1-weighted images. T2*-weighted images were obtained by using a multi-gradient-echo sequence with eight echoes (echo times ranging from 6.2–49.6 ms), repetition time = 55 ms, flip angle = 15°, field of view = 240×240, matrix = 256×256, slice thickness = 2 mm, slice number = 64, and voxel size = 0.9×0.9×2 mm3. R2* images were obtained by nonlinear curve fitting of a mono-exponential equation (S(TE) = S0e-R2 *TE) using the Levenberg-Marquardt approach.
Segmentation of the substantia nigra pars compacta
The substantia nigra pars compacta (SNc) was segmented bilaterally using an automatic atlas-based parcellation followed by manual correction in a four-step process as described previously [28]. The SNc was defined using six slices, from superior to inferior, starting from the middle of the red nucleus, as a 4x10 mm kidney-shaped region between the red nucleus and hypointense band. Since we previously have demonstrated no difference between left and right SNc regions [29], these ROIs were averaged and the mean value used for further analyses.
Statistical analysis
Linear mixed effect regressions with a random intercept were used to assess longitudinal changes. We report the absolute change from baseline, although the main variables of interest were statin usage or statin type (lipophilic or hydrophilic), time (baseline, 18-months), and the interaction between either statin use or statin type and time (statin*time, statin-type*time) for assessment of longitudinal change. Age, gender, and disease duration were included as covariates in the models. p-values were calculated by Satterthwaite’s approximation [30, 31]. All statistical analyses were performed in R version 4.0.0.
RESULTS
Baseline characteristics
Baseline demographic, laboratory, and clinical data for PD subjects and statin subgroups are shown in Table 1. A minority of subjects were on statin therapy (34 of 125), with 24 taking lipophilic and 10 hydrophilic statins. The average age±standard deviation was 67.7±9.3 years and subjects predominantly were male (69 male). These factors were similar for all subgroups. Serum cholesterol and LDL were lower for statin users. Participants taking hydrophilic statins tended to have lower disease duration and MDS-UPDRS-I-III scores, but higher LEDD values and MDS-UPDRS-IV scores, although none of the comparisons across groups were significant. R2* values were similar across all subgroups at baseline.
Baseline demographic, serum, and clinical data for PD and statin subgroup subjects
Data represent mean with standard deviations in parentheses unless otherwise specified. M, male; F, female; y, years; LEDD, Levodopa equivalent daily dosage; MoCA, Montreal Cognitive Assessment; UPDRS, Unified Parkinson’s Disease Rating Scale, I, non-motor experiences of daily living, II, motor experiences of daily living, III, motor examination; IV, motor dysfunction; total, sum of UPDRS parts I-IV; UPSIT, University of Pennsylvania Smell Identification Test.
Statin effect on clinical measurements
Change from baseline
Statin non-users did not demonstrate a significant change in MDS-UPDRS scores over time (p > 0.24; Table 2 and Fig. 1A). Statin users also did not show longitudinal changes in MDS-UPDRS-I or –II scores (p > 0.15), but MDS-UPDRS-III scores decreased (improved; β= –5.7, p = 0.017; Table 2). When parsed by hydrophobicity, lipophilic statin users did not demonstrate significant changes in MDS-UPDRS scores over time (p > 0.17; Table 2 and Fig. 1A). Hydrophilic statin users, however, had significantly increased (worse) MDS-UPDRS-1 (β= 4.2, p = 0.017; Table 2 and Fig. 1A) and trend increased MDS-UPDRS-II (β= 3.5, p = 0.11) scores, but decreased (improved) MDS-UPDRS-III scores (β = -9.1, p = 0.029; Table 2).
The effects of statin usage on progression of clinical measures and MRI susceptibility
Data represent estimates on effect of statins on specified outcomes at 18 months while adjusting for age, gender, and disease duration. Non-statin is the reference group unless otherwise stated. Effect estimates represent beta estimates from linear mixed effect model and represent change in addition to that seen in the reference group. Values for statin users represent PD subjects taking any statin and are derived from a model considering statin use vs. non-statin use. Values for non-statin, lipophilic, and hydrophilic are derived from models considering statin use, use of lipophilic statin, or use of hydrophilic statin. LEDD, Levodopa equivalent daily dosage; MDS-UPDRS, Movement Disorders Society Unified Parkinson’s Disease Rating Scale, I, non-motor experiences of daily living, II, motor experiences of daily living, III, motor examination.
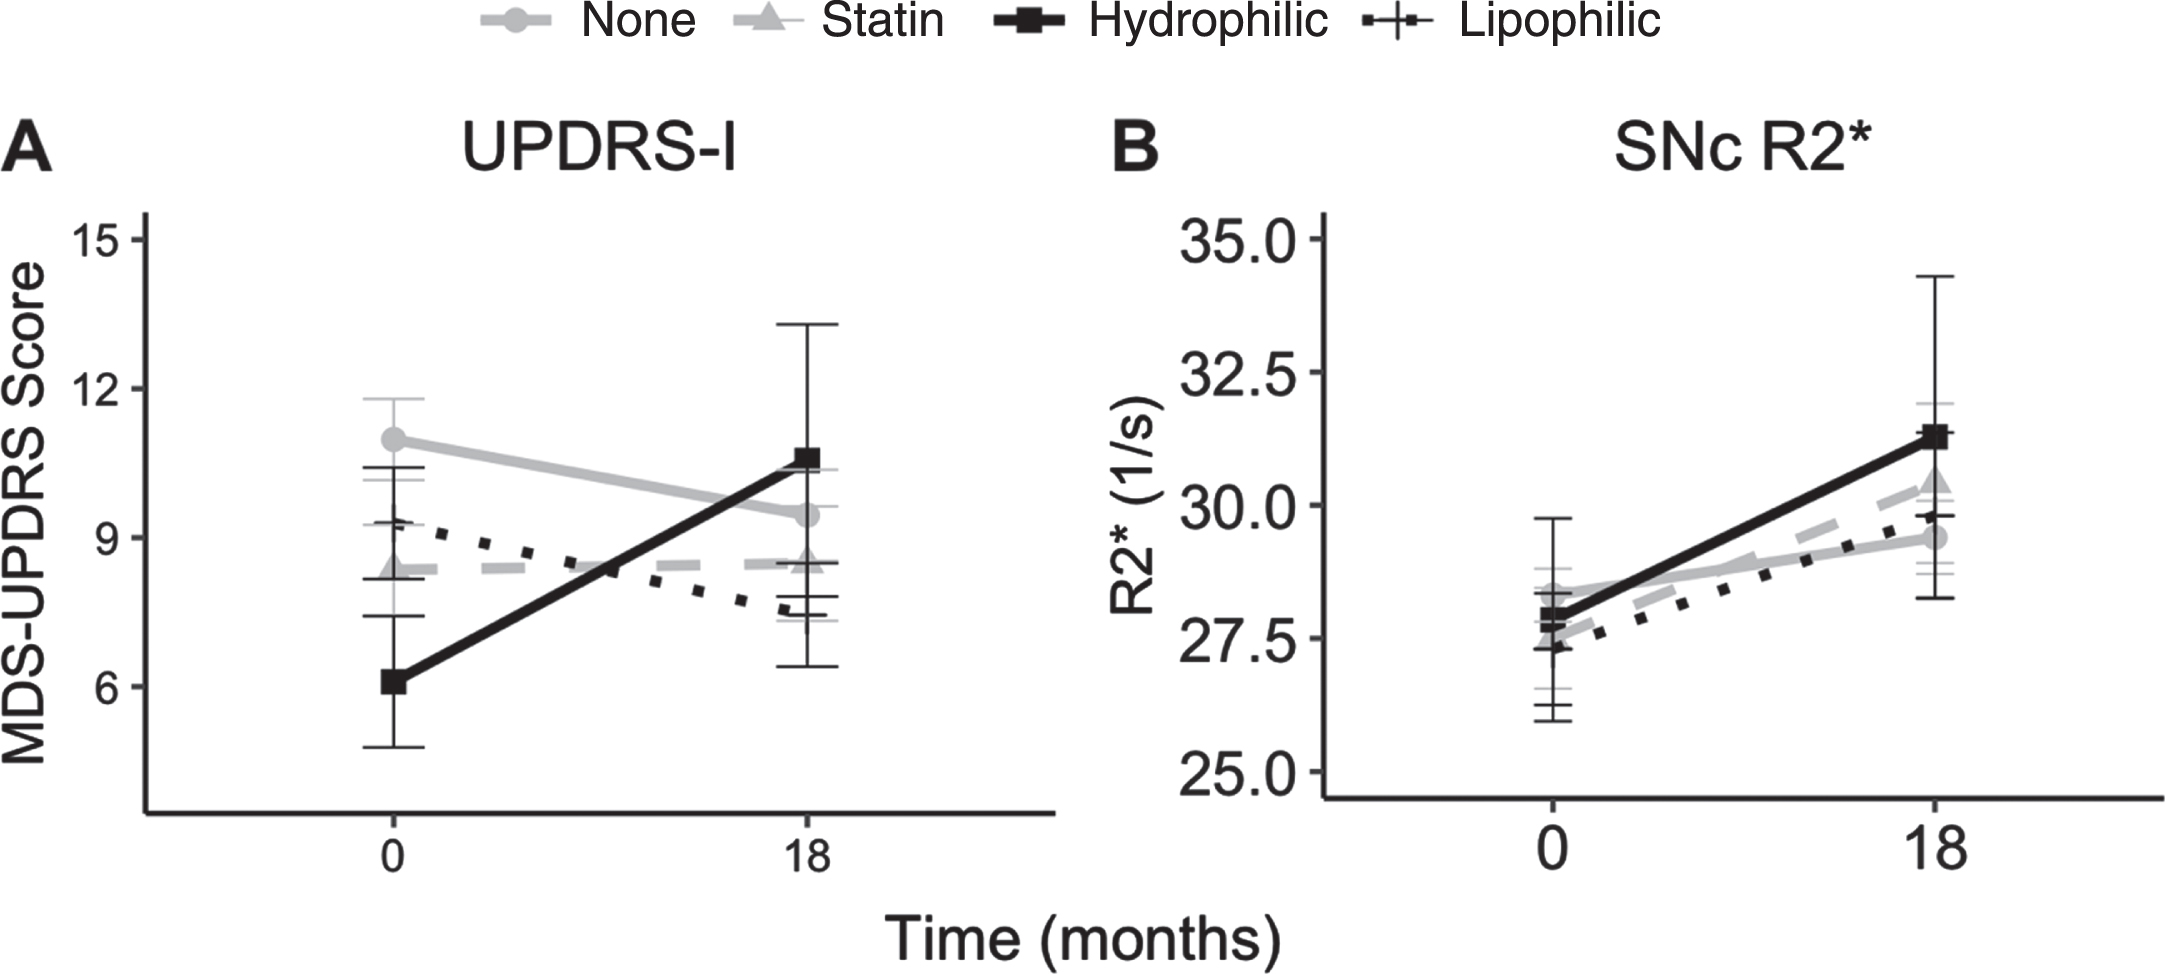
Depiction of changes in (A) MDS-UPDRS-I and (B) SNc R2* over 18 months in the study population. Data represent mean and error bars represent SEM.
Group differences
Compared to statin non-users, overall statin use did not significantly influence PD clinical progression (p > 0.14; Table 2). When parsed by hydrophobicity, lipophilic statin use also did not impact clinical progression significantly compared to statin non-users (p > 0.43; Table 2). Hydrophilic statin users, however, showed increased (worse) MDS-UPDRS-I (β= 4.8, p = 0.010; Table 2 and Fig. 1A) and trend increased MDS-UPDRS-II (β= 3.9, p = 0.10) scores, but an opposite trend decrease (improvement) in MDS-UPDRS-III scores (β=−7.3, p = 0.10) (Table 2). Compared to lipophilic statin users, hydrophilic statin users had faster progression of MDS-UPDRS-I scores (β= 5.0, p = 0.020; Table 2 and Fig. 1A). These results were not altered by further correcting the models for baseline serum LDL levels (Table 3).
The effects of statin usage on progression of clinical and imaging metrics after adjustment for baseline serum LDL
Data represent estimates on effect of statins on specified outcomes at 18 months while adjusting for age, gender, and disease duration. Non-statin is the reference group unless otherwise stated. Effect estimates represent beta estimates from linear mixed effect model and represent change in addition to that seen in the reference group. Values for statin users represent PD subjects taking any statin and are derived from a model considering statin use vs. non-statin use. Values for non-statin, lipophilic, and hydrophilic are derived from models considering statin use, use of lipophilic statin, or use of hydrophilic statin. MDS-UPDRS, Movement Disorders Society Unified Parkinson’s Disease Rating Scale, I, non-motor experiences of daily living.
Statin effect on SNc R2* values
Change from baseline
Overall, SNc R2* values increased significantly from baseline in statin non-users (β= 1.6, p = 0.010) and users (β= 3.7, p = 0.001). When parsed by hydrophobicity, both lipophilic (β= 2.8, p = 0.039) and hydrophilic (β= 5.3, p = 0.003) statin users also showed increased SN R2* values over time (Table 2).
Group differences
Compared to statin non-users, overall statin users showed a trend increase in SN R2* values (β= 2.1, p = 0.084; Table 2 and Fig. 1B). When parsed by hydrophobicity, lipophilic statin users did not demonstrate any change in SN R2* values (β= 0.1.2, p = 0.41; Table 2 and Fig. 1B). Hydrophilic statin users, however, had a significant increase in SNc R2* values compared to statin non-users (β= 3.7, p = 0.043; Table 2 and Fig. 1B). Compared to lipophilic statin users, SN R2* values did not reach statistical significance in hydrophilic statin users (β= 2.5, p = 0.24; Table 2, Fig. 1B). These findings were not altered by additional correction for baseline serum LDL values (Table 3).
DISCUSSION
Preclinical, epidemiological, and clinical trial data and their interpretations regarding the effects of statins on PD progression have been controversial, complicated by their cholesterol-lowering and pleiotropic effects. Findings from the current study are consistent with our hypothesis that hydrophobicity is also an important determinant of statin effects on PD. Consistent with previous studies [17, 18], the current results indicate that lipophilic statins are not associated significantly with clinical or imaging progression. Hydrophilic statin use, however, significantly is associated with increased non-motor (MDS-UPDRS-I) scores and imaging (SN R2*) values. We also found a consistent trend with motor scores using MDS-UPDRS-II but not MDS-UPDRS-III scores that we previously reported to be problematic in tracking PD progression [27]. Future studies are needed to test if these findings can be replicated since the results may have both scientific and clinical implications.
Statins have been suggested to be neuroprotective [9] but previous epidemiological studies focused on statins and incidence of PD, with some reporting lower PD risk among statin users [11, 32–35] and others not [12, 37]. The interpretation of these data, however, is not straightforward. For example, two recent meta-analyses suggested a significant publication bias toward reporting protective effects of statins in PD [38, 39]. In addition, the interpretation also may be confounded by the fact that statins differ in their ability to cross the BBB. Given their BBB penetrating property, most preclinical studies reporting potential neuroprotective effects of statin are focused on lipophilic compounds [40, 41]. Lee and colleagues [42] reported that discontinuing statins, especially lipophilic ones, was associated with higher PD risk. This was interpreted as compelling evidence for neuroprotection, although the number of subjects in these studies was very small. In 2017, we utilized a large US claims database (MarketScan) and found that statin usage (especially lipophilic ones) is associated with higher risk of PD [15]. Since then, we have not noted any other studies reporting their stratified results, although some may be pending in press.
The effect of statins on clinical PD progression has received less attention overall until recently. A recent retrospective study indicated PD patients on long-term statin therapy showed less motor impairment over four years [16]. Two prospective clinical trials have tested the lipophilic statins lovastatin [17] and simvastatin [18], but neither had a beneficial effect on measures of clinical progression (MDS-UPDRS scores). The “trend” noted in one study [17] was far from significant (p = 0.14) and should have been noted as a negative result. Consistent with the overall conclusion of these trials, the current study found that lipophilic statin use did not impact clinical progression measures. In addition, we also demonstrated that lipophilic statins did not significantly change imaging progression (SN R2* values). This is in contrast to the lovastatin study that reported less mean percentage change in the striatal 18F-dopa uptake ratio with lovastatin use [17]. The difference in regions (SN vs. striatum), imaging metrics/sensitivities (susceptibility vs. positron emission tomography), and disease duration (∼3 y [17] vs. ∼6.5) may contribute to the discordant results. It is possible that lipophilic statins may have neuroprotective effects in the early course of the disease, such as in prodromal states, but not later disease stages. Additional studies are needed to determine the effect of lipophilic statins on imaging metrics.
This study suggests that hydrophilic statin use may be associated with faster PD progression. For clinical metrics, this was evident particularly for non-motor symptoms (MDS-UPDRS-I scores), with a trend increase in reported motor symptoms (MDS-UPDRS-II scores). PD traditionally is characterized by motor symptoms but there is growing evidence that non-motor symptoms are burdensome and impact patient quality of life [43, 44]. The current results are consistent with previous studies reporting increased MDS-UPDRS-I and –II scores over time [45, 46], even though our MDS-UPDRS-II findings were at the trend level. These types of patient-reported questionnaires seem to be more reliable in capturing PD progression than rater-based exams such as the MDS-UPDRS-III [27]. It should be noted, however, that the MDS-UPDRS-I assesses only some non-motor symptoms and shows floor effects [47]. Thus, future studies should consider including scales that may evaluate a broader spectrum of non-motor symptoms.
Among MRI metrics evaluated as potential PD progression markers, SNc MRI susceptibility (specifically R2*) has emerged as one that can distinguish PD from controls and track PD progression [28, 49]. To the best of our knowledge, this is the first study to utilize MRI susceptibility values, an objective metric, to evaluate statin effects in PD. The results indicate significantly faster R2* imaging progression in hydrophilic statin users compared to statin non-users. Although the comparison of SN R2* values between lipophilic and hydrophilic statin users did not reach statistical significance, the direction of the effect is similar to that of the clinical metrics (MDS-UPDRS-I). Quantitative susceptibility mapping (QSM) has been suggested to reflect iron deposition better than R2* [28, 51]. Previous studies have indicated, however, that R2* captures PD progression more robustly [28, 51] and thus it was the metric of choice for the current study. Replication of the current findings in other cohorts, however, is needed. Collectively, the current study suggests in a small cohort of PD patients that hydrophilic, but not lipophilic, statins may be associated with faster PD progression.
We need to be extremely cautious in interpreting this observation because the exact mechanism is unclear. It is possible that hydrophilic statins may have decreased beneficial pleiotropic effects compared to lipophilic statins on degenerating neurons, or they may impose unidentified adverse effects indirectly because they do not cross the BBB [52, 53]. It also is worth noting that the overall finding was not supported by rater-based MDS-UPDRS-III scores, although the MDS-UPDRS-I, II, and imaging data converge. In the past, we have found that using MDS-UPDRS-III scores to track PD progression is problematic [27]. This scale is entirely rater-dependent and captures only a fraction (five minutes) of motor performance. In addition, MDS-UPDRS-III is affected by drug treatment because most clinicians adjust drug dosages according to their impression of motor progression. Thus, despite our best efforts, MDS-UPDRS-III has not been a good metric for PD progression [27], and improved MDS-UPDRS-III scores over time in the current study merely may reflect higher drug usage [54]. Indeed, the two recent trials testing statin effects in PD failed to show effects on motor symptom progression reflected by MDS-UPDRS-III scores [17, 18].
The study, however, also has other limitations. First, the sample size in the statin subgroups is small and there could be other explanations regarding increased MDS-UPDRS-I scores in the hydrophilic PD group that may not relate to statin usage. The observational nature of the study also may lead to selection bias. Second, statin duration/dose was captured by participant recall that may not have been reliable. Although we adjusted our analysis with baseline cholesterol level, we were not able to obtain pre-PD cholesterol levels or its dynamic change under statin treatment before and during our study. In addition, we did not adjust for other co-morbidities that may influence the choice of statin subtype use. Third, the association of SNc R2* values (potentially reflecting underlying pathology) to MDS-UPDRS-I scores is not straightforward since MDS-UPDRS-I scores evaluate non-motor aspects of daily living that arise from dysfunction of both dopaminergic (e.g., SNc) and non-dopaminergic systems. Some previous studies have suggested statins may reduce dopaminergic neurodegeneration [10, 19–22]. If true, it would be reasonable to hypothesize that nigral pathology (reflected by SNcR2*) would correlate with motor function (e.g., MDS-UPDRS-II and -III scores). The trend association between SNc R2* and MDS-UPDRS-II scores is consistent with this notion. The fact that MDS-UPDRS-III scores decreased may reflect the intrinsic limitation of the score [27] and/or the possibility that some PD patients were not medically optimized at baseline. Fourth, both clinical progression and imaging data may be influenced by the use of anti-PD drugs, which this study cannot tease out. Because the decision regarding statin usage and its subtype choice (generally by a physician other than a movement disorder specialist) is independent of anti-PD drugs usage, any bias is unlikely conscious. Fifth, reverse causation cannot be ruled out since statin use was not randomized at baseline and the statin groups were not matched equally on all clinical variables. The follow up time also was limited to 18 months. Larger randomized trials with matched groups and longer follow up times can address these important factors in future studies.
In summary, this study is consistent with previous studies showing that lipophilic statins do not influence PD clinical progression. Moreover, it suggests that hydrophilic statins significantly increase clinical and imaging progression in PD patients. Future studies are needed that integrate the insights we learned from this explorative study and may have both clinical and scientific implications.
Footnotes
ACKNOWLEDGMENTS
We express deep gratitude to all the participants who volunteered for this study and the study personnel who contributed to its completion. All analyses, interpretations, and conclusions are those of the authors and not the research sponsors. This work was supported in part by the National Institute of Neurological Disorders and Stroke Parkinson’s Disease Biomarker Program (NS082151 and NS112008 to XH), the Hershey Medical Center Clinical Research Center (through the National Center for Advancing Translational Sciences, National Institutes of Health, Grant UL1 TR002014), and the Penn State Translational Brain Research Center.
CONFLICT OF INTEREST
The authors report no conflicts of interest.