
Abstract
Background:
There is growing interest in non-motor symptoms in Parkinson’s disease (PD), due to the impact on quality of life. Anhedonia, the inability to experience joy and lust, has a prevalence of up to 46% in PD. The perception of pleasantness of an odor is reduced in anhedonia without PD. We previously showed a reduced hedonic olfactory perception in PD, i.e., patients evaluated odors as less pleasant or unpleasant compared to controls. This deficit correlated with anhedonia.
Objective:
We aimed to confirm these findings. Moreover, we hypothesized that the perception of pleasantness in PD is affected on a multisensory level and correlates with anhedonia. Therefore, we assessed olfactory, visual and acoustic evaluation of pleasantness in PD and healthy individuals.
Methods:
Participants had to rate the pleasantness of 22 odors, pictures, and sounds on a nine-point Likert scale. Depression, anhedonia, and apathy were assessed by means of questionnaires. Results of the pleasantness-rating were compared between groups and correlated to scores of the questionnaires.
Results:
In particular pleasant and unpleasant stimuli across all three modalities are perceived less intense in PD, suggesting that a reduced range of perception of pleasantness is a multisensory phenomenon. However, only a reduction of visual hedonic perception correlated with anhedonia in PD. A correlation of reduced perception of pleasantness with apathy or depression was not present.
Conclusion:
We provide evidence for a multisensory deficit in the perception of pleasantness. Further studies should delineate the underlying neural circuity and the diagnostic value to detect neuropsychiatric symptoms in PD.
Keywords
INTRODUCTION
Parkinson’s disease (PD) is diagnosed by motor symptoms [1]. Yet, non-motor symptoms (NMS) play a central role in the scientific and clinical definition of the prodromal phase of the disease [2], and are of importance in patient care due to their negative influence on quality of life [3]. Amongst NMS, symptoms such as anhedonia, apathy, depression, and anxiety are prominent neuropsychiatric features of PD [4]. Anhedonia generally is defined as the inability to feel joy and lust. Most studies assume a close correlation between anhedonia, depression, and apathy in PD [5, 6] because their symptoms partially overlap. However, anhedonia may occur independently of other neuropsychiatric symptoms [7]. Regardless of these classifications, anhedonia is by definition an expression of a reduced “lust for life”, and thus is central to quality of life, also in PD. The prevalence of anhedonia in PD ranges up to 46%, its prevalence in depressive PD patients amounts to 80% [6]. Despite high prevalence, this symptom has gained little attention. However, anhedonia may be a key symptom, enabling a more specific discrimination of psychiatric symptoms like depression and apathy within PD. This is complex, as characteristic symptoms of PD are similar to somatic symptoms of depression and apathy [8]. In addition, anhedonia might be a prognostic biomarker indicative of a severe motor course of PD with earlier motor disability [9, 10], and impending dementia [10]. Thus, a sensitive assessment of anhedonia might be of great value.
We have previously reported that the olfactory perception of the pleasantness of odors in PD patients differs from healthy control subjects. There, participants had to rate the pleasantness of different odors on a nine-point Likert rating scale and filled-in psychometric questionnaires to assess depressive symptoms and anhedonia. PD patients in general evaluated odors as less pleasant or unpleasant, exhibiting a reduced range of “hedonic olfactory perception”. Hyposmia was a confounding factor, meaning that especially hyposmic patients evaluated odors as less pleasant or unpleasant. Yet, after statistical correction for hyposmia PD patients showed altered hedonic olfaction, suggesting that reduced hedonic olfactory perception is independent from hyposmia. Reduced hedonic olfactory perception also correlated significantly with anhedonia as assessed using the Snaith-Hamilton-Pleasure-Scale (SHAPS), while there was no correlation with depression [11]. We concluded that measuring the perceived pleasantness of odors as an additional, qualitative dimension of olfaction may be a questionnaire-independent assessment, correlating with anhedonia. In the present study, we aimed to investigate, whether we find altered perception of pleasantness in PD in the visual and acoustic sensory modalities in addition to the olfactory modality. We hypothesized, that the reduced ability of perceiving pleasantness is independent of the sensory modality in PD, and that this reduction is correlated with anhedonia across sensory modalities. To this end, we investigated perception of pleasantness towards visual, acoustic and olfactory stimuli in PD and healthy individuals.
MATERIALS AND METHODS
The study took place from 2016 to 2018 in the Department of Molecular Neurology at the University Hospital Erlangen. All contents and methods used in this study comply with the Helsinki Declaration of the World Medical Association and the study has been granted by the local ethics committee (Ethics Application No.: 160_16 B; 07/2016). All participants gave written informed consent.
Participant recruitment and general procedure
Participants were enrolled into the study during their regular outpatient visit, and healthy relatives served as controls. Among controls, a subjectively perceived reduced olfactory ability was an exclusion criterion, whereas in patients a subjectively perceived hyposmia did not result in exclusion. All medication was allowed. One patient was taking valproate. This medication was prescribed due to epilepsy. Beyond that, no mood-stabilizing or antipsychotic medication was taken. Further exclusion criteria were an acute respiratory infection or infections in the outer, middle and inner ear, within one week before the examination. Previous craniocerebral traumata and surgery were additional exclusion criteria. PD patients with deep brain stimulation were excluded. Corrected visual acuity of less than 0.5 was considered as an exclusion criterion, as were a hearing threshold above 60 db or indications of pronounced age-related hearing loss. Hearing aids were allowed. Subjects with Montreal Cognitive Assessment (MoCA) Scores of less than 23 points, suggestive of dementia were excluded.
Prior to the sensory assessments, questionnaire-based assessment was performed (Fig. 1A). Hearing threshold, near and distant visual acuity were determined as well as the MoCA. Assessment of motor symptoms, and disease stage was performed by a certified movement disorder specialist. Thereafter, study participants completed three different tests assessing acoustic, visual and olfactory perception of pleasantness. The order of tests was varied in a pseudo-randomized manner. The sequence of sounds, images and smells within each test were identical (Fig. 1B).
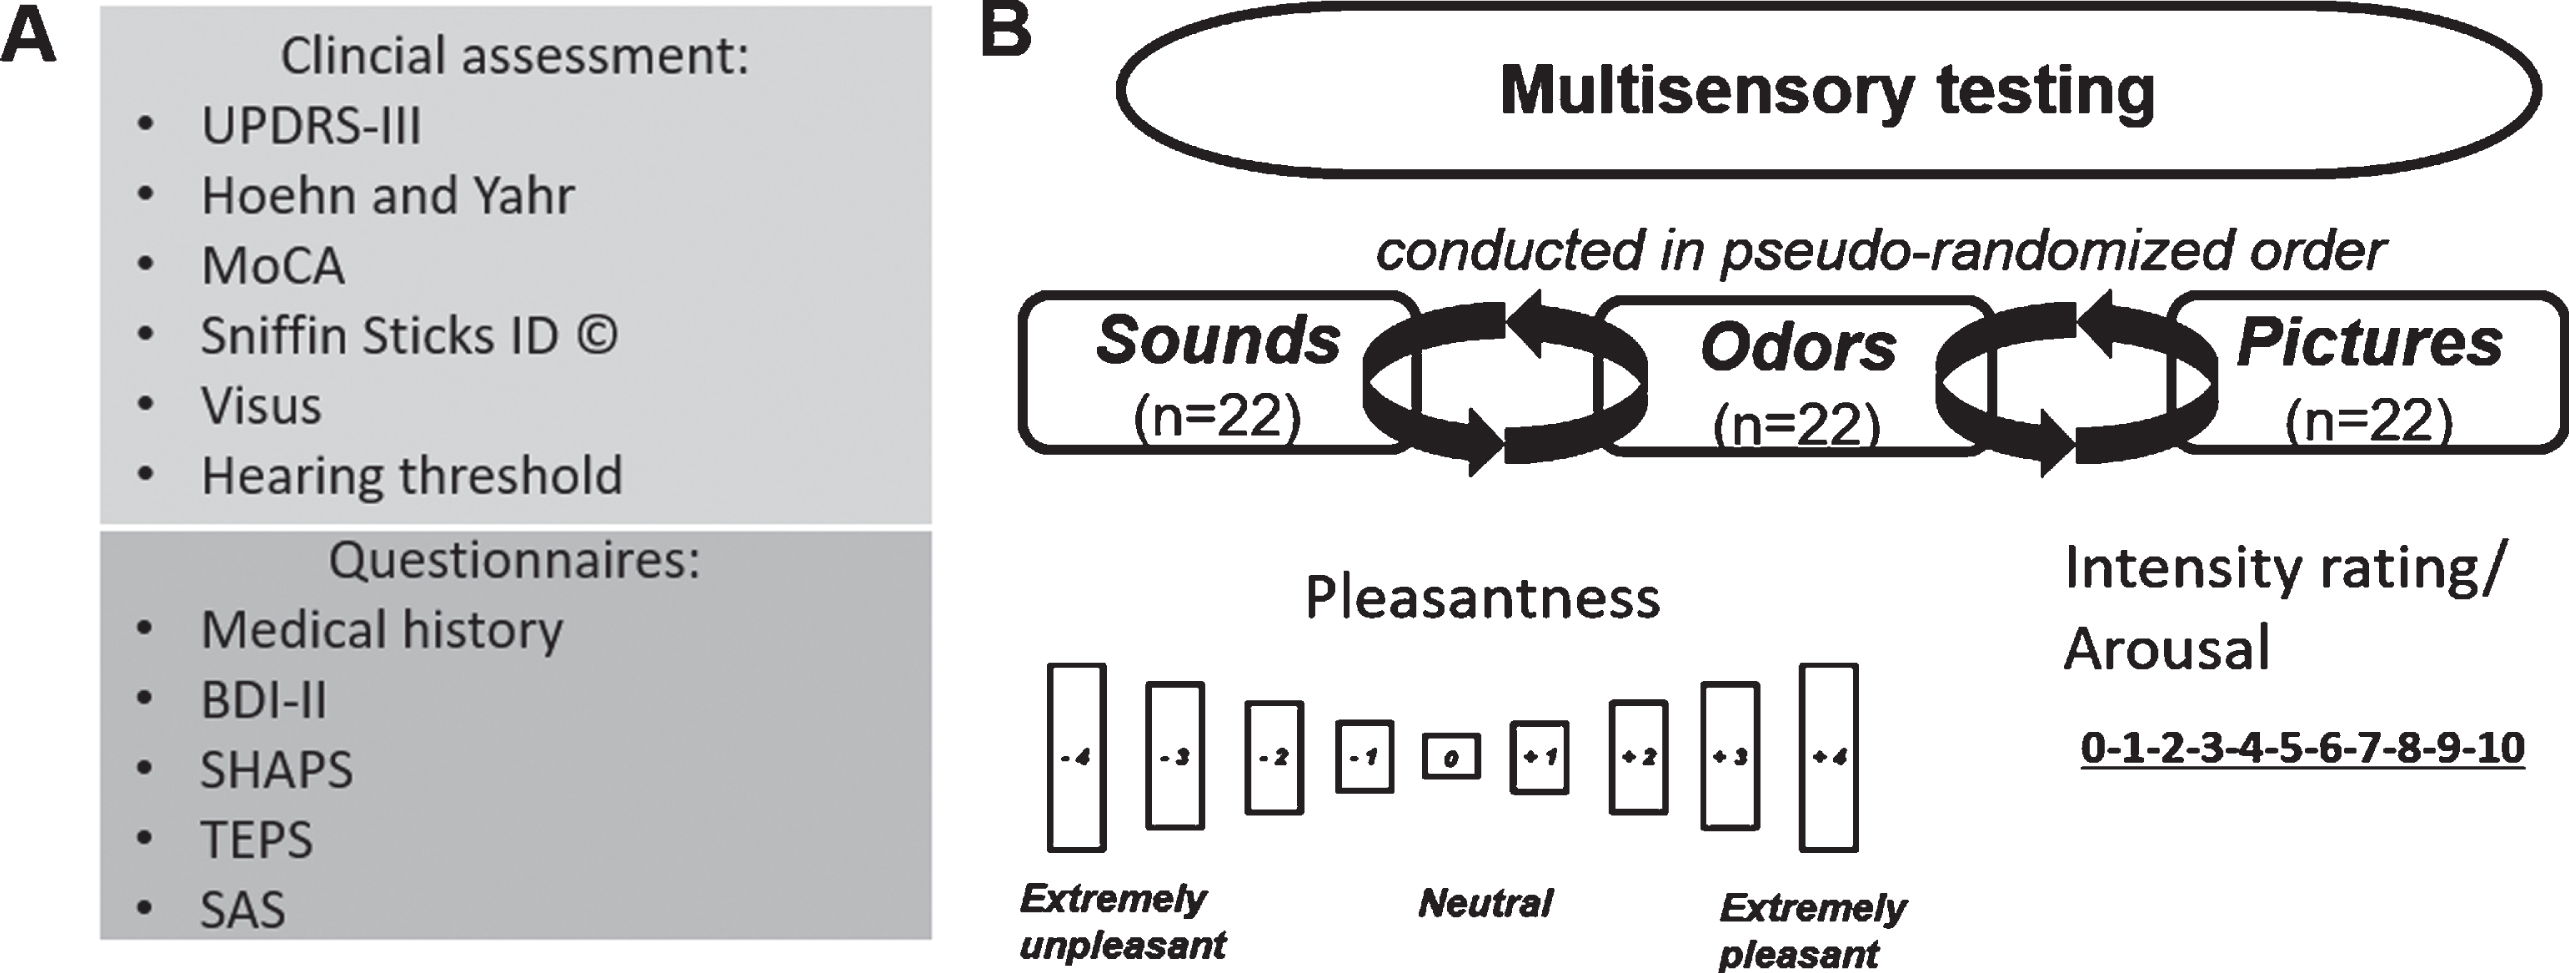
Assessment and study paradigm. A) Clinical and questionnaire-based assessment. B) Evaluation of pleasantness of sounds, odors, and pictures. Each sensory modality was tested using 22 stimuli, spanning a range from very unpleasant to very pleasant. Each stimulus had to be rated on a 9-point Likert scale from very unpleasant to very pleasant, and on a 11 point scale from 0 = calm/relaxed to 10 = very excited.
Clinical assessments and psychometric questionnaires
PD was diagnosed based on current diagnostic criteria [1]. Healthy controls did not present with prodromal symptoms suggestive of PD [2]. Severity of motor symptoms of PD patients was assessed using part three of the Unified Parkinson’s Disease rating Scale (UPDRS-III) [12]. Disease stage was classified using the Hoehn & Yahr scale (H&Y) [12]. Hyposmia was tested using the standardized Sniffin’ Sticks (Sniffin ID Test, Burghart Messtechnik, Germany) odor identification test, as described previously [11]. Briefly, subjects were required to identify 16 common odors (orange, shoe leather, cinnamon, peppermint, banana, lemon, liquorice, turpentine, garlic, coffee, apple, clove, pineapple, rose, anise, and fish). Odor sticks were presented with four choices for each odor. Odor identification performance was rated as “normosmic” or “hyposmic” using previously established normative data [13]. Cognitive function was evaluated using the MoCA [14]. To assess depressive symptoms, we used the Beck Depression Inventory, Version II [17]. Based on BDI scores, patients were classified as having minimal, mild, moderate or severe depression. Anhedonia was assessed via the Snaith-Hamilton-Pleasure-Scale (SHAPS) [15, 16] and a German translation [17] of the Temporally Experienced Pleasure Scale (TEPS) [18], which allows a separate assessment of anticipatory and consummatory anhedonia. The SHAPS comprises 14 items, whereby events and experiences, e.g., in leisure time or social interaction, must be evaluated. This results in a spectrum from 0 to a maximum of 14 points and a recommended cut-off value > 2 for differentiation between normal and anhedonic subjects, with higher results indicating more pronounced anhedonia [16, 18]. The TEPS also serves to detect potential anhedonia, but additionally distinguishes between anticipatory anhedonia (TEPS-ANT), meaning pleasure from imagining a future activity and consummatory anhedonia (TEPS-CON), reflecting the pleasure perceived during an activity. The TEPS has a high internal consistency and retest reliability for the separate components and as a whole. In completing the TEPS, subjects must answer a total of 18 questions on a six-point Likert scale (1 = “I strongly disagree” to 6 = “I strongly agree”), of which 10 questions are assigned to the TEPS-ANT section and 8 questions to the TEPS-CON section. This results in a range of 18 to 108 points. For the TEPS-ANT, 10 to 60 points can be achieved, and 8 to 48 points for the TEPS-CON. There is an inverse relationship between the score achieved and the anhedonia present, i.e., higher scores imply lower anhedonia [19]. Apathy was assessed using the Starkstein Apathy Questionnaire (SAS) [20]. The SAS is recommended by the Movement Disorders Society for screening for and determining the severity of apathy [21]. Following the original recommendation of Starkstein and colleagues, a point value of 14 points was chosen as a cut-off to differentiate between apathetic and non-apathetic participants [22]. Visual function was determined using standard visual acuity tests performed routinely in the outpatient movement disorder center. The patient must read rows of numbers or letters at a given distance from a visual display. Both left and right eye as well as bilateral visual acuity were determined. If subjects needed visual aids (glasses or contact lenses), these could be used. A vision panel (Good-Lite® #758300; 9.5 cm×15.9 cm) was used to examine near vision, presented at a distance of 40 cm. To determine distance visual acuity, each participant additionally had to read rows of numbers on a visual chart (Oculus® No. 46166; 29 cm×49 cm) at a distance of 5 m. Hearing was measured using an electrophysiological hearing threshold determination. There, a 1000 Hz sound is presented via headphones and the sound pressure level is incrementally decreased (dbA). The initial volume is set at a level that the patient is able to hear easily. Successive reduction follows until the patient only approximately perceives the acoustic signal. The described procedure was performed separately for the left and right ear. If participants were not able to hear the sound at volumes >60 db, they were excluded from the study. All assessments were conducted in the “on” state under regular dopaminergic medication.
Measurement of affective perception
Three different tests were designed to capture the spectrum of affective evaluation from unpleasant to pleasant for odors, sounds and pictures. For each sensory modality, 22 stimuli were applied. The tests were conducted in a pseudo-randomized sequence, whereby the sequence of stimuli within each test was unchanged (Fig. 1B).
Affective evaluation of olfactory stimuli
The analysis of affective evaluation of olfactory stimuli, was performed as described previously [12]. Briefly, 22 different odors were used covering the entire spectrum from extremely unpleasant to very pleasant. These were presented to the subjects using Sniffin’ Sticks (Sniffin ID Test, Burghart Messtechnik, Germany). The methodology for conducting the affective test series was based on the Sniffin ID procedure, as described previously [13, 23]. Participants were given an explanation of the concept of pleasantness and odor intensity and were instructed to concentrate for 6 s on the odors presented. Afterwards they had to evaluate pleasantness, and odor intensity. Regarding pleasantness, each odor had to be evaluated on a 9-point Likert Scale (–4 = “extremely unpleasant” to +4 = “extremely pleasant”). Odor intensity was evaluated on an 11-step scale (0 = “very weak” to 10 = “very strong”). The following 22 odors were presented: peppermint, clove, apple, turpentine, pineapple, garlic, banana, fish, peach, butter, coconut, butyric acid, vanilla, butyric acid, raspberry, indole, ice candy, skatole, lemon, civette, orange, and valeric acid.
Affective evaluation of visual stimuli
Visual stimuli consisted of a selection of 22 images taken from the International Affective Picture System (IAPS), developed at the National Institute of Mental Health (NIMH) “Center for Emotion and Attention” at the University of Florida [23]. It provides a wide range of pictures, covering the entire affective range from positive to negative. All images of the IAPS are colored and the affective quality can be captured easily and quickly. The 22 selected pictures for this study included images of different scenes, with attention paid to balanced proportions of negative, neutral, and positive stimuli, representing the entire spectrum of affective perception based on population-based values available for the IAPS-2 [23]. Images were presented to participants in the form of a standardized PowerPoint presentation at a distance of 40 cm, in an upright sitting position and under constant lighting conditions (see Supplementary Material). The images were presented on a 19-inch monitor (Fujitsu®) with a resolution of 1280×1024 pixels. The images measured between 34 cm×25 cm in landscape format and 19 cm×25 cm in portrait format. Prior to testing, the definition of valence and arousal was explained to the participants by 3 so-called “anchor images” (starving child [“unpleasant”], basket [“neutral”], sea [“pleasant”]) to ensure understanding of the methodology. Presentation and rating of pictures was performed in analogy to the procedure described by Lang et al. [23]. For each stimulus, a preparation phase of 5 s, a presentation of the stimulus for 6 s, and an evaluation period of 15 s, were provided. All study participants were instructed to concentrate on the presented images for the entire 6 s before rating valence and arousal. Pleasantness was rated for each stimulus on a 9-level scale (–4 = “extremely unpleasant” to +4 = “extremely pleasant”). Arousal was evaluated on an 11-level scale (0 = “calm/relaxed” to 10 = “excited”).
Affective evaluation of acoustic stimuli
To evaluate the affective perception of acoustic stimuli, a selection of 22 sounds was taken from the International Affective Digitized Sounds-2 (IADS-2) catalog, a collection of 167 tones and sounds developed by the NIMH “Center for Emotion and Attention” at the University of Florida covering the entire affective range from unpleasant or negative to pleasant or positive [24]. We selected negative, neutral and positive sounds in equal proportions representing the entire spectrum of affective perception based on population-based values available for the IADS-2 [24]. In the selection process, we looked for similar affective values of the acoustic and visual stimuli. The sounds were presented to the study participants in the form of a standardized Power Point presentation via headphones (model K141, AKG®, Harman, Germany). Prior to testing, the definition of valence and arousal was exemplified to the subjects by 3 so-called “anchor tones” (bees humming [“unpleasant”], toilet [“neutral”], male laughter [“pleasant”]) to ensure the participant’s understanding of the methodology (see Supplementary Material). Presentation and rating of sounds was performed in analogy to the procedure described by Bradley et al. [24]. Briefly, a preparation phase of 5 s is provided prior to each tone, then the stimulus is presented for 6 s. Afterwards a timeframe of 15 s for the subjective classification of each tone is allowed. All participants were instructed to concentrate on the presented tones for the entire 6 s and to perform the subsequent evaluation of valence and arousal. Evaluation of pleasantness and arousal was analogue to the evaluation of visual stimuli.
Statistics
Participants rated pleasantness of each stimulus from –4 (very unpleasant) to +4 (very pleasant). Therefore, positive mean values indicate a pleasant stimulus, whereas negative mean values indicate unpleasant stimuli. In addition, the mean deviance from neutral of all stimuli combined for each sensory system and group is given as an absolute score (0 to 4), reflecting an absolute measure of the range of perceivable pleasantness in a sensory system. Statistical analysis was performed using SPSS® (Version 25.0, IBM®). A Shapiro-Wilk test was performed to assess normal distribution of variables. A student’s t-test was used for age comparison and the χ2-test to assess differences in gender distribution. Nonparametric tests used were Mann-Whitney U-test and Kruskall-Wallis for group comparisons. Additionally, covariance analyses (ANCOVA) and Kruskall-Wallis tests were performed followed by Bonferroni post-hoc correction. Correlation was analyzed using Spearman’s correlation coefficient. The significance level was set at 0.05. If not explicitly stated otherwise, the results are given as mean±standard error.
RESULTS
Descriptive data
During a period of 18 months, a total of 76 participants were recruited, 14 of whom were excluded due to an exclusion criterion such as insufficient visual acuity (n = 6), hearing (n = 2), performance below the cutoff for mild cognitive impairment within the MoCA (n = 7) and previous craniocerebral trauma and/or surgery (n = 2). The final study cohort consisted of 30 PD patients and 32 controls (Fig. 2). Table 1 describes the study population. PD patients did not differ from controls in regard to age, gender, visual acuity, hearing threshold, or cognitive status (all p > 0.05). Eight PD patients and two controls fulfilled the criteria for the diagnosis of apathy using the established cut-off of the SAS. Based on mean total score, however, no difference between PD patients and controls was observed. BDI-II scores differed significantly between groups. Eleven patients met the criteria of minimal depression, 1 patient met the criteria of mild depression, and 4 patients met the criteria of moderate depression. In controls, only 4 patients met the criteria of minimal depression, and 1 patient met the criteria of mild depression. SHAPS scores did not differ between patients and controls. As expected, there were significant differences in the “Sniffin Sticks” identification test. A total of 25 PD patients were classified as “hyposmic”, whereas only 1 control subject was classified as “hyposmic”. Depression was equally present in hyposmic and normosmic PD patients (Fisher’s exact test: p = 0.64).
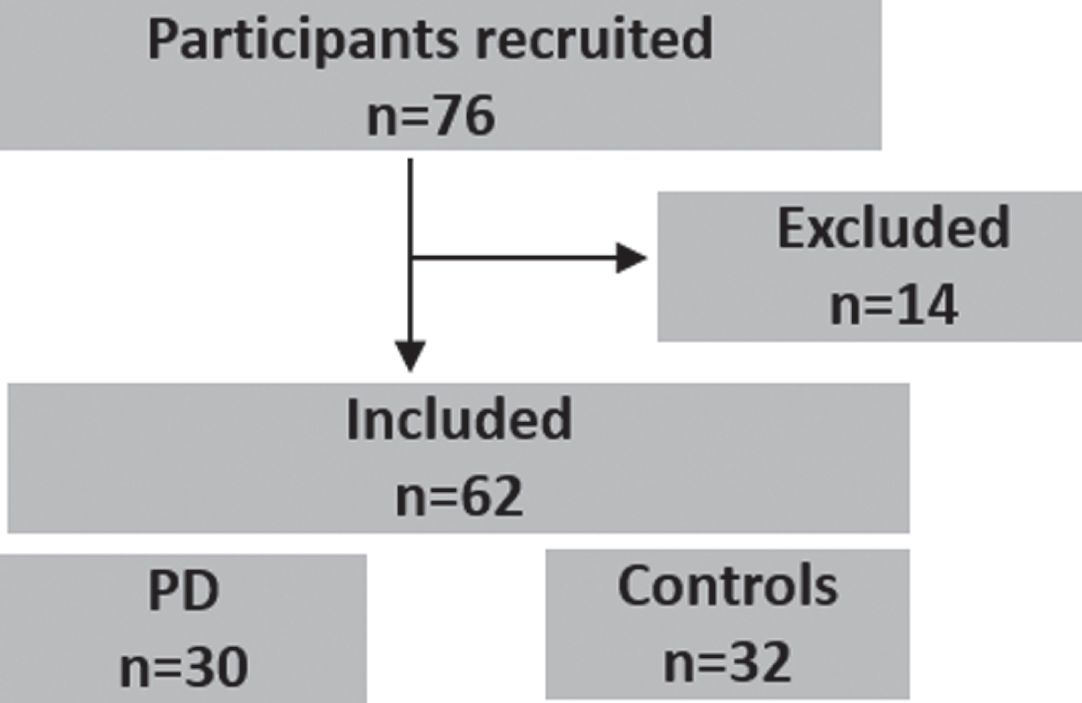
Flowchart of the study cohort.
Clinical characteristics of the study population
H&Y, Hoehn & Yahr; UPDRS, Unified Parkinson's Disease Rating Scale; LEDD, Levodopa Equivalent daily dose; BDI-II, Beck Depression Inventory II; SHAPS, Snaith-Hamilton Pleasure Scale; TEPS, Temporal Experience of Pleasure Scale; TEPS CON/ANT, TEPS subscale consummatory/anticipatory anhedonia; SAS, Starkstein Apathy Scale; MoCA, Montreal Cognitive Assessment, SNF, Sniffin Sticks. Data presented as mean±standard deviation [Range]. 1student’s t-test; 2χ2; 3Mann-Whitney U.
Reduced range in the affective evaluation of stimuli across sensory systems in PD
Reduced perception of odor pleasantness in PD
Groups showed significant differences in absolute affective point value (i.e., mean absolute deviance from neutral of all stimuli combined, reflecting the range of perceivable pleasantness) (PD patients: 1.2±0.6; controls: 2.0±0.4; p < 0.001) (Fig. 3B). After exclusion of hyposmic study participants, no difference was observed (PD patients: 1.6±0.3; Controls: 2.0±0.4; p = 0.090). Also, correcting for “hyposmia” using an ANCOVA abolished the observed difference between PD and controls (F = 2,817, p = 0.099). The individual analyses of the odors showed that the affective evaluation differed significantly between groups in 18 of 22 odors (Fig. 3A). Fish (p < 0.001), valeric acid (p = 0.002), indole (p = 0.001), butyric acid (p = 0.031), iso-butyric acid (p < 0.001), skatole (p < 0.001), butter (p = 0.039), ice candy (p = 0.041), apple (p = 0.046), raspberry (p = 0.002), pineapple (p = 0.001), banana (p = 0.002), orange (p < 0.001), peppermint (p = 0.001), peach (p < 0.001), lemon (p < 0.001), coconut (p = 0.001), and vanilla (p = 0.001) were evaluated significantly different.
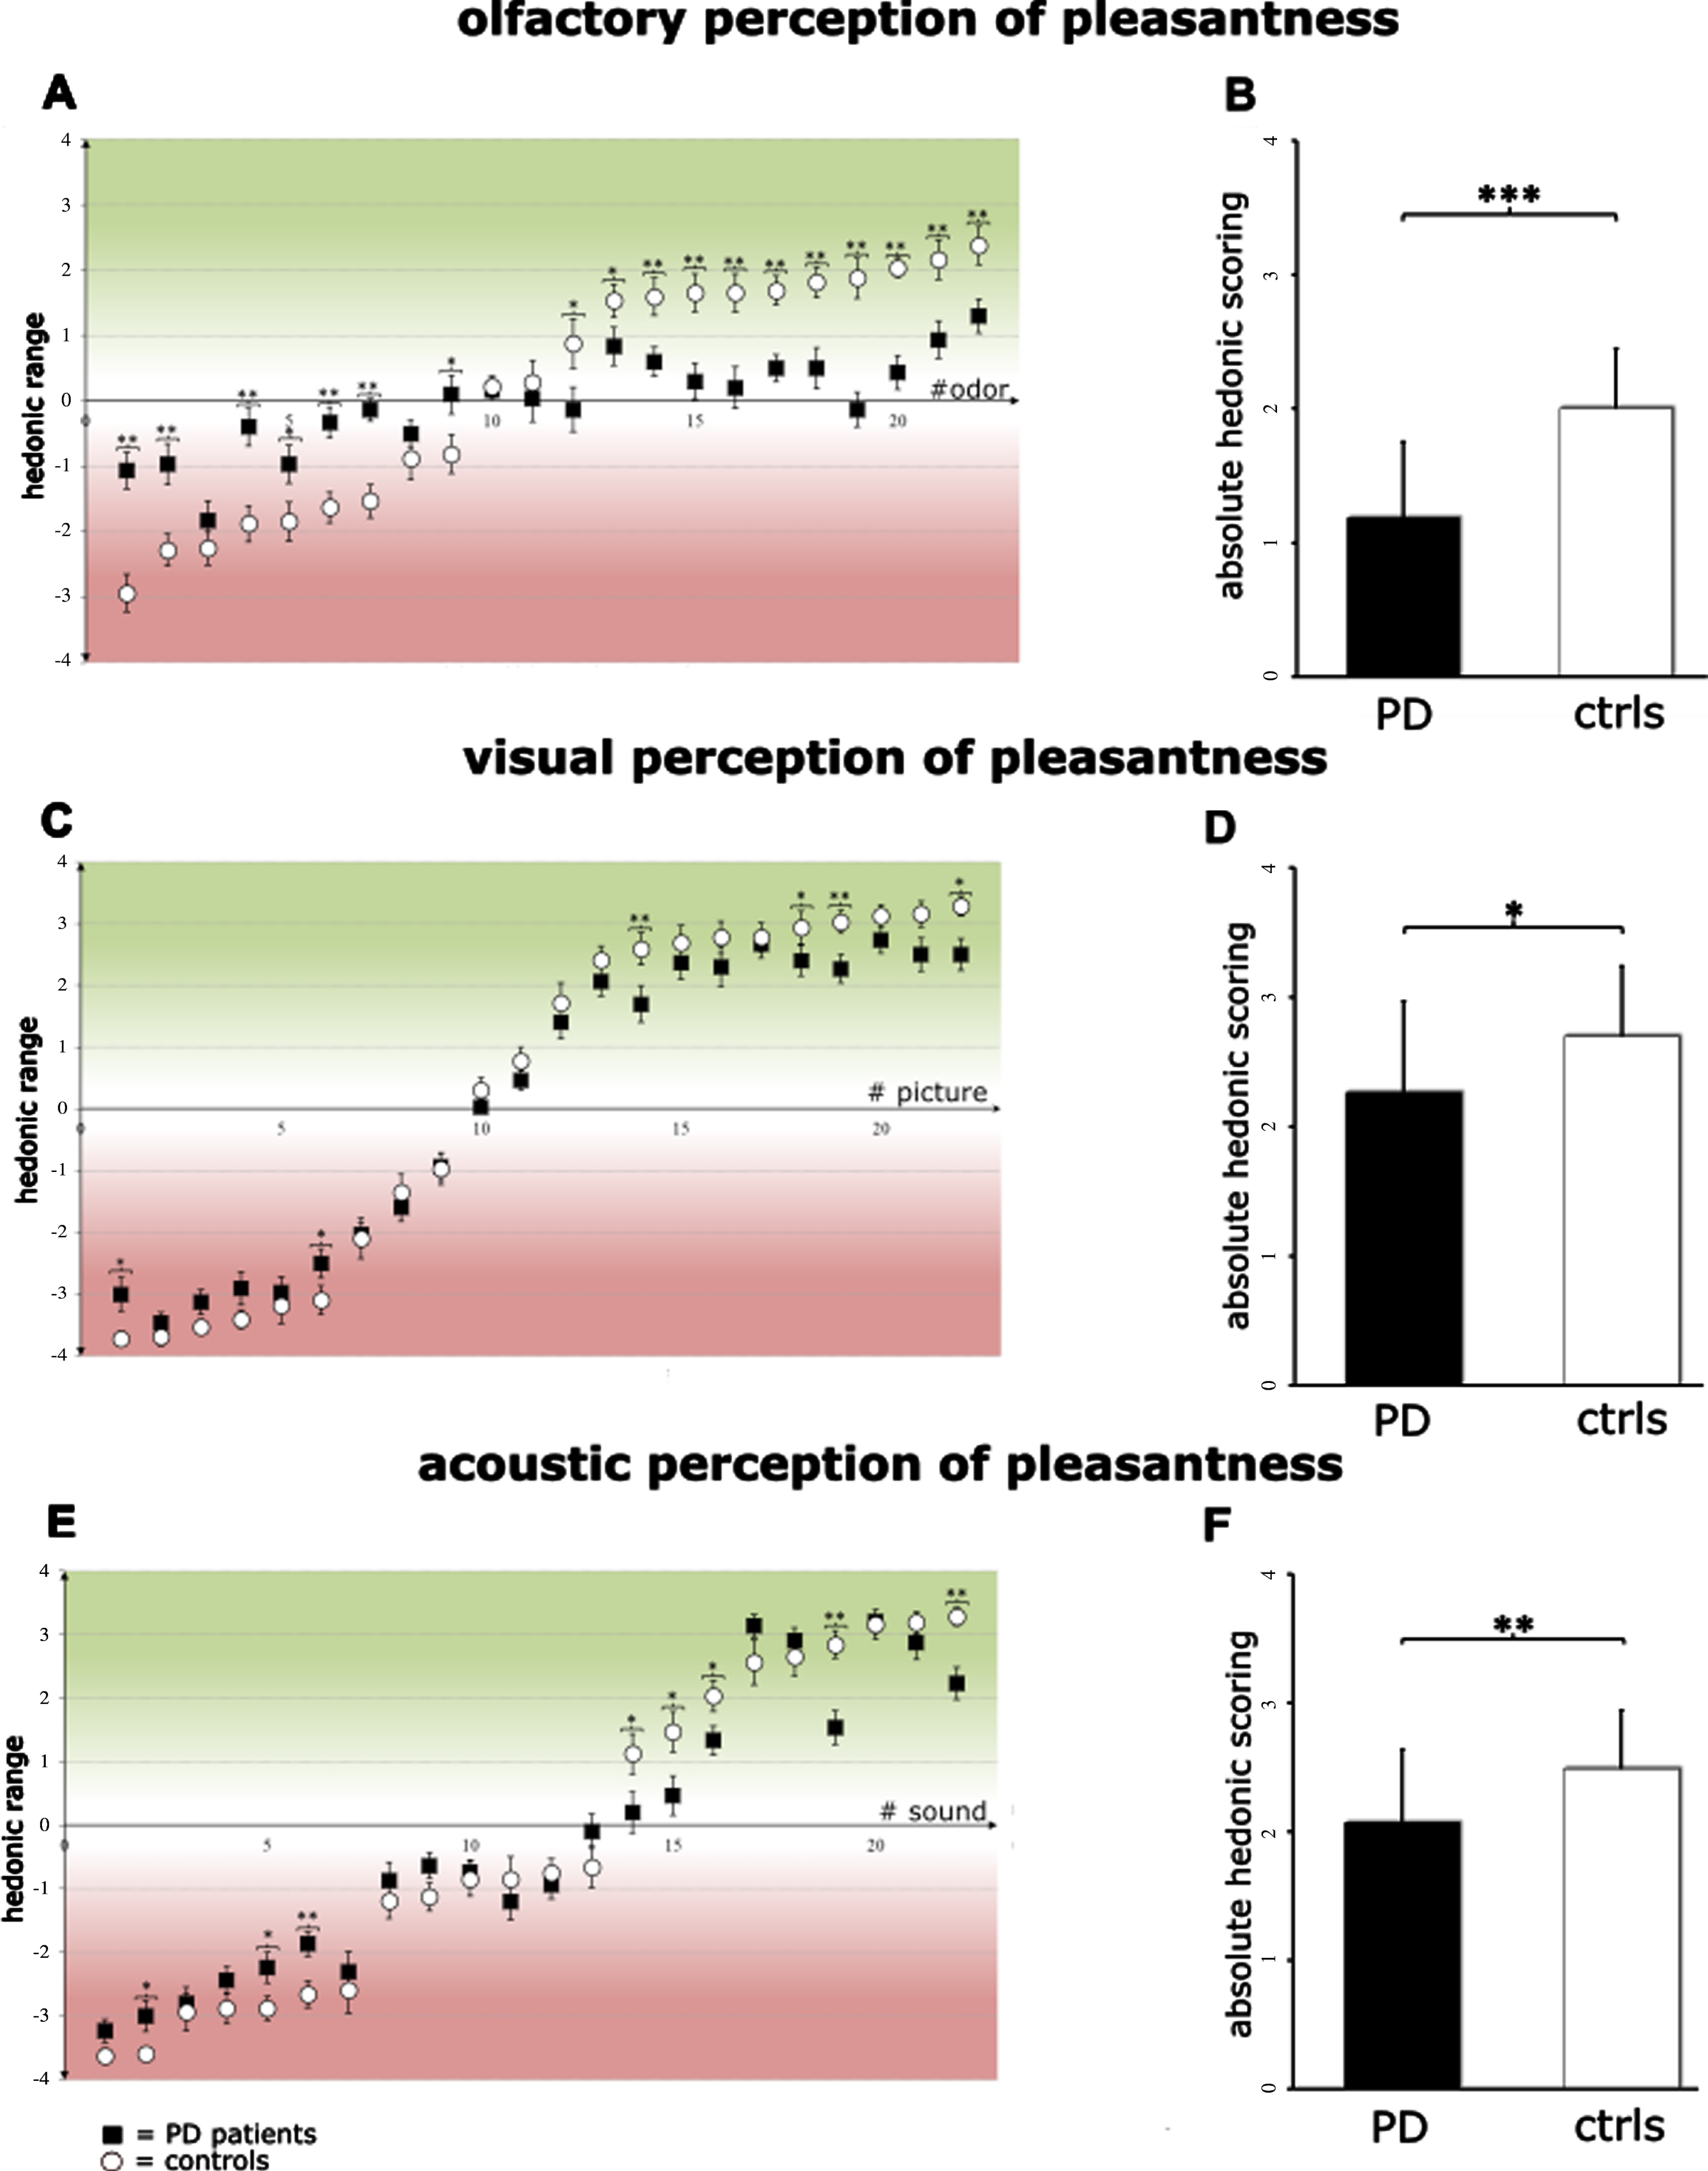
Perception of pleasantness (“hedonic perception”) in different modalities. The evaluation of pleasantness (from –4 to +4) of the 22 stimuli for the A) olfactory, C) visual, E) acoustic modality. Note that the range of hedonic perception in PD patients (black squares) is reduced compared to healthy individuals (white circles) and significantly so for 18 olfactory, 6 visual, and 8 acoustic stimuli. The absolute affective scores (from 0 to +4) for all 22 stimuli of the respective modality are reduced in PD patients (black bars) compared to healthy individuals (white bars) in the B) olfactory, D) visual, and F) acoustic modality. *<0.05; **<0.01; ***<0.001.
Taken together, the present odor assessment conformed previous findings [12] showing a deficit in the perception of pleasantness of odors in PD with hyposmia being a significant confounder. Stimuli at the extreme ends of the valence range seem to be perceived less pronounced by PD patients,
Reduced perception of visual pleasantness in PD
Groups differed significantly with respect to the absolute affective point value (PD patients 2.3±0.7; controls: 2.7±0.5; p = 0.018) of the visual stimuli (Fig. 3D). Out of 22 visual stimuli, significant differences in affective rating were observed for 6 images (Fig. 3C). From the most unpleasant to the most pleasant stimulus, burn victims (p = 0.016), ruins (p = 0.031), fireworks (p = 0.009), beach (p = 0.036), boat (p = 0.009), and birds (p = 0.017) were classified significantly different.
Reduced perception of acoustic pleasantness in PD
The two cohorts differed significantly with respect to the absolute affective point value (PD patients: 2.1±0.6; Controls: 2.5±0.5; p = 0.009; Fig. 3F). Affective assessment of acoustic stimuli revealed significant differences for 8 out of 22 sounds (Fig. 3E). Vomiting (p = 0.039), buzzing (p = 0.047), shattering glass (p = 0.005), seagull (p = 0.037), chickens (p = 0.030), applause (p = 0.048), sparkling drink (p = 0.001), and robin (p = 0.001) were rated significantly different between groups.
In summary, the range of affective evaluation of sounds and pictures is reduced in PD as a result of a reduced evaluation in a subset of stimuli. However, the effects for the visual and acoustic system are considerably smaller compared to the alterations observed in the olfactory system. Since we did not observe a significant difference between controls and PD after correcting for hyposmia, the magnitude of the effect within the olfactory system appears to be due to hyposmia.
Correlation between modalities
There was a significant correlation between mean absolute scores for visual and acoustic stimuli (rs = 0.667; p < 0.001), olfactory and visual (rs = 0.501; p < 0.001) stimuli, as well as for the olfactory and acoustic modality (rs = 0.491; p < 0.001). When regarding the groups separately, the same pattern was found for healthy individuals. In PD patients only visual and acoustic scores correlated significantly (rs = 0.604; p < 0.001).
Correlation with psychometric scores
Next, we aimed to analyze, whether the affective evaluation of sensory stimuli is correlated with depression, anhedonia or apathy. Spearman’s correlation analyses did not reveal any association between SHAPS, TEPS, TEPS CON, and TEPS ANT with the absolute affective point value of olfactory stimuli (Table 2). We observed a significant correlation between SHAPS, TEPS, TEPS CON, and TEPS ANT with the absolute affective point value for visual judgement of PD patients. This means that the more reduced the hedonic perception, the more pronounced anhedonia, as assessed via the SHAPS was apparent. Affective point values for sounds were not correlated with SHAPS values, while TEPS, TEPS CON, and TEPS ANT, bordered on being significant (Table 2).
Correlation between affective evaluation of sensory stimuli and psychometric questionnaires
BDI-II, Beck Depression Inventory II; SHAPS, Snaith-Hamilton Pleasure Scale; TEPS, Temporal Experience of Pleasure Scale; TEPS CON/ANT, TEPS subscale consummatory/anticipatory anhedonia. Spearman’s correlation (rs) was used. Note that SHAPS, TEPS, TEPS CON, and TEPS ANT only significantly correlated with the absolute affective scores of visual stimuli. No correlation between BDI-II scores and absolute affective scores in any modality was observed.
There was no correlation of the affective evaluation in any sensory modality with depressive symptoms assessed via BDI-II values, nor with SAS values. In addition, the affective range in apathetic and non-apathetic PD patients did not differ for the olfactory (p = 0.082), visual (p = 0.981), and acoustic (p = 0.240) system.
DISCUSSION
Based on the observation of a reduced affective olfactory evaluation in PD [11], the current study aimed to test the hypothesis whether these findings can be 1) confirmed, and 2) extended to the visual and acoustic sensory systems. Furthermore, our aim was to examine whether the affective evaluation of sensory stimuli is associated with overall scales of anhedonia, apathy or depression assessed via psychometric questionnaires to reveal if a deficit in hedonic categorization of stimuli can occur independently of depression and thus is an independent deficit.
In all sensory modalities, stimuli at the negative and positive poles of the tested spectrum were perceived less pronounced by PD patients, suggesting a multi-sensory phenomenon. This is corroborated by the correlation of the affective evaluations between modalities in the entire study population. The missing correlation between the olfactory and the other two modalities in PD patients is probably due to the confounding effect of hyposmia on olfactory ratings. This confounding effect was apparent after exclusion of hyposmic study participants as well as when correcting for hyposmia; in those cases no difference in odor pleasantness between PD patients and healthy controls was found. The confounding effect of hyposmia was also reported in our previous study [11]; however, group differences remained significant after controlling for hyposmia in the previous study. Potential reasons for this discrepancy are differences in sample size; the present study collective was smaller (n = 62) than the former (n = 103). Furthermore, there were differences concerning the occurrence of hyposmia. In the current study 83% of PD patients and 3% of healthy individuals were hyposmic, whereas in the previous study hyposmia was observed in 74% of PD patients. With regard to the affective evaluation of olfactory stimuli, it should be noted that women evaluate odors with a higher affective valence, regardless of odor intensity. With a proportion of 43% [11], female PD patients were more prevalent in our previous study compared to 28% in the present study. A correlation between anhedonia, measured by TEPS CON, TEPS ANT, and SHAPS, and the affective evaluation of sensory stimuli was found for visual affective assessment, which only partially confirmed our hypothesis of an association between affective evaluation of sensory stimuli and anhedonia as assessed using questionnaires. In our previous study [11] with a larger sample size, the affective evaluation of odors correlated negatively with SHAPS (TEPS was not assessed).
One limitation of this study is the low prevalence of anhedonia in the examined cohort. Only 3.3% of PD patients met the criteria of anhedonia as assessed on the basis of questionnaires, compared to 9% in the former study collective. This low prevalence of anhedonia in our cohort might be the reason why we did not find a correlation of the questionnaires with olfactory and acoustic pleasantness due to the fact of a low variability of the variable SHAPS ratings in the PD cohort. Therefore, future studies should aim at including participants scoring higher on questionnaires assessing anhedonia as the SHAPS. Participants were allowed to show at most a mild cognitive impairment (MoCA 23–26 points) for study participation. However, since there is evidence of a correlation between impaired cognition and apathy [10, 25–27], this could be a reason for the low prevalence of apathetic patients and the lack of correlation between psychometric questionnaires and affective evaluation. It could also be that altered affective evaluation occurs before apathy in the course of disease, and thus might be a prospective marker for apathy.
It should be noted that all patients were examined in “on” state and showed a higher levodopa equivalent daily dose than in the previous “proof-of-principle” study. Consequently, dopaminergic medication might be able to alter the anhedonic perception and apathetic symptoms and exert an interfering influence on the affective assessment spectrum. With regard to sensory NMS, hearing loss, deficient color discrimination, reduced perception of color contrast and diplopia have been described for PD patients [28–30]. In the current study this fact was taken into account by recording near and far vision and determining the hearing threshold. Controls and PD patients did not differ in visual and auditory acuity and significant differences in the evaluation of sensory stimuli were still present after controlling for both covariates. Besides this, the affective evaluation might have been influenced by unrecorded limitations in the sensory modalities tested. Regarding olfactory stimuli, it is debatable whether the fact that 10 of the 22 odors (see Methods section) were already presented in the Sniffin Sticks ID had an effect on the affective evaluation. Thus, initially provoked reactions may have been attenuated when the odor was perceived again and may have had an effect on the later affective evaluation through a habituation effect, although it must be noted that there was only a very short exposure time of 6 s [31].
In agreement with the previous study [11], no relation was found between depression and affective evaluation of sensory stimuli, supporting the notion that a limited affective evaluation spectrum occurs in PD regardless of depressive symptoms.
To sum up, we found a reduced range in the affective evaluation of olfactory, visual and acoustic stimuli in PD patients, indicating a multisensory deficit. However, except for the visual modality, no clear correlation between reduced hedonic perception and self-rated anhedonia could be found. We assume that this lack of a correlation with anhedonia is due to the low prevalence of anhedonia in our sample. We also found no association between apathy or depression with the reduced perception of pleasantness. This study points to a number of questions that should be addressed in future studies: 1) Is a deficit in pleasantness-perception a biomarker for other NMS in PD? 2) Does such a deficit precede the onset of apathy and anhedonia as measured by questionnaires? 3) Can we use functional imaging to identify the pathological correlates of deficient affective sensory perception? 4) How can we account for the hedonic sensory deficits in PD?
Footnotes
ACKNOWLEDGMENTS
The authors thank the participants of the study. FM and PS are supported by the Interdisciplinary Center for Clinical Research (IZKF) at the University Hospital of the University of Erlangen-Nürnberg (Clinician Scientist Program). This study was funded by the Irmgard und Georg Wehrfritz Stiftung, as well as the Adalbert Raps Foundation. VL is supported by the IZKF Erlangen. FM and JW are supported by the “Forschungsstiftung Medizin” of the University Hospital Erlangen, and the Bavarian Research Consortium “Interaction of Human Brain Cells”(ForInter) which is funded by the Bavarian Ministry of Science and the Arts. The funding sources had no impact on the study design.
CONFLICT OF INTEREST
The authors have no conflict of interest to report.