
Abstract
Background:
We have hypothesized that Parkinson’s disease (PD) comprises two subtypes. Brain-first, where pathogenic α-synuclein initially forms unilaterally in one hemisphere leading to asymmetric nigrostriatal degeneration, and body-first with initial enteric pathology, which spreads through overlapping vagal innervation leading to more symmetric brainstem involvement and hence more symmetric nigrostriatal degeneration. Isolated REM sleep behaviour disorder has been identified as a strong marker of the body-first type.
Objective:
To analyse striatal asymmetry in [18F]FDOPA PET and [123I]FP-CIT DaT SPECT data from iRBD patients, de novo PD patients with RBD (PD+RBD) and de novo PD patients without RBD (PD-RBD). These groups were defined as prodromal body-first, de novo body-first, and de novo brain-first, respectively.
Methods:
We included [18F]FDOPA PET scans from 21 iRBD patients, 11 de novo PD+RBD, 22 de novo PD-RBD, and 18 controls subjects. Also, [123I]FP-CIT DaT SPECT data from iRBD and de novo PD patients with unknown RBD status from the PPPMI dataset was analysed. Lowest putamen specific binding ratio and putamen asymmetry index (AI) was defined.
Results:
Nigrostriatal degeneration was significantly more symmetric in patients with RBD versus patients without RBD or with unknown RBD status in both FDOPA (p = 0.001) and DaT SPECT (p = 0.001) datasets.
Conclusion:
iRBD subjects and de novo PD+RBD patients present with significantly more symmetric nigrostriatal dopaminergic degeneration compared to de novo PD-RBD patients. The results support the hypothesis that body-first PD is characterized by more symmetric distribution most likely due to more symmetric propagation of pathogenic α-synuclein compared to brain-first PD.
INTRODUCTION
Parkinson’s disease (PD) is characterized by neuronal α-synuclein (α-syn) aggregation and loss of nigrostriatal dopaminergic innervation. The diagnosis of PD requires the presence of bradykinesia in combination with rest tremor and/or rigidity, even though PD patients exhibit a wide range of non-motor symptoms [1]. Also, unilateral motor onset is accepted as a supporting diagnostic feature of PD although a substantial fraction of patients present with more symmetric symptoms at time of diagnosis [2].
It has been suggested that initial pathological α-syn aggregates form in peripheral enteric nerve terminals and subsequently spread to the sympathetic nervous system and dorsal motor nucleus of the vagus via autonomic connections [3–5], although some researchers oppose this concept [6, 7].
We recently hypothesized that the Lewy body disorders, PD and dementia with Lewy bodies (DLB), can be divided into two overall subtypes based on the origin site of the first pathogenic α-syn; a body-first subtype showing initial involvement of the peripheral nervous system with subsequent retrograde propagation of α-syn aggregates to the central nervous system (CNS) via autonomic connections, and a brain-first subtype with initial involvement of CNS structures followed by anterograde spreading to the peripheral nervous system [8, 9]. The vast majority of patients with isolated REM sleep behaviour disorder (iRBD) develop PD, DLB, or rarely multiple system atrophy (MSA) over time [10]. We previously demonstrated that iRBD patients display severe peripheral parasympathetic and sympathetic neuronal dysfunction but no or only minor nigrostriatal dopaminergic involvement. Thus, we define a body-first subtype when RBD develops prior to motor symptoms (premotor), whereas newly diagnosed PD patients without RBD and patients in whom RBD emerges after motor symptoms are defined as brain-first [8].
Our recently proposed “α-Syn Origin site and Connectome model (SOC)” predicts that body-first patients will generally develop more symmetric dopaminergic degeneration, whereas brain-first patients will generally develop more asymmetric dopaminergic degeneration. In body-first patients, the retrograde propagation of pathogenic α-syn from peripheral to central structures occurs through overlapping vagal connections [11]. The intra-cerebral pathology is therefore more symmetric from the onset, leading to subsequent symmetric ascending pathology in the brainstem and more symmetric dopaminergic degeneration. By contrast, if initial pathogenic α-syn arises in a single location in brain-first patients, this pathology will by necessity occur unilateral at the onset. Since ipsilateral connections of the cerebrum outnumber contralateral projections by approximately 100-to-1, the α-syn will initially propagate mainly to the ipsilateral hemisphere including the ipsilateral substantia nigra, thus leading to asymmetric dopaminergic loss and significantly more motor asymmetry [11] (Fig. 1).
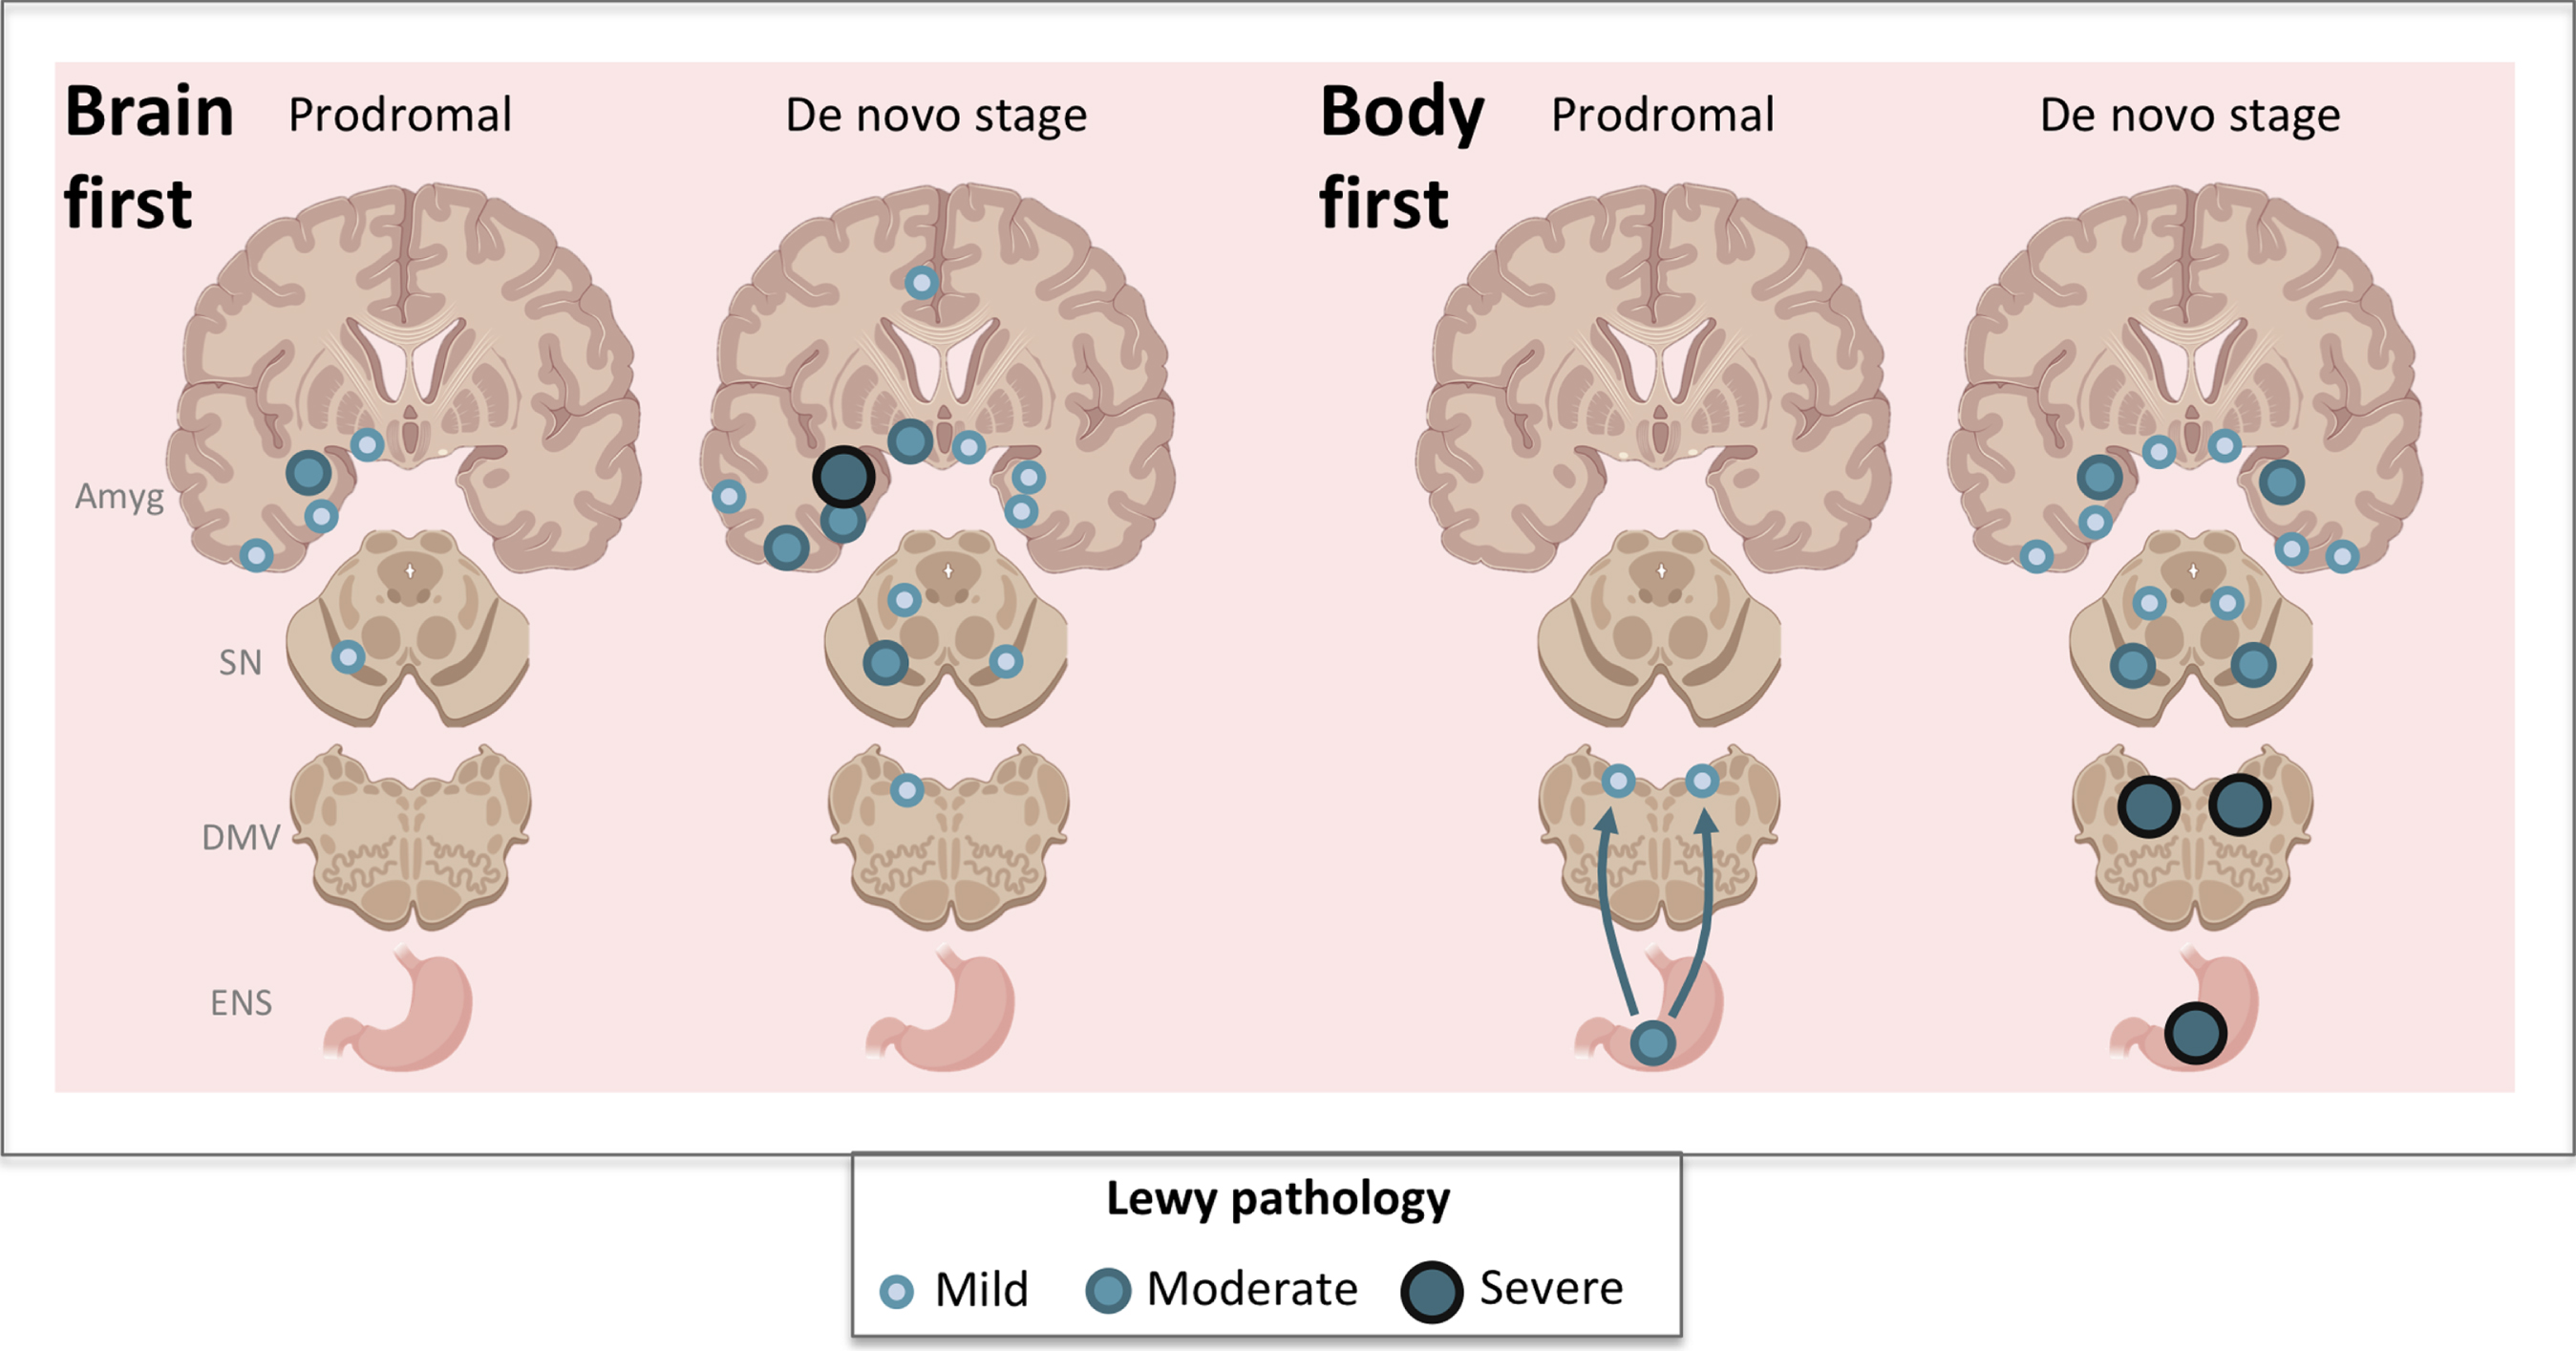
Schematic overview of the predictions of the SOC hypothesis.
In the present study, we used two different imaging datasets to test the predictions of the SOC model, i.e., that body-first patients on average display more symmetric dopaminergic degeneration, whereas brain-first patients on average display more asymmetric dopaminergic degeneration. We analyzed striatal asymmetry in an in-house [18F]-3,4-dihydroxy-6-(18)F-fluoro-L-phenylalanine (FDOPA PET) dataset and in [123I]-N-omega-fluoropropyl-2beta-carbomethoxy-3beta-(4-iodophenyl)nortropane (FP-CIT) dopamine transporter (DaT) SPECT (DaT SPECT) data from the PPMI dataset. The iRBD patients and de novo PD patients with RBD are considered body-first PD, and de novo PD patients without RBD are considered brain-first PD [11].
METHODS
Study participants and groups
FDOPA PET data was included from eligible subjects from two previously published studies [8, 12]. The study groups included 21 iRBD patients, 11 de novo PD patients with RBD (PD+RBD), 22 de novo PD patients without RBD (PD-RBD), and 18 healthy control subjects (HC) (see Fig. 2 for group overview. All imaging FDOPA PET and MR data were acquired with identical methodologies. In the patient groups, RBD status was polysomnography-confirmed. De novo PD status was defined as clinically probable PD according to the Movement Disorder Society (MDS criteria) [1]. For the de novo PD+RBD patients, subjective RBD symptoms had to be present for at least two years prior to motor symptom initiation. Inclusion criteria: age 50–85 years, (iRBD subjects) iRBD diagnosis according to International Classification of Sleep Disorders III [13], (de novo PD subjects) clinically probable PD according to MDS criteria. Exclusion criteria: psychiatric and other major brain disorders, inflammatory bowel disease, current or previous cancer and/or major surgery on abdominal organs. Of note, our previously published studies reported on the baseline imaging data from the 21 iRBD patients, but five iRBD patients have now been imaged at 3-years follow-up. In the present study, we used the most recent imaging data for each patient, i.e., baseline (n = 16), and follow-up data (n = 5).
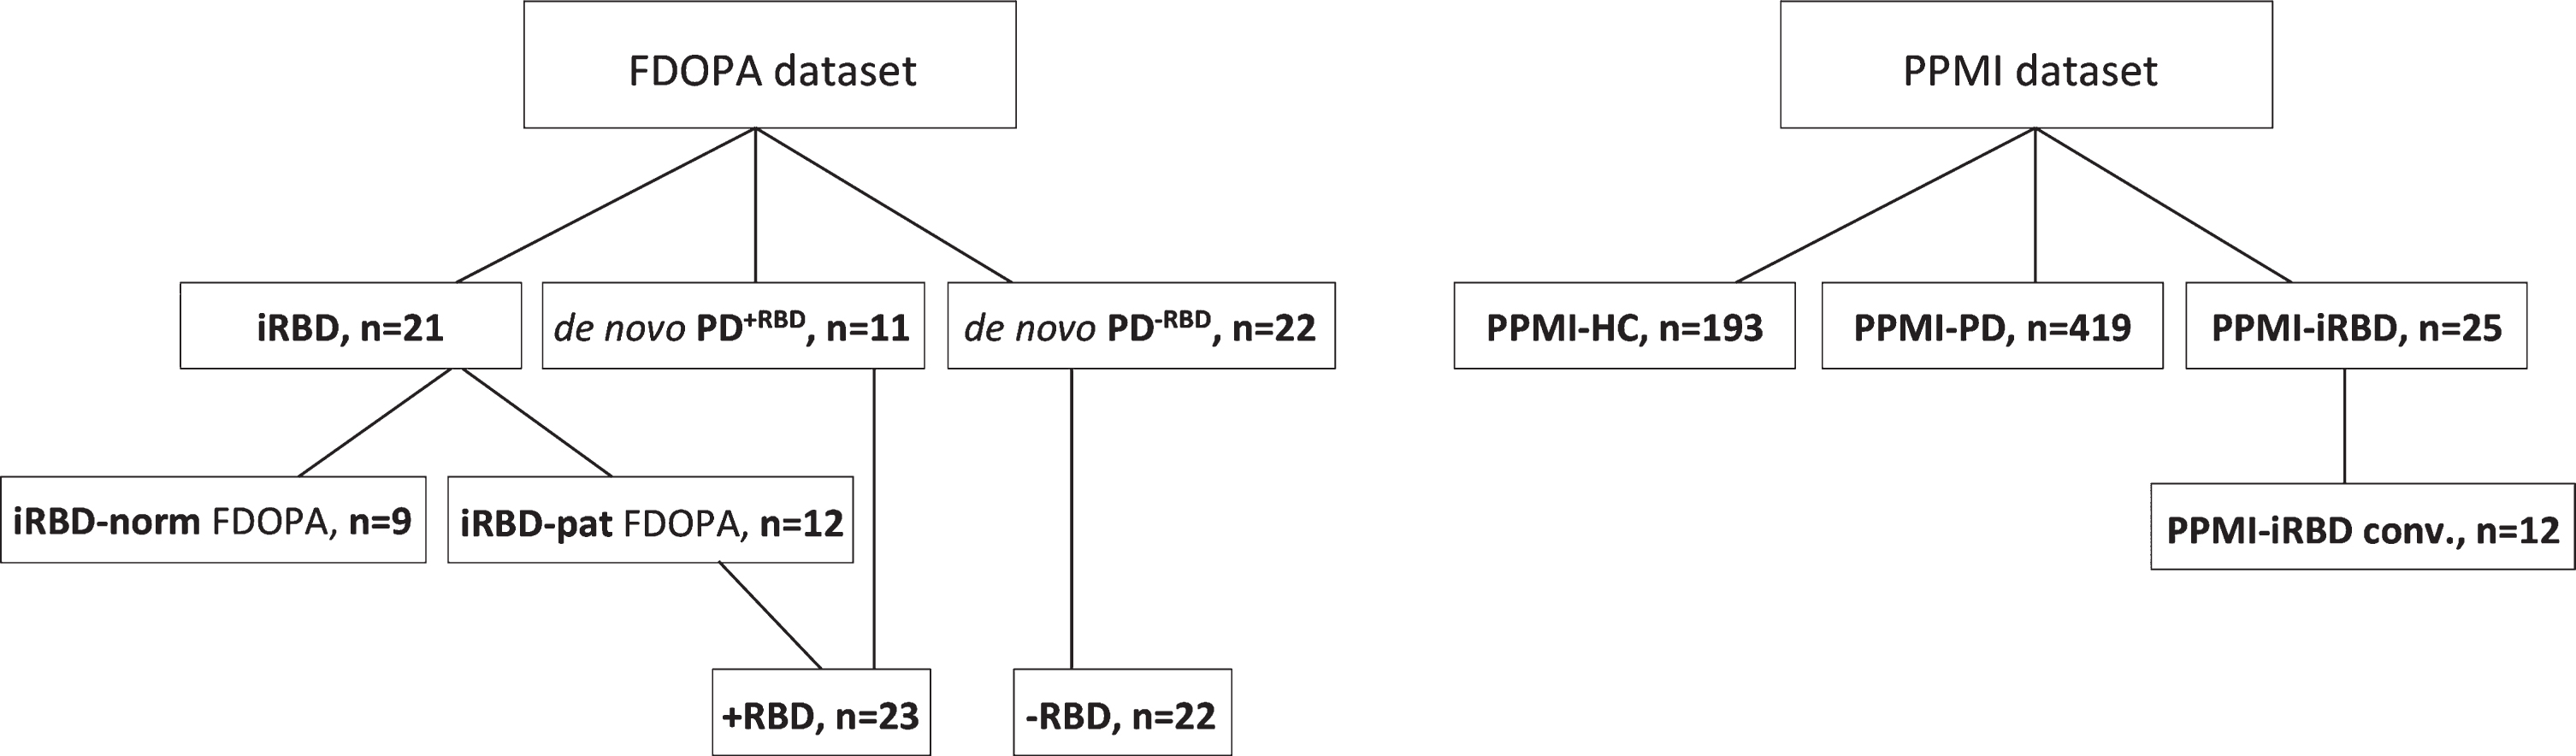
Diagram of the two datasets, FDOPA and PPMI with group titles and sample sizes. Details on FDOPA groups are presented in Table 1 and on PPMI groups in Table 2. iRBD, isolated REM sleep behavior disorder patients; PD+RBD, de novo Parkinson’s disease patients with REM sleep behavior disorder; PD-RBD, de novo Parkinson’s disease patients without REM sleep behavior disorder; iRBD norm FDOPA, the fraction of the iRBD group with normal FDOPA scans; iRBD pat FDOPA, the fraction of the iRBD group with pathological FDOPA scans; PPMI, Parkinson’s Progression Markers Initiative; PPMI-HC, PPMI healthy control subjects; PPMI-PD, PPMI de novo Parkinson’s disease patients; PPMI-iRBD, PPMI isolated REM sleep behavior disorder patients; PPMI-iRBD conv., PPMI-iRBD patients who progressed to PD or DLB during participation.
To verify iRBD diagnoses, overnight video-polysomnography (PSG) was performed as previously described [14]. Motor symptoms were assessed in iRBD and de novo PD subjects using the MDS Unified PD Rating Scale part III (MDS-UPDRS III) [15]. Olfactory function was scored using the Sniffin’ Sticks 16-item identification test (Burghart, Wedel, Germany) [16], and RBD symptoms with the RBD symptom questionnaire [17]. Orthostatic hypotension, defined as systolic pressure drop of 20 mmHg or diastolic pressure drop of 10 mmHg, was evaluated 15 min after supine rest, and for three consecutive minutes after tilting. Gastrointestinal function was evaluated using the radio opaque marker technique as previously described [18]. In short, a capsule containing 10 radio opaque markers was ingested each morning for 6 consecutive days. The number of retained markers was identified on a low-dose abdominal CT scan performed on day 7.
Motor asymmetry was calculated in the PD patients (including those iRBD patients, who had converted to PD in the PPMI dataset) by calculating the UPDRS-III difference score (left - right) for each of the extremities’ bradykinesia, rigidity, and tremor scores (items 3.3–8, 3.15–17). The final UPDRS-III difference score was the numerical value of the summed individual item difference scores.
Table 1 summarizes clinical and demographic data of iRBD and PD patient groups and HC data. Clinical assessment and FDOPA imaging was performed within a time window of maximum 4 months. The table also shows iRBD subgroups with normal FDOPA scans (iRBD-norm) and iRBD cases with pathological FDOPA scans (iRBD-pat). The study was approved by the Science Ethical Committee of the Central Denmark Region and conducted in accordance with the Helsinki Declaration. All subjects provided written informed consent prior to the study.
Clinical and demographic data of the FDOPA dataset. Clinical and demographic data from four groups: healthy controls (HC), de novo PD with RBD (PD+RBD), de novo PD without RBD (PD-RBD), and patients with isolated RBD (iRBD). The two right columns show the iRBD patients subgrouped into those with a normal FDOPA scan or a pathological FDOPA scan. Results are presented as mean (SD) or median (IQR). p-values indicate comparison of PD+RBD, PD-RBD, and iRBD groups. MDS-UPDRS, Movement Disorder Society-Unified Parkinson’s Disease Rating Scale; RBDSQ, REM Sleep Behavior Disorder Screening Questionnaire; ns, non-significant
PET data and study groups
All subjects underwent [18F]FDOPA scans. 150 mg of carbidopa was orally administered 1 h prior to [18F]FDOPA injection (110 MBq). Molar activity was 33 ± 9 GBq/mg and the average injected mass was 0.7 mg. Subsequent to a 6-min transmission scan, a 20-min PET acquisition was obtained 70-min post injection on an ECAT high-resolution research tomograph (Siemens/CTI, Knoxville, TN). T1 magnetic resonance imaging (MRI) of the brain was performed on a 3T Siemens SKYRA system. Analysis was performed in PMOD 3.8. PET data were reconstructed using a 3D-OSEM algorithm yielding dynamic PET data volumes. Motion corrected PET data were normalized to MNI space with rigid matching to the anatomical T1 MRI. Putaminal and occipital volumes of interest were defined using Hammers N30R83 atlas, and specific binding ratios (SBR) were calculated (putamen/occipital-1).
In our FDOPA dataset, a pathological scan was defined, when the lowest putamen SBR (left or right) was > 2 SD below healthy control average (cut-off SBR: 1.46). The degree of asymmetrical tracer binding in the putamen was assessed by calculating a putamen asymmetry index (AI) for all FDOPA scans using the most commonly used equation: ((putamenhighest-putamenlowest)/(putamenhighest +putamenlowest)). We only studied the putamen, since nigrostriatal degeneration affects the putamen before the caudate nucleus, and is therefore a more sensitive measure. When comparing the SBRs among our different groups, we used the lowest putamen SBR (i.e., lowest of the left or right putamen), since the lowest SBR best reflects how far the nigrostriatal degeneration has advanced in each patient.
Due to the small sample sizes of the iRBD-pat and de novo PD+RBD groups we chose to pool these data into one group (the combined group is termed +RBD). These patients all had a markedly pathological FDOPA PET signifying considerable nigrostriatal degeneration. We argue that pooling these two patient groups is a valid strategy (see discussion for further details). However, the iRBD-pat and de novo PD+RBD groups were also analyzed separately and compared to the de novo PD-RBD group.
PPMI data
We downloaded the Parkinson’s Progression Markers Initiative (PPMI) dataset in November 2020 from the PPMI website. The PPMI initiative is a multi-center study containing longitudinal data from more than 1400 individuals, including HC, de novo PD patients, and, in the prodromal part of the PPMI study (PPPMI), prodromal at-risk subjects such as iRBD patients. We included data from PPMI participants with dopamine transporter (DaT) scans. Data from ‘scans without evidence of dopaminergic deficit’ (SWEDDS), genetic mutation carriers, and prodromal hyposmic subjects were excluded. PPMI groups will be referred to as PPMI-HC (healthy controls, n = 193), PPMI-PD (de novo PD, n = 419), and PPMI-iRBD with pathological DaT SPECT (iRBD patients, n = 25). Demographic and clinical data are available in Table 2. The RBD diagnosis had been verified by video-PSG only in the PPMI-iRBD group. Therefore, we performed a comparison of the PPMI-iRBD group to the total PPMI-PD group. According to our hypothesis, this corresponds to a comparison of pure body-first PD to a mixed group of body- and brain-first PD.
In the PPMI data, a pathological scan was defined quantitatively when one putamen SBR was below the lower 2.5th percentile cut-off (1.122) of the PPMI-HC data. The putamen SBR and putamen AI was calculated with identical methodology to that used for the FDOPA data.
Clinical and demographic data of PPMI dataset. Parkinson’s Progression Markers Initiative (PPMI) baseline data. Results are presented as mean (SD) or median (IQR). p-values indicate comparison of PPMI-PD and PPMI-iRBD groups. PPMI-HC, PPMI healthy control subjects; PPMI-PD, PPMI de novo Parkinson’s disease patients; PPMI-iRBD, PPMI isolated REM sleep behavior disorder patients with pathological DaT-SPECT; PPMI-iRBD conv., PPMI-iRBD patients who progressed to PD or DLB during participation; MDS-UPDRS, Movement Disorder Society-Unified Parkinson’s Disease Rating Scale; DaT SPECT, dopamine transporter SPECT scan; SBR, specific binding ratio; AI, asymmetry index
Statistical analyses
Clinical and demographic data were analyzed using chi-square, Mann-Whitney, one-way ANOVA, and Kruskal-Wallis tests as appropriate. Statistical analyses were performed using Graphpad PRISM 6. Normality of data was assessed with Shapiro-Wilk tests and Q-Q plots. Demographic data are presented as mean (SD) or median (IQR). Group comparisons of imaging data were performed using Mann-Whitney tests including correction for multiple comparisons. PPMI data groups had highly unequal sample sizes and were compared with Mann-Whitney tests.
RESULTS
FDOPA dataset
A significant difference was seen in age (iRBD vs. PD-RBDp = 0.020, PD+RBD vs. PD-RBDp = 0.003), UPDRS score (iRBD vs. PD-RBDp < 0.0001, iRBD vs. PD+RBDp < 0.0001), number of radio opaque markers (PD-RBD vs. PD+RBDp = 0.0064), and total RBDSQ score (iRBD vs. PD-RBDp < 0.0001, PD-RBD vs. PD+RBDp = 0.0009) between the three patient groups (iRBD, PD-RBD, and PD+RBD). No difference was seen in other demographic domains (Table 1).
The lowest putamen SBR was significantly different between+RBD and –RBD groups (p < 0.0001, median 1.158 vs. 0.708, 95%CI –0.504 to –0.196, Fig. 3A). A significant difference was seen in putaminal AI between the +RBD and -RBD patients, with the +RBD group displaying a more symmetric putaminal involvement compared to –RBD subjects (p = 0.001, median 0.041 vs. 0.120, 95%CI 0.023 to 0.108, Fig. 3B). When analyzed individually, the iRBD-pat and PD+RBD groups both showed significantly more symmetric putaminal loss when compared to the PD-RBD group (iRBD-pat vs. PD-RBDp = 0.001, median 0.039 vs. 0.120, 95%CI 0.034 to 0.131; PD+RBD vs. PD-RBDp = 0.049, median 0.056 vs. 0.120, 95%CI 0.000 to 0.110). The iRBD-pat group had significantly less pathological putamen SBRs compared to the PD-RBD (p < 0.0001, median 1.285 vs. 0.708, 95%CI –0.625 to –0.409), whereas no significant difference in SBRs was seen between PD+RBD and PD-RBD. These data are shown in Supplementary Figure 1.
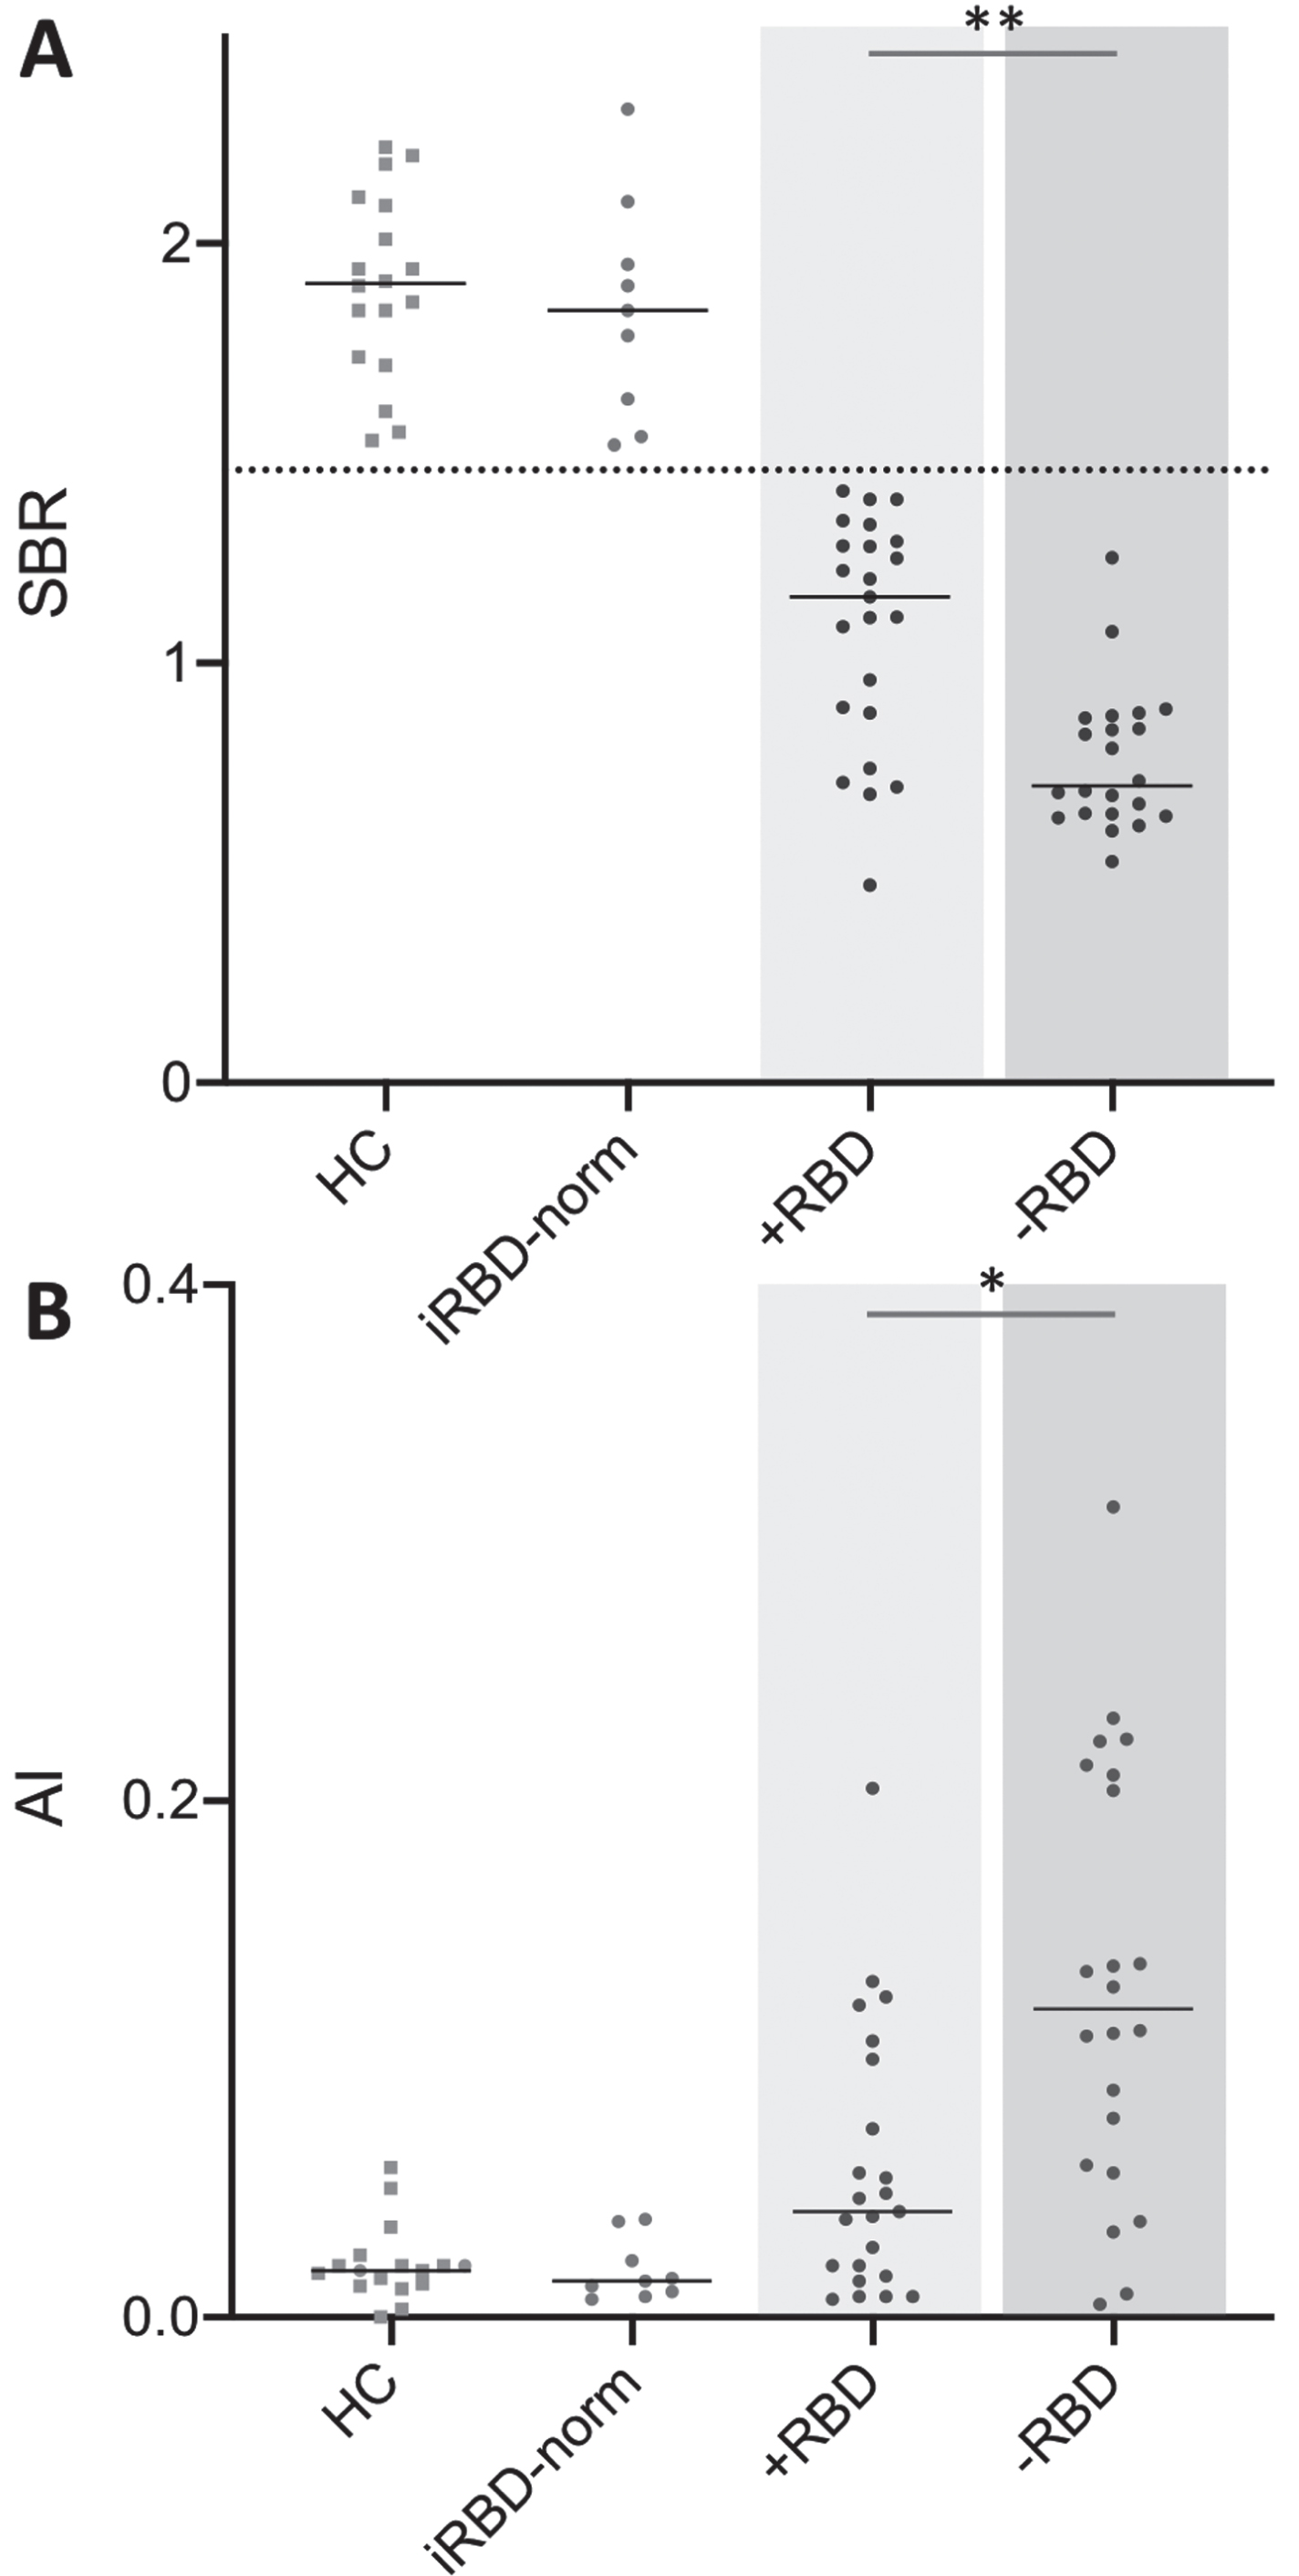
*p < 0.05; **p < 0.0001. A) Lowest putamen Specific Binding Ratio (SBR) in healthy control subjects (HC), iRBD patients with normal FDOPA scans (iRBD-norm), de novo PD patients with RBD plus iRBD patients with pathological [18F]FDOPA scans (+RBD), and de novo PD patients without RBD (-RBD). B) Putaminal asymmetry index (AI) in HC, iRBD-norm, +RBD, and –RBD subjects.
Figure 4 illustrates striatal [18F]FDOPA uptake in a control subject and representative cases from the –RBD and+RBD groups showing symmetric and asymmetric decrease in nigrostriatal integrity, respectively.
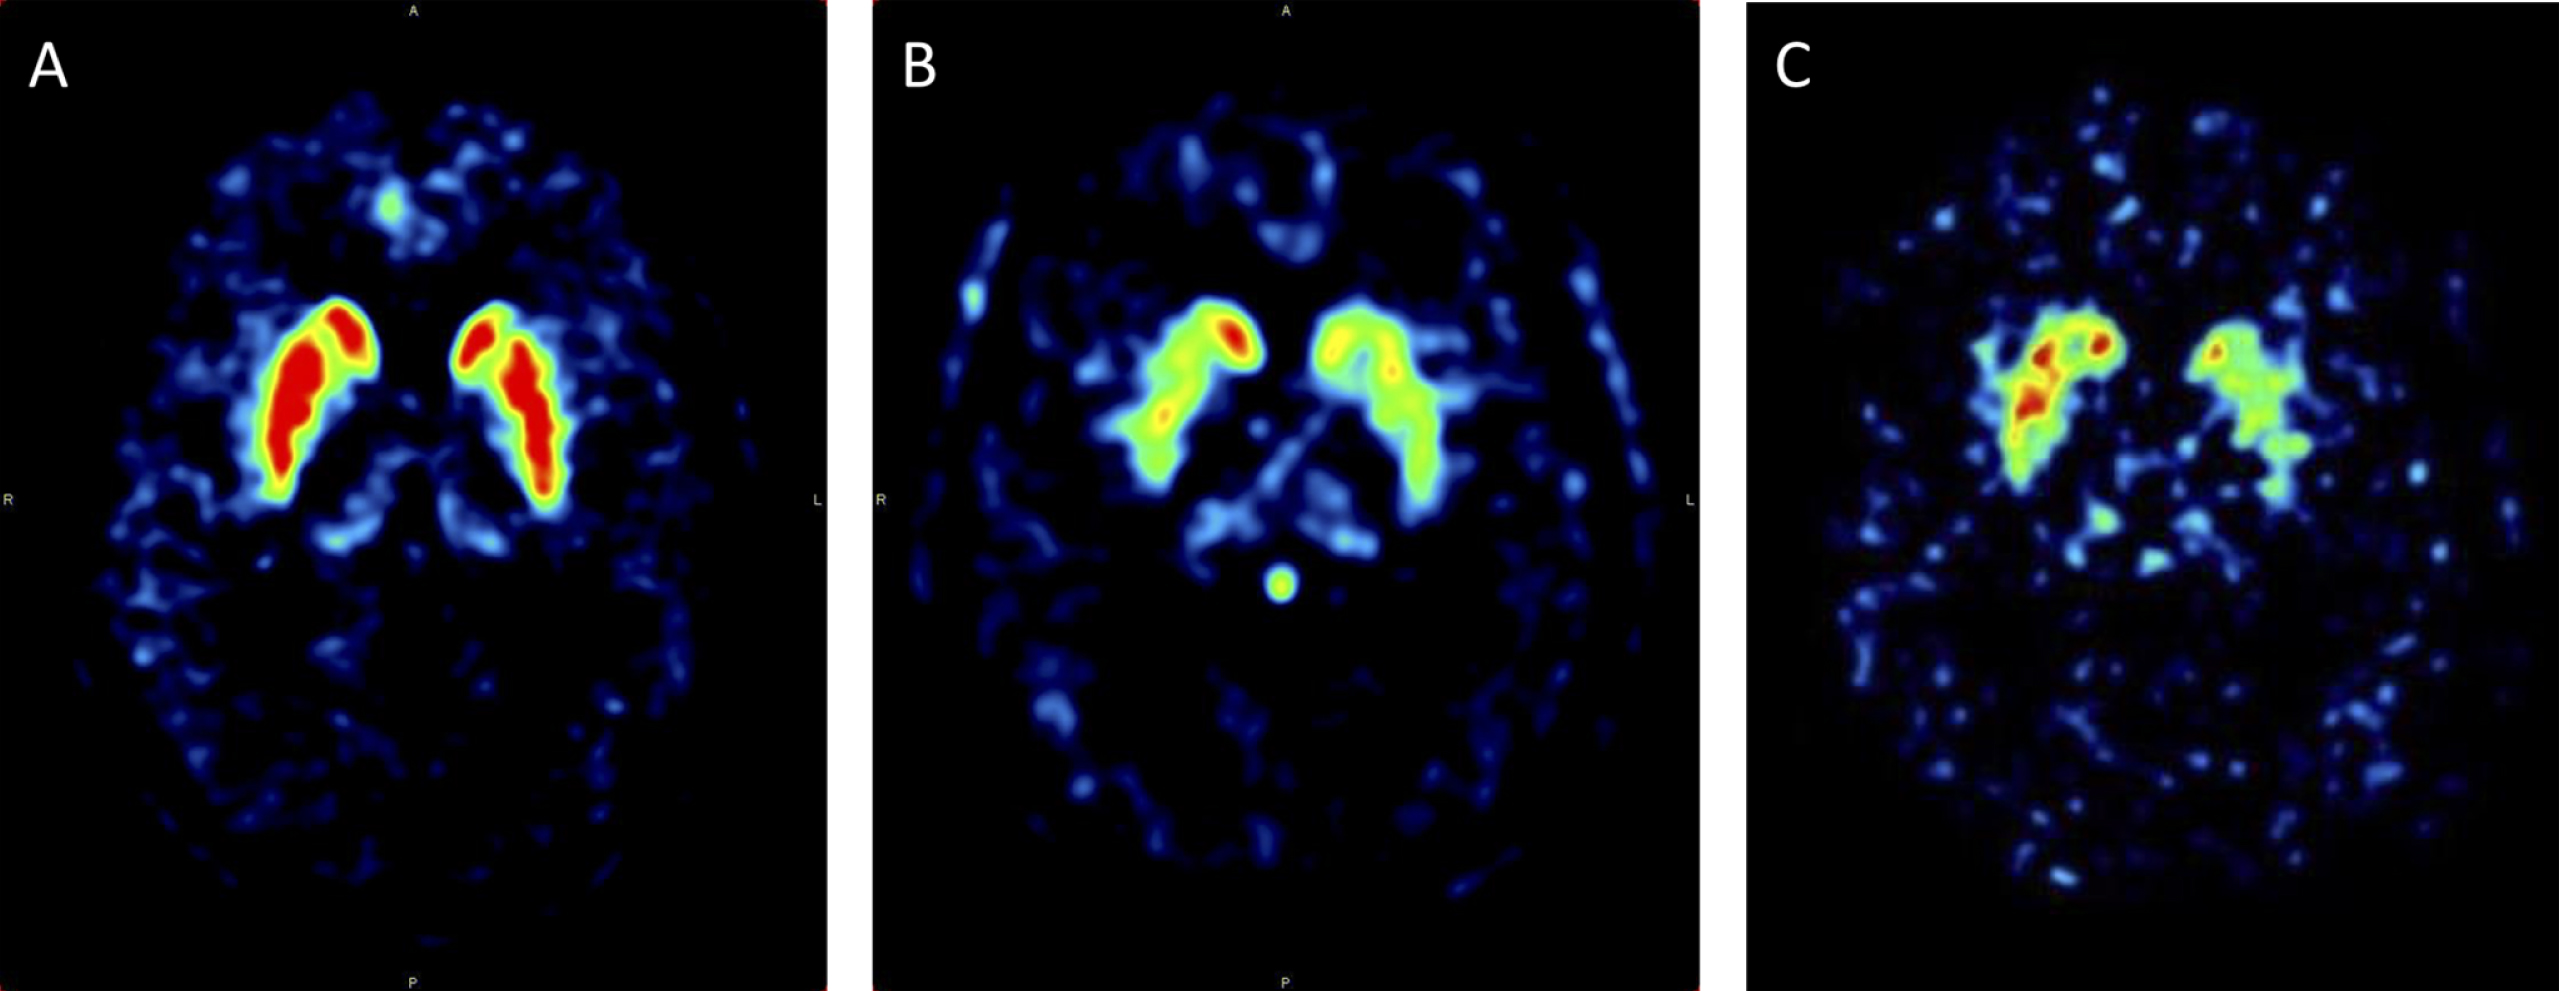
Normal striatal [18F]FDOPA uptake in a HC subject (A), symmetrically decreased uptake in a + RBD patient (B), and asymmetrically decreased uptake in a -RBD patient (C).
In the FDOPA dataset, only the PD+RBD and PD-RBD groups were used for assessing motor asymmetry, since the iRBD patients had very low UPDRS-III scores (median of 1) precluding a meaningful calculation of motor asymmetry. The total UPDRS-III scores were similar in the PD+RBD and PD-RBD groups (Table 1, p = 0.71, median 19 vs. 21, 95%CI –5.00 to 6.00). The median UPDRS-III difference score was slightly lower in the PD+RBD group compared to the PD-RBD group, but the finding was not significant (median (IQR) 5 (4–8) vs. 6 (3–9), p = 0.74) (Supplementary Figure 2).
PPMI dataset
Figure 5 shows longitudinal data of the lowest putaminal [123I]FP-CIT SBR from PPMI-iRBD subjects compared to baseline de novo PPMI-PD subjects with unknown RBD status. Only PPMI-iRBD subjects with a pathological baseline DaT SPECT and longitudinal imaging data were included in this figure. Figure 5A illustrates that at baseline and at the 1-year follow-up, the median SBR in the PPMI-iRBD group was slightly less pathological than that of the de novo PPMI-PD patients. However, at the 2-to-5 years follow-up time points, the median SBR in the PPMI-iRBD group was equivalent to that of the PPMI-PD patients. In contrast, the median putaminal AI in the PPMI-iRBD group was consistently lower than that of the PPMI-PD baseline data at all time points (Fig. 5B).
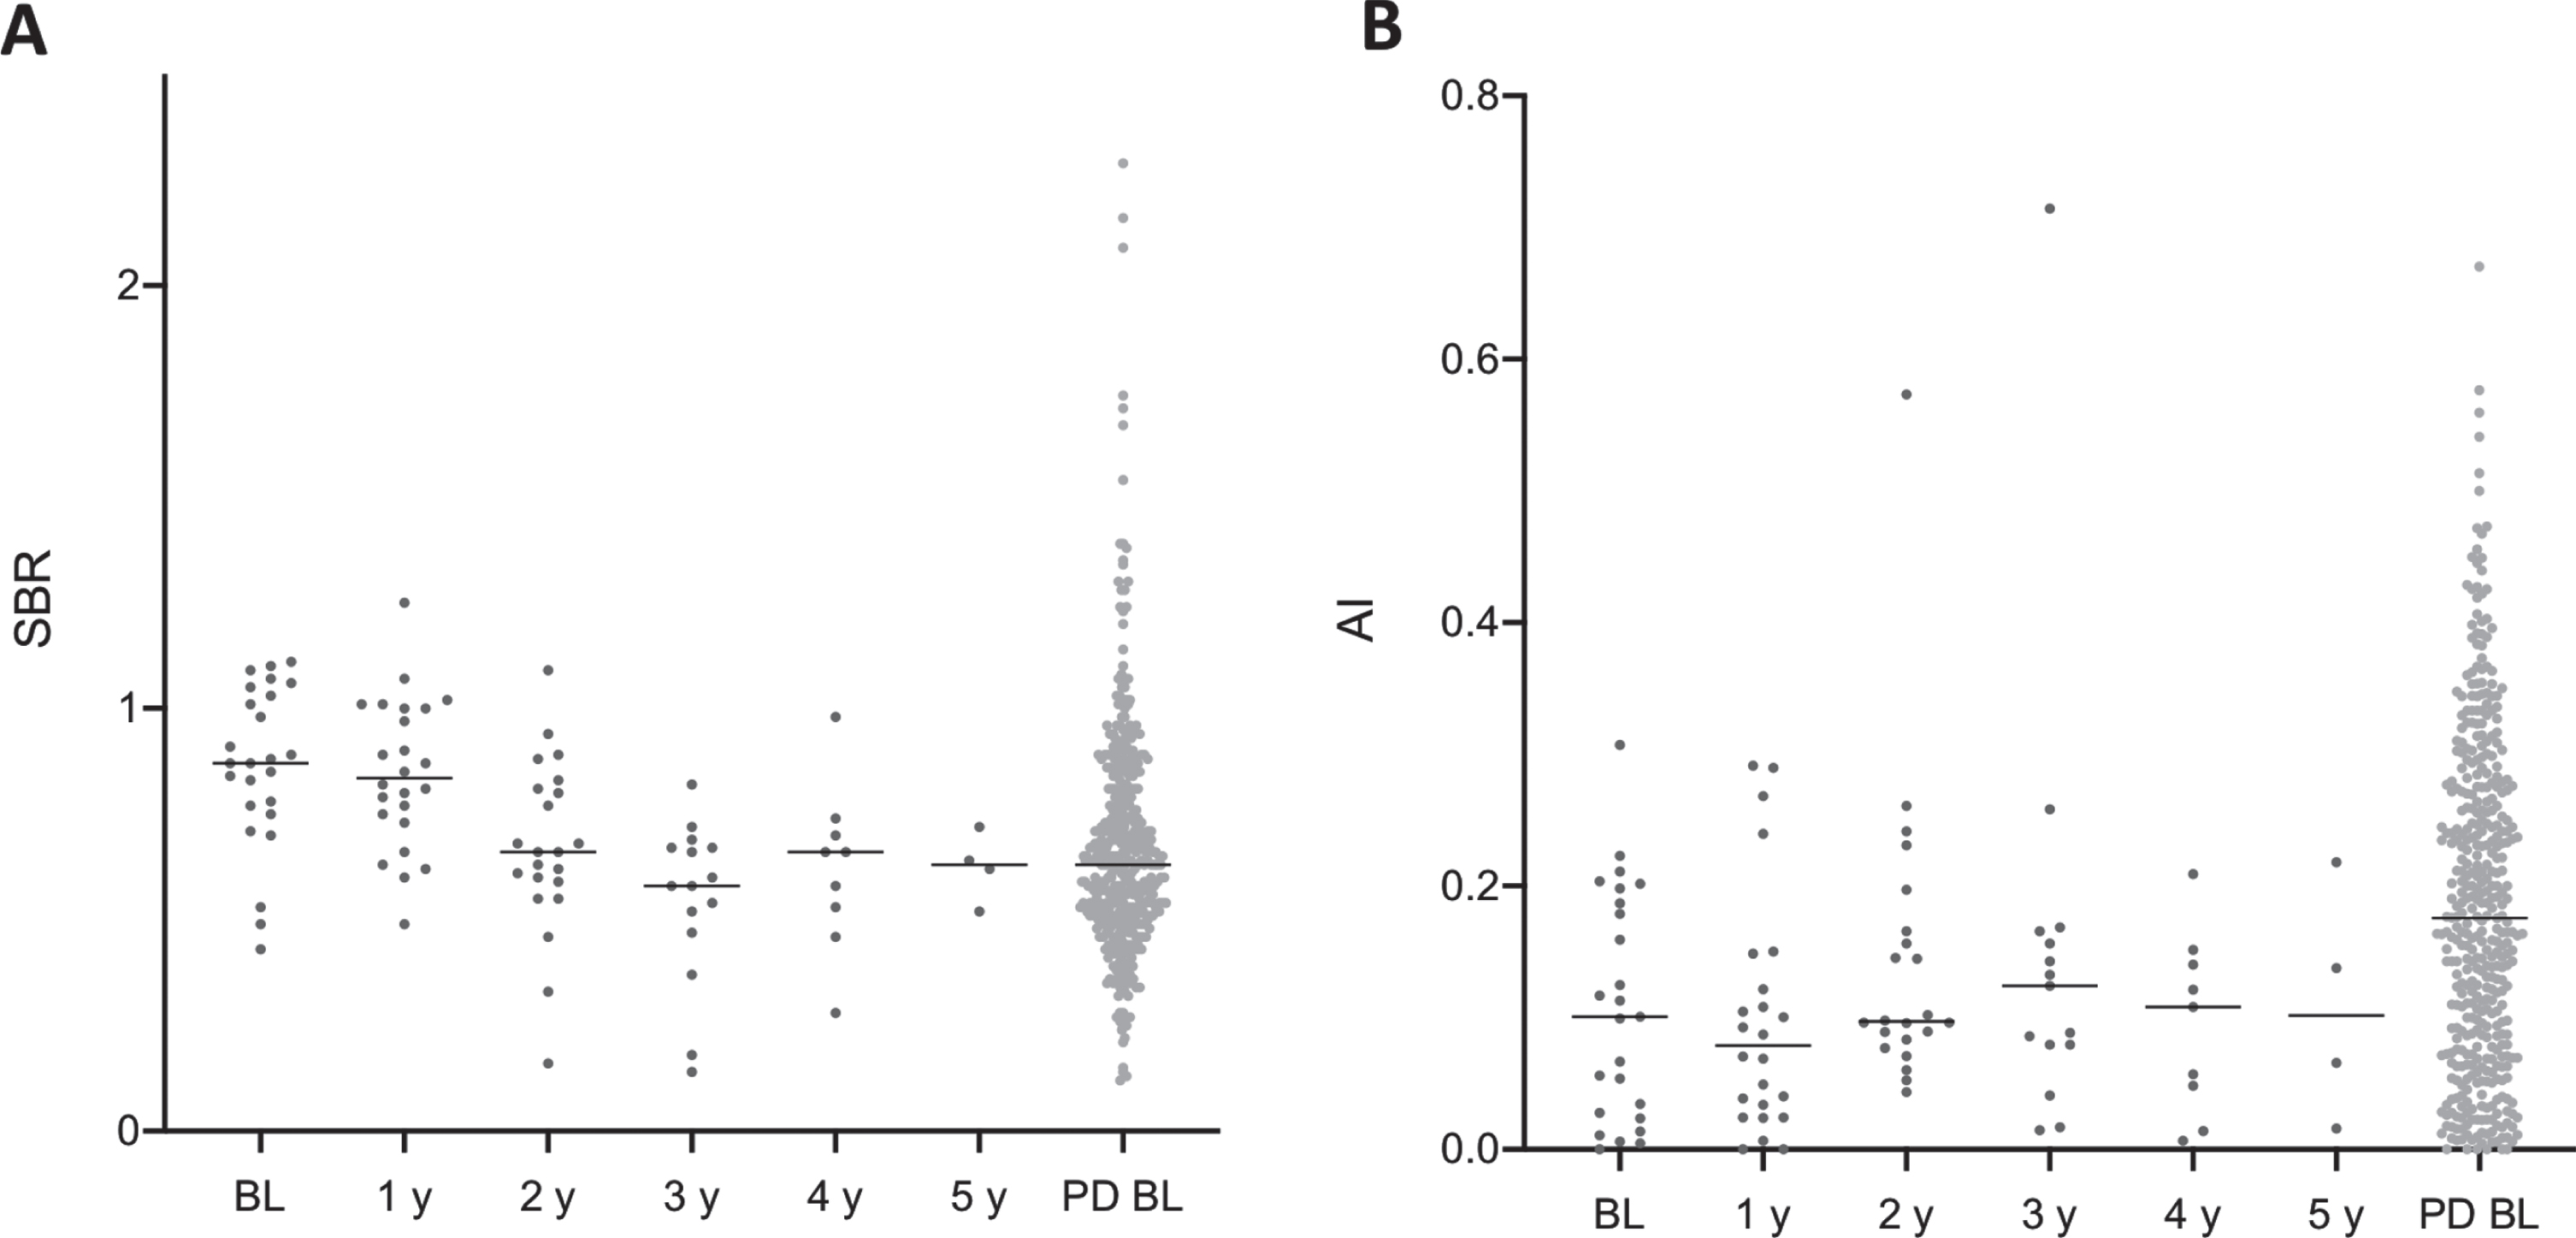
PPMI data. A) Longitudinal lowest putamen SBR in iRBD subjects with pathological DaT SPECT and baseline SBR in de novo PD patients (rightmost group). B) Putaminal AI in iRBD subjects (longitudinal) and de novo PD patients (baseline).
Figure 6 depicts the lowest putamen SBR and putamen AI data from the PPMI-iRBD subjects’ most recent pathological DaT SPECT with comparison to PPMI-PD baseline values. At the time of this most recent DaT SPECT, 12 of the 25 PPMI-iRBD patients (48%) had progressed clinically to either PD or DLB. No difference was seen in SBR between the two groups (p = 0.314, median 0.660 vs. 0.6630, 95%CI -0.130 to 0.040), indicating that the level of nigrostriatal degeneration in the PPMI-iRBD group was equivalent to that of the newly diagnosed PPMI-PD patients (Fig. 6A). However, putaminal uptake was again significantly more symmetric in the PPMI-iRBD group compared to PPMI-PD subjects (p = 0.003, median 0.108 vs. 0.176, 95%CI 0.020 to 0.112, Fig. 6B).
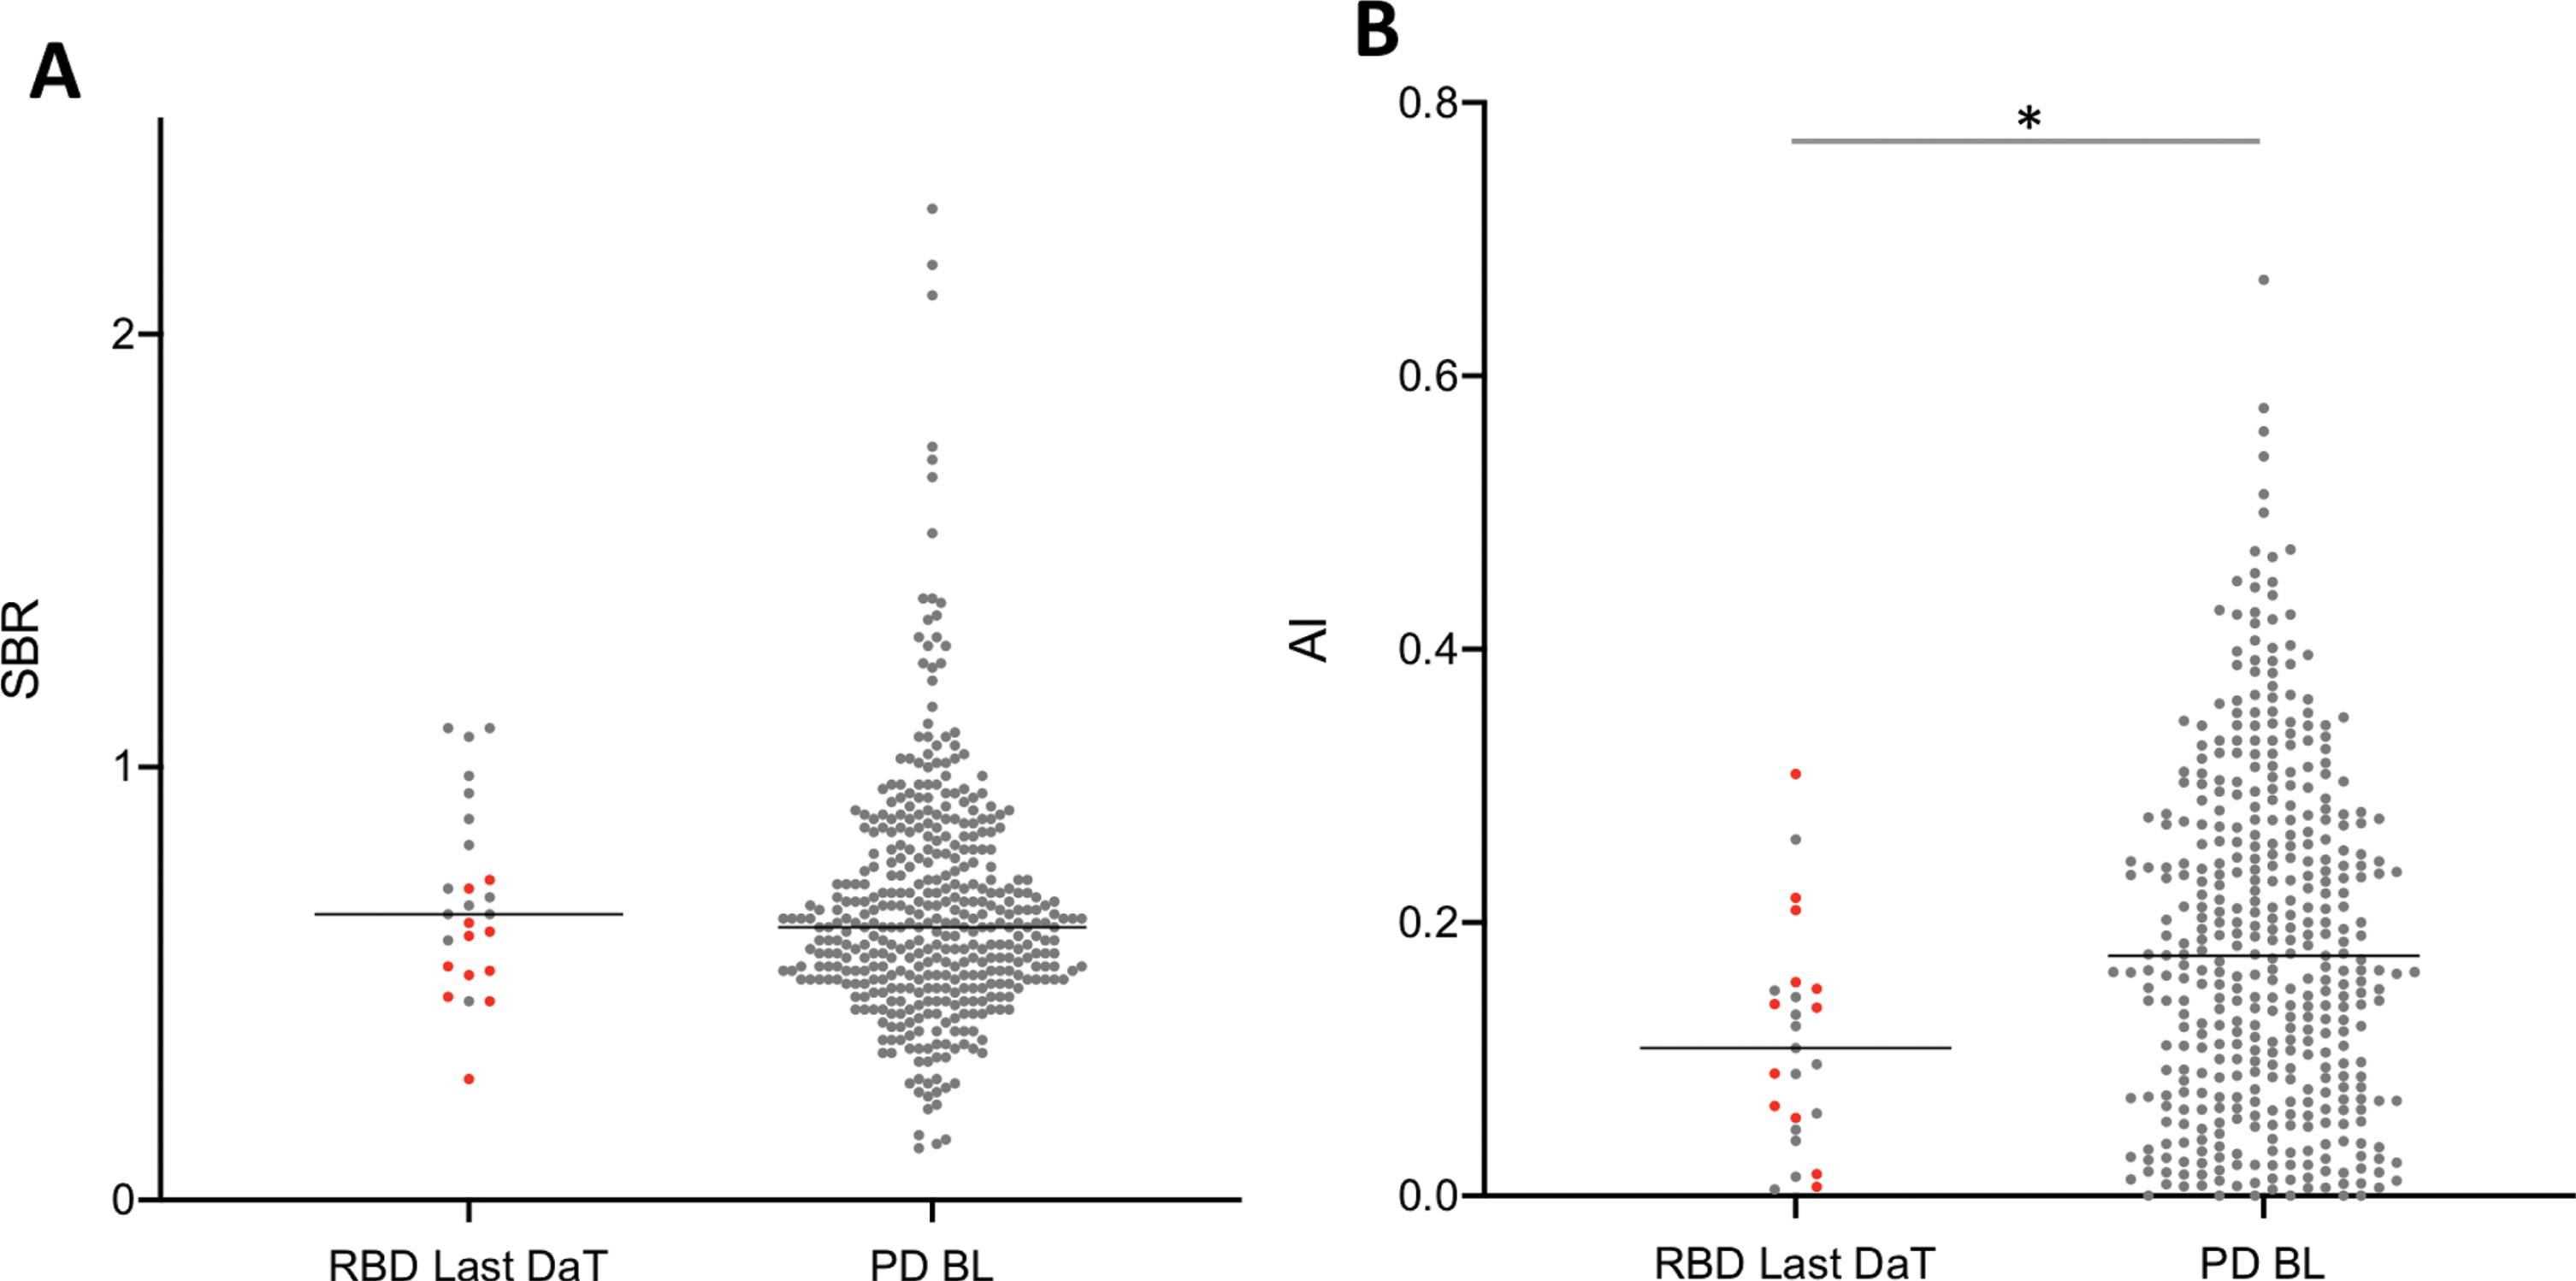
PPMI data. *p < 0.05. A) The lowest putamen SBR in the most recent pathological DaT SPECT in iRBD subjects and baseline SBR in de novo PD patients. B) Putaminal AI of the most recent pathological DaT SPECT in iRBD subjects and baseline AI of de novo PD patients. Red dots designate the iRBD subjects who had clinically progressed to PD or DLB at the most recent DaT SPECT.
In the PPMI dataset, only the 12 iRBD cases who had converted to PD or DLB were used for assessing motor asymmetry. The non-converters had no or limited parkinsonian symptoms and very low UPDRS-III scores preventing a valid calculation of a UPDRS-III difference score. Compared to the total PD group, the 12 iRBD converters had slightly lower total UPDRS-III scores (median (IQR) 16.5 (8.3–21.8) vs. 20 (14–26), p = 0.049). However, the difference scores revealed markedly more symmetric parkinsonian symptoms in the iRBD-converters than in the total PD group (median (IQR) 3 (2–3.8) vs. 7 (5–10), p < 0.0001) (Supplementary Figure 3).
DISCUSSION
Using validated in vivo imaging markers of nigrostriatal dysfunction, this study found that iRBD and de novo PD patients with premotor RBD present with more symmetric striatal degeneration compared to de novo PD patients without RBD. This observation was further confirmed by the PPMI data, in which iRBD patients showed more symmetric striatal degeneration compared to a mixed group of PD patients with and without RBD. The study showed concurrent results in two different datasets, one obtained by a multi-center consortium, in which we did not take part. We consider it a strength of a scientific study that concurrent findings are obtained in two different datasets. Our de novo PD patients were recruited after their first visit to a movement disorder specialist. Thirty percent were in Hoehn & Yahr stage I and 61%in Hoehn & Yahr stage II (Table 1). A similar Hoehn & Yahr stage distribution is seen in the PPMI dataset with 43%Hoehn & Yahr stage I and 56%Hoehn & Yahr stage II patients, underscoring that the two datasets are comparable [19].
The current study supports the predictions of the SOC model, i.e., that body-first Lewy body disease leads to more symmetric intra-cerebral pathology and hence more symmetric damage to the nigrostriatal dopamine system in comparison to the more unilateral distribution of Lewy pathology in early brain-first Lewy body disease (Fig. 1). These results are also in agreement with clinical studies, which have reported that motor asymmetry is more strongly associated with RBD-negative PD patients than with RBD-positive patients [20, 21].
In our FDOPA dataset, both the iRBD-pat and the PD+RBD groups showed significantly more symmetric putaminal loss in comparison to the PD-RBD group, despite the small sample size in each group. Thus, we chose to combine the iRBD-pat and de novo PD+RBD into one group. We argue that this was a valid approach due to theoretical considerations about the kinetics of nigrostriatal dopaminergic degeneration (Fig. 7). In short, the progressive striatal degeneration is believed to follow an exponential decline [22]. If dopaminergic nerve terminals start degenerating in one striatum before the other, the exponentially declining curves will be parallel shifted along the time axis. Thus, the AI will initially increase and reach a peak value followed by subsequent declining AI values. Our iRBD-pat cases all had clearly pathological putamen SBR values, defined as > 2 SD below the control mean (Supplementary Figure 1). Thus, the degeneration in the most affected putamen was quite marked, suggesting that the AI value in these subjects had already reached the peak - meaning that when these patients are followed longitudinally, the AI will become increasingly smaller. If this assumption is correct, it is valid to pool the iRBD-pat and de novo PD+RBD into one group, because the true difference between the RBD-positive and -negative patients would, if anything, be underestimated. In other words, we predict that our iRBD-pat patients will, once they progress to either PD or DLB, show lower AI values than in the current data, translating into an even greater difference when compared to the de novo PD-RBD data.
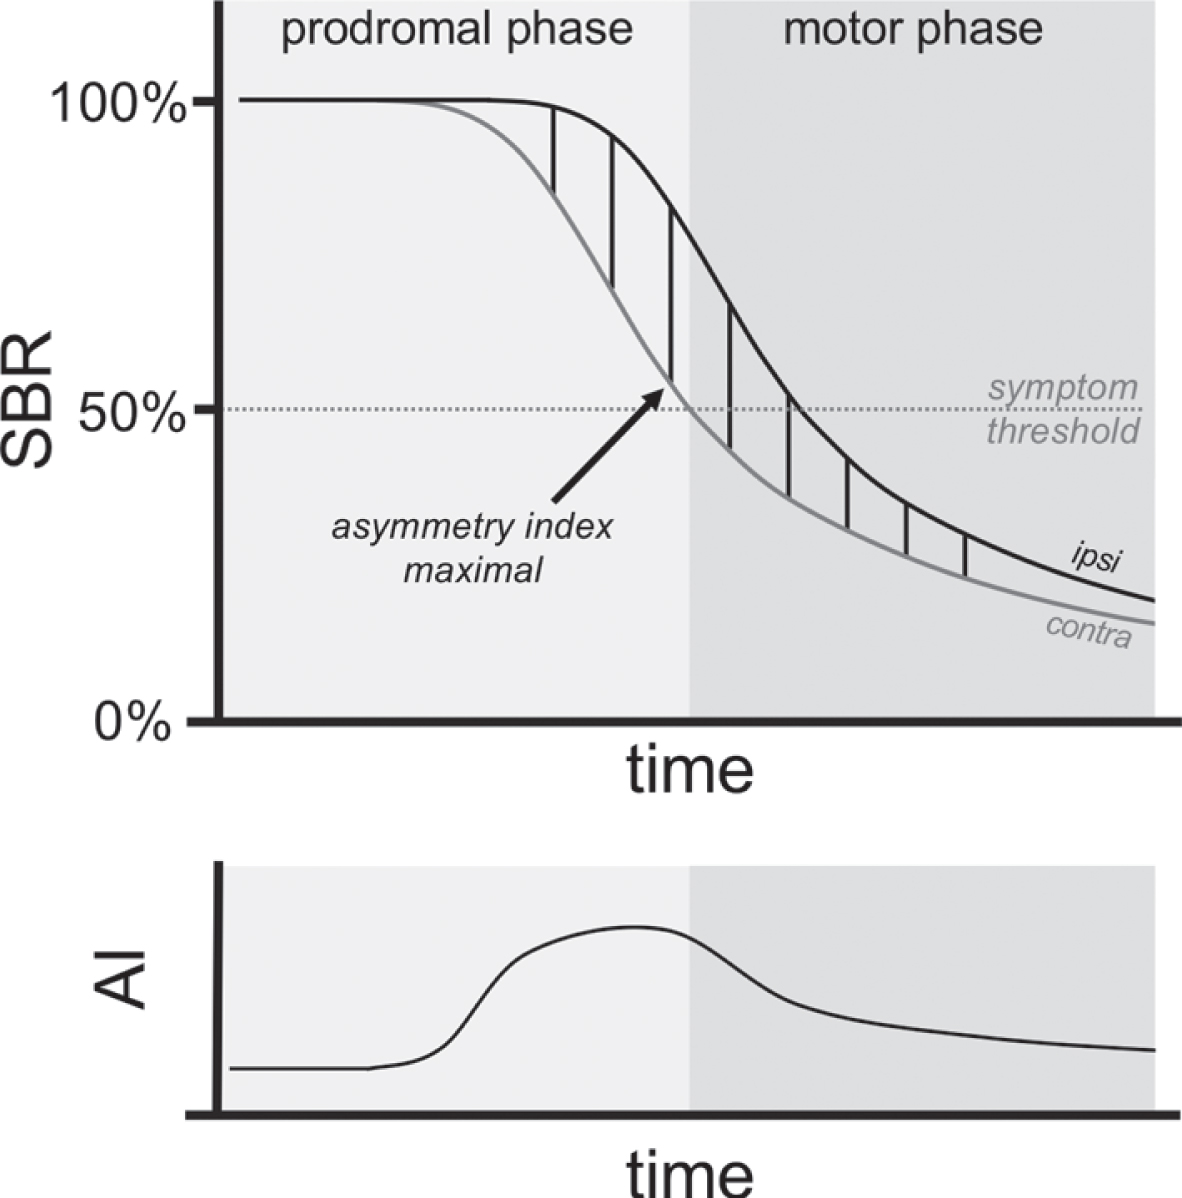
Schematic illustration of progressive dopaminergic degeneration in the striatum contralateral (contra) and ipsilateral (ipsi) to the most affected body side. Parkinsonism emerges when approximately 50%of striatal terminals are lost and the progressive striatal degeneration is believed to follow an exponential decline [22]. Therefore, a time delay in the onset of neurodegeneration between one and the other striatum will lead to the asymmetry index following an “inverted U shape” (bottom), climbing to a maximum and followed by subsequent declining asymmetry index. For several reasons discussed in the main text, we argue that this peak value is located during the prodromal phase.
These considerations are for the moment speculative but highly plausible. More importantly, they are strongly supported by our observations in the PPMI dataset. Here, we found that PPMI-iRBD patients had slightly more normal putamen SBR values at baseline and the 1-year time point, but at the 2-to-5 year time points their median SBR was equivalent to that of the PPMI-PD group (Fig. 5A). However, the PPMI-iRBD group had a consistently lower median AI at all time points (Fig. 5B). Thus, the PPMI-iRBD data support that in iRBD patients with clearly abnormal DaT-SPECT imaging, the AI has already passed the peak value illustrated in Fig. 7. In support, a previous PPMI study which analyzed only PD data, showed that the putamen AI of the PD patients is highest at baseline and becomes progressively smaller at 1, 2, and 4-year follow-up time points [23]. This observation underscores that the AI peak difference illustrated in Fig. 7 must be located prior to the baseline time point, i.e., during the prodromal phase.
When we compared the most recent DaT SPECT scan in the PPMI-iRBD group to the PPMI-PD group, the median AI was significantly lower in the PPMI-iRBD group than that of the PD group (Fig. 6). Of note, nearly half of the iRBD patients had progressed to PD or DLB at this time point, further adding to the validity of the finding in the PPMI data. Finally, the PPMI-PD group included both RBD-positive and RBD-negative cases. Thus, the detected AI group difference was likely underestimated, and would have been even greater had we been able to compare the PPMI-iRBD data to a clean group of PSG-verified RBD-negative PPMI-PD patients.
In the PPMI study, only the iRBD patients had gold standard video-PSG to diagnose RBD. In the PPMI-PD patients, the RBDSQ questionnaire was administered. However, several studies have shown that the performance of the RBDSQ is invalid as a screening tool for determining the presence of RBD in early stage PD where dream enactment behaviors are frequently mild [24–26]. A recent video-PSG study compared de novo and advanced stage PD patients and demonstrated that 47.4%of patients with no history of dream enactment exhibited clear motor behavior during REM sleep on video-PSG [27]. In other words, approximately half of these RBD-positive patients were false-negative based on the RBDSQ. For these reasons, we did not stratify the PPMI-PD patients according to their RBDSQ, but selected to compare the PPMI-iRBD subjects to the total PPMI-PD group.
Previous studies have reported that motor asymmetry is more strongly associated with RBD-negative PD patients than with RBD-positive patients [20, 21]. This was also the case in both our datasets, although the group-difference was only significant in the PPMI dataset. It is well known that motor symptoms do not show one-to-one correlation with nigrostriatal loss evidenced by dopamine imaging. Many previous studies have reported correlation between putamen SBR and UPDRS-III scores but also a considerable degree of inter-subject variance [28, 29]. This indicates that the burden of parkinsonism only correlates with decreased nigrostriatal denervation to a moderate degree.
The study has some limitations. First, the sample sizes in the FDOPA data and the PPMI-iRBD group were modest, but still sufficient to demonstrate significant differences in putamen AI between purported body-first and brain-first subjects. Second, our two groups of iRBD patients could include MSA patients, but a recent multi-center study reported that only 4.5%of iRBD converted to MSA [30]. Thus, we do not believe that the inadvertent inclusion of MSA cases would significantly alter the results of our present analyses. Third, although the included iRBD-pat group all had pathological FDOPA scans, the reduction in SBR was smaller in comparison to the PD-RBD patients. These data may therefore not have been directly comparable, but we have argued above that pooling the iRBD-pat and PD+RBD patients was a valid approach. Nevertheless, it would have been optimal to compare sufficiently large groups of de novo PD patients with and without RBD. Fourth, the PPMI-PD group did not have video-PSG, so we were forced to compare the PPMI-iRBD patients to the total PPMI-PD group comprised of both RBD-negative and positive cases. However, we argue that this limitation would, if anything, have led to an underestimation of the true AI difference between RBD-positive and -negative patients. Fifth, a significant difference was seen in age-distribution among the FDOPA groups with the iRBD and de novo PD+RBD being older than the de novo PD-RBD groups. However, it has never been demonstrated that nigrostriatal asymmetry decreases with increasing age. Indeed, if anything, nigrostriatal asymmetry would probably tend to increase with age due to the cumulative effect of structural damage to the basal ganglia (minor strokes and dilated perivascular spaces). Thus, the difference in age distribution probably did not affect the validity of our findings and may even have biased the study towards the null. In addition, we did not correct our imaging data for the handedness of study subjects. It has been suggested that handedness may be associated with the side of clinical symptom onset [31]. This would mean that an equal level of nigrostriatal degeneration in both hemispheres would nevertheless translate into more parkinsonian symptoms on one side of the body than the other. However, to our knowledge there is no evidence to suggest that nigrostriatal dopaminergic degeneration as measured by PET shows a relationship to handedness.
Finally, with regard to comparing motor symptom asymmetry we had to exclude iRBD patients in both datasets, which considerably reduced the sample sizes and statistical power. Nevertheless, our findings of less motor asymmetry in RBD-positive patients were in accordance with previous studies [20, 21], although only statistically significant in one of our two comparisons.
In conclusion, we have shown that iRBD subjects and de novo PD+RBD patients present with significantly more symmetric nigrostriatal dopaminergic degeneration compared to de novo PD-RBD patients. These results support the predictions of the SOC model, i.e., that body-first Lewy body disease is characterized by a more symmetric distribution and propagation of pathogenic α-syn compared to brain-first disease. If the SOC model is correct, it not only poses an explanation for the hitherto unexplained motor asymmetry in PD, but it also supports that prion-like spreading of pathogenic α-syn is a main driver in PD pathogenesis. Such support is important to reinforce the validity of targeting prion-like propagation mechanisms as a neuroprotective treatment strategy. Further research is needed to replicate the present results, preferably in longitudinal imaging data of larger study cohorts.