
Abstract
Background:
Rapid-eye-movement sleep behavior disorder (RBD) is a major risk factor for Parkinson’s disease and dementia with Lewy bodies. More than a third of RBD patients have mild cognitive impairment (MCI), but their specific structural brain alterations remain poorly understood.
Objective:
This study aimed to investigate the local deformation and volume of gray and white matter tissue underlying MCI in RBD.
Methods:
Fifty-two idiopathic RBD patients, including 17 with MCI (33%), underwent polysomnography, neuropsychological, neurological, and magnetic resonance imaging assessments. MCI diagnosis was based on a subjective complaint, cognitive impairment on the neuropsychological battery, and preserved daily functioning. Forty-one controls were also included. Deformation-based morphometry (DBM), voxel-based morphometry (VBM), and regional volume analyses of the corpus callosum and cholinergic basal forebrain were performed. Multiple regression models were also computed using anatomical, cognitive (composite z scores), and motor parameters.
Results:
Globally, patients with MCI displayed a widespread pattern of local deformation and volume atrophy in the cortical (bilateral insula, cingulate cortex, precuneus, frontal, temporal and occipital regions, right angular gyrus, and mid-posterior segment of the corpus callosum) and subcortical (brainstem, corona radiata, basal ganglia, thalamus, amygdala, and right hippocampus) regions compared to patients without MCI (DBM) or controls (DBM and VBM). Moreover, brain deformation (DBM) in patients were associated with lower performance in attention and executive functions, visuospatial abilities, and higher motor symptoms severity.
Conclusion:
The present study identified novel brain structural alterations in RBD patients with MCI which correlated with poorer cognitive performance. These results are consistent with those reported in patients with synucleinopathies-related cognitive impairment.
Keywords
INTRODUCTION
Rapid-eye-movement sleep behavior disorder (RBD) is an important risk factor for developing Parkinson’s disease (PD) or dementia with Lewy bodies (DLB) [1, 2]. Mild cognitive impairment (MCI) affects more than a third of RBD patients and represents in this population an additional risk factor for developing DLB or PD with cognitive impairment [1, 3–5]. It is therefore essential to better characterize the neuroanatomical bases underlying cognitive impairment in RBD in order to be able to identify and predict the trajectories of patients at risk of neurodegeneration.
In 2018, one magnetic resonance imaging (MRI) study conducted by our group has reported neuroanatomical changes occurring in RBD patients with MCI. Using vertex-based cortical thickness and subcortical shape analyses, thinning in the frontal, cingulate, temporal, and occipital cortices, and surface contraction in the putamen, pallidum, and thalamus were found in patients with MCI [6]. Anatomical changes were also associated with poorer cognitive performance [6]. For MRI-derived measures of atrophy to eventually qualify as a potential biomarker of cognitive impairment in RBD, a thorough assessment of atrophy is needed. Although the previously used techniques revealed tissue changes in specific structural metrics (i.e., cortical thickness and subcortical shape) and tissue classes (i.e., cortical mantle and subcortical structures), a lack of knowledge remains regarding the comprehensive assessment of the whole-brain volume tissue changes occurring as part of the cognitive-dominant phenotype of RBD.
Several techniques have been used to map the local gray and white matter tissue volume changes associated with cognitive decline in DLB or PD [7–13], but to date, none has yet been applied to RBD patients with and without MCI. The use of deformation-based morphometry (DBM), a technique that assesses gray and white matter tissue changes based on the shift needed to locally deform a brain to a standard template [14, 15], was recently shown to reveal structural changes that are complementary to what is reported using the more traditional voxel-based morphometry (VBM), generally limited to gray matter investigation [16]. Moreover, tissue changes occurring in the cholinergic basal forebrain and the corpus callosum (CC) have been linked to cognitive decline in PD [17, 18] or DLB [19, 20].
In this study, we performed a comprehensive assessment of the whole-brain changes occurring in terms of volume in RBD patients with MCI compared to patients without MCI and healthy controls. We used both DBM and VBM to thoroughly characterize the pattern of changes occurring in association with cognitive impairment and next investigated the structural integrity of the brainstem, the cholinergic basal forebrain nuclei, and the CC to explore their potential implication in the cognitive abnormalities found in RBD patients. We also investigated the association between measures of atrophy and the presence of cognitive and motor changes in these patients. We hypothesized that RBD patients with MCI would display a more pronounced pattern of brain atrophy as compared to patients without MCI and controls. We also predicted that volumetric changes would be related to cognitive performance in RBD.
MATERIALS AND METHODS
Participants
Since July 2008, 59 individuals with polysomnography (PSG)-confirmed idiopathic RBD have been recruited at the Center for Advanced Sleep Medicine at the Centre Intégré Universitaire de Santé et de Services Sociaux du Nord-de-l’Île-de-Montréal –Hôpital du Sacré-Coeur de Montréal (CIUSS-NÎM –HSCM) for brain MRI studies [6, 21]. Exclusion criteria for this study were: 1) diagnosis of parkinsonism, PD, or dementia according to published criteria [22, 23], and 2) a history of stroke, head trauma, EEG abnormalities suggesting epilepsy, chronic obstructive pulmonary disease, claustrophobia, encephalitis, or any other neurologic disorder. A group of 41 controls without MCI or RBD has been recruited from the general population through newspaper advertisements or by word of mouth. The same exclusion criteria were applied for controls. All participants underwent one night of PSG recording in the sleep laboratory (except for 11 controls), neurological examination, neuropsychological assessment, and 3-tesla MRI scanning. Study protocols were approved by the university hospital ethic committees (CIUSSS-NÎM –HSCM and CIUSSS du Centre-Sud-de-l’Île-de-Montréal –Comité d’éthique de la recherche vieillissement-neuroimagerie, Montreal, Canada) and participants provided written informed consent to participate.
PSG and neurological examination
PSG measurements included left and right electrooculograms, submental electromyography and EEG activity during sleep, which was recorded by two standard electrode derivations (C3-A2 and O2-A1). Oral and nasal airflow, thoracic and abdominal wall movements, and pulse oximetry were monitored to document respiratory events. Sleep stages were then scored according to standard criteria [24, 25]. REM sleep stage and chin EMG (tonic and phasic) activity during REM sleep were identified and quantified as described previously [24]. Participants also underwent an extensive neurological examination performed by a movement disorders specialist (R.B.P.), which included administration of the motor examination subscale of the Unified Parkinson’s Disease Rating Scale (UPDRS-III) to assess the severity of motor symptoms [26].
Neuropsychological assessment
Three cognitive domains were assessed: 1) attention and executive functions; 2) learning and memory; and 3) visuospatial abilities. Attention and executive functions were assessed with the Digit Span subtest (Wechsler Adult Intelligence Scale-III); Trail Making Test, Part B (time); Stroop Color Word Test III-I contrast score (time and error); verbal semantic fluency; and verbal phonemic fluency. Episodic verbal learning and memory were assessed using the Rey Auditory Verbal Learning Test (sum of trials 1–5, list B, immediate and delayed recalls, and recognition). Visuospatial abilities were assessed using the Rey-Osterrieth Complex Figure (copy), Bells test (omissions), and Block Design subtest (Wechsler Adult Intelligence Scale-III). MCI was diagnosed according to the following criteria: 1) evidence of subjective cognitive complaints observed during semi-structured interview by the patient, spouse or informant, or highlighted by the Cognitive Failures Questionnaire [27]; 2) evidence of objective cognitive impairment, which was defined as a performance below -1.5 standard deviations on at least two tasks within a single cognitive domain or more; 3) preservation of daily functioning; 4) absence of dementia; and 5) cognitive impairment not solely explained by medication or other medical conditions [4, 5]. The list of cognitive tests, normative data and criteria used to diagnose MCI have been published previously [4–6].
Magnetic resonance imaging (MRI) acquisition
All participants were scanned at the Unité de Neuroimagerie Fonctionnelle –Institut universitaire de gériatrie de Montréal (Canada). The acquisitions were performed on a 3T MRI scanner MAGNETOM Trio Tim system equipped with a 12-channel head matrix coil (Siemens, Erlangen, Germany). High-resolution, T1-weighted, 3D anatomical whole-brain images were acquired using a magnetization-prepared rapid acquisition with gradient-echo (MPRAGE) sequence with the following parameters: TR = 2.3 s, TE = 2.91 ms, flip angle = 9°, matrix = 256×240 mm, 160 slices and in-plane resolution = 1×1 mm2.
Morphometric analyses
VBM and DBM
Anatomical images were processed using Computational Anatomy Toolbox (CAT12, Jena University Hospital, Germany; release 1254) in SPM12 (Wellcome Trust Centre for Neuroimaging, London, UK; release 6906). The processing for VBM included spatial registration to the IXI555 MNI152 reference template using the DARTEL method, tissue classification into gray matter (GM), white matter (WM), and cerebrospinal fluid, and bias correction of intensity non-uniformities. The transformations of each voxel from the native to the template space (i.e., Jacobian determinants) were calculated during the normalization. The individual normalized GM maps were then modulated by this Jacobian determinant to correct for normalization processing. Finally, modulated normalized GM maps were smoothed with an 8-mm full width at half maximum (FWHM) kernel. To restrict our analyses to GM regions, we used a GM mask calculated by thresholding the mean of GM maps of all participants at 0.3. Total intracranial volume was also calculated using the SPM Tissue Volumes Utility.
DBM is based on the Jacobian Determinant calculated during the VBM normalization process [14]. For each voxel, a value between -1 (contraction) and 1 (expansion) was assigned on individual Jacobian maps. These Jacobian maps were also smoothed with an 8-mm FWHM kernel. Thus, a mask of GM and WM encompassing the whole brain was computed by thresholding the mean of GM and WM maps of all participants at 0.3, which were subsequently overlapped. Only voxels which yielded a non-zero value were included in the analysis mask.
Region-of-interest analysis
Three different region-of-interest (ROI) analyses were performed. First, the basal forebrain was subdivided into four distinct regions, namely the Ch1-2–3 and the Ch4 groups in each hemisphere, using the SPM Anatomy Toolbox [28]. The segmentation was performed on VBM maps using the atlas from Zaborszky et al. [29] based on digitized histological sections of ten post-mortem brains of middle-aged to older healthy subjects. The Ch1, Ch2, and Ch3 groups were considered altogether in this atlas, due to the difficulty of delineating these nuclei groups separately. Second, we investigated the volume of five subdivisions of the CC. Every individual T1-weighted scan was first processed using FreeSurfer (version 5.3.0), which included removal of nonbrain tissue, Talairach transformation, segmentation of white matter and deep gray matter volumetric structures, intensity normalization, and cortical reconstruction [30, 31]. Resulting volumetric and cortical maps were carefully inspected and manually corrected by two trained operators (S.R. and M.G.). The mri_cc script [32] was then used on the individual subcortical volumetric maps to automatically segment and label the CC into five separate subdivisions, namely the anterior, mid-anterior, central, mid-posterior, and posterior subdivisions, yielding volume values for each subsection as well as for the total CC. Note that the default parameters of the script yield subdivisions that are equally spaced in terms of distance along the primary eigendirection of the CC. Finally, we performed an a priori complementary ROI analysis on the brainstem using GM and WM DBM maps, given the importance of this structure in synucleinopathy pathology. Hence, a brainstem mask fitting our population was obtained by calculating the logical disjunction of the previously described GM and WM mask used for DBM with the brainstem extracted from Hammersmith’ brain atlas [33].
Statistical analysis
Demographic and clinical variables
Statistical analyses were conducted using IBM SPSS Statistics, version 25.0 (IBM Corporation, Armonk, NY, USA). Between-group differences for continuous variables were accordingly assessed with either one-way analysis of variance (ANOVA) or the Kruskall-Wallis’ H test. Pairwise comparisons for continuous variables were investigated with either Student t tests or Mann-Whitney U tests. A Fisher-Freeman-Halton exact test of independence and χ2 tests were conducted to assess differences on categorical variables. Finally, a cognitive composite score was calculated for each cognitive domain, by averaging the z scores obtained on the individual tasks composing each domain [6].
Morphometric analyses
The presence of structural differences in DBM (GM and WM and brainstem mask) and VBM (GM only) was investigated between controls, RBD patients with MCI, and RBD patients without MCI, using voxel-wise general linear modeling (GLM) in SPM12. Voxel-wise multiple regression models were used to assess potential associations between morphometric data (DBM and VBM, separately) and measures of attention and executive functions, learning and memory, visuospatial functions, and motor symptoms (UPDRS-III) in the RBD group. Age, sex, and years of education were added as confounding factors in all models. Total intracranial volume was also added as a confounder for VBM analyses. All results were considered significant at p < 0.05 corrected for multiple comparisons (family-wise error, FWE) using the threshold-free cluster enhancement algorithm [34], with 5,000 permutations.
To investigate group-wise differences in volume of the whole CC, an ANCOVA was performed. To control for head size, all volumes were divided by the total intracranial volume calculated by the SPM Tissue Volumes Utility, which provides slightly superior estimates of intracranial volume in SPM 12.0 compared to Freesurfer 5.3.0 [35]. Age, sex, and years of education were entered as covariates. Additionally, MANCOVAs were performed to test for group differences on combined CC subsections and Ch1-4 region volumes while controlling for the same variables. ANCOVAs were subsequently performed as post-hoc tests to assess the between-group effects on CC segments or Ch1-4 regions, and false discovery rate (FDR) post-hocs were used to assess significant contrasts. Partial Pearson correlations or Spearman’s rank-order correlations (when distribution was not normal) controlling for age, sex and years of education were performed in the RBD group between significant CC segments and Ch1-4 volume, and cognitive and motor scores.
RESULTS
Demographic and clinical data
Of the initial cohort, 7 RBD patients were excluded (six due to parkinsonism at the neurological examination and one due to MRI artefacts). Therefore, a total of 52 patients and 41 controls were included in the study (Table 1). Among the RBD group, 17 (33%) were diagnosed with MCI. There were no significant differences between groups regarding age, years of education, or handedness. Moreover, the two RBD subgroups did not differ for RBD duration and the severity of motor symptoms. The proportion of male was higher in RBD patients without MCI than controls. Moreover, as expected, patients with MCI scored significantly lower in the three cognitive domains and on the MoCA (24.0±3.2) compared to patients without MCI (27.0±2.0) and controls (27.9±1.4).
Demographic and clinical characteristics of participants
Data are shown as mean (SD). RBD-MCI, rapid-eye-movement sleep behavior disorder with mild cognitive impairment; RBD-nMCI, RBD without MCI; PSG, polysomnography; UPDRS-III, Unified Parkinson’s Disease Rating Scale, Part III; MoCA, Montreal Cognitive Assessment. aAnalysis of variance. bFisher-Freeman-Halton exact test for contingency. cChi-square with Bonferroni correction for multiple comparisons. dMann-Whitney U test. eKruskall-Wallis H test. fStudent t test.
MRI
DBM
RBD with MCI vs RBD without MCI. Patients with MCI showed tissue contraction in the pallidum and thalamus, the posterior cingulate cortex and precuneus, and in the corona radiata near the left central sulcus as compared to patients without MCI (Table 2; Fig. 1). The internal capsule and the midbrain (including red nuclei and substantia nigra) were also contracted in patients with MCI. Pairwise comparisons of brainstem masks revealed an extended cluster of contracted voxels in the midbrain, extending caudally in the pons. No volume expansions were found.
Results of DBM and VBM analyses
Results are corrected with Family-wise error (FWE) at p < 0.05 with age, sex, education, and total intracranial volume (for VBM only). DBM, deformation-based morphometry; VBM, voxel-based morphometry; RBD-MCI, rapid-eye-movement sleep behavior disorder with mild cognitive impairment; RBD-nMCI, RBD without MCI; MNI, Montreal Neurological Institute; UPDRS-III, Unified Parkinson’s Disease Rating Scale, Part III.
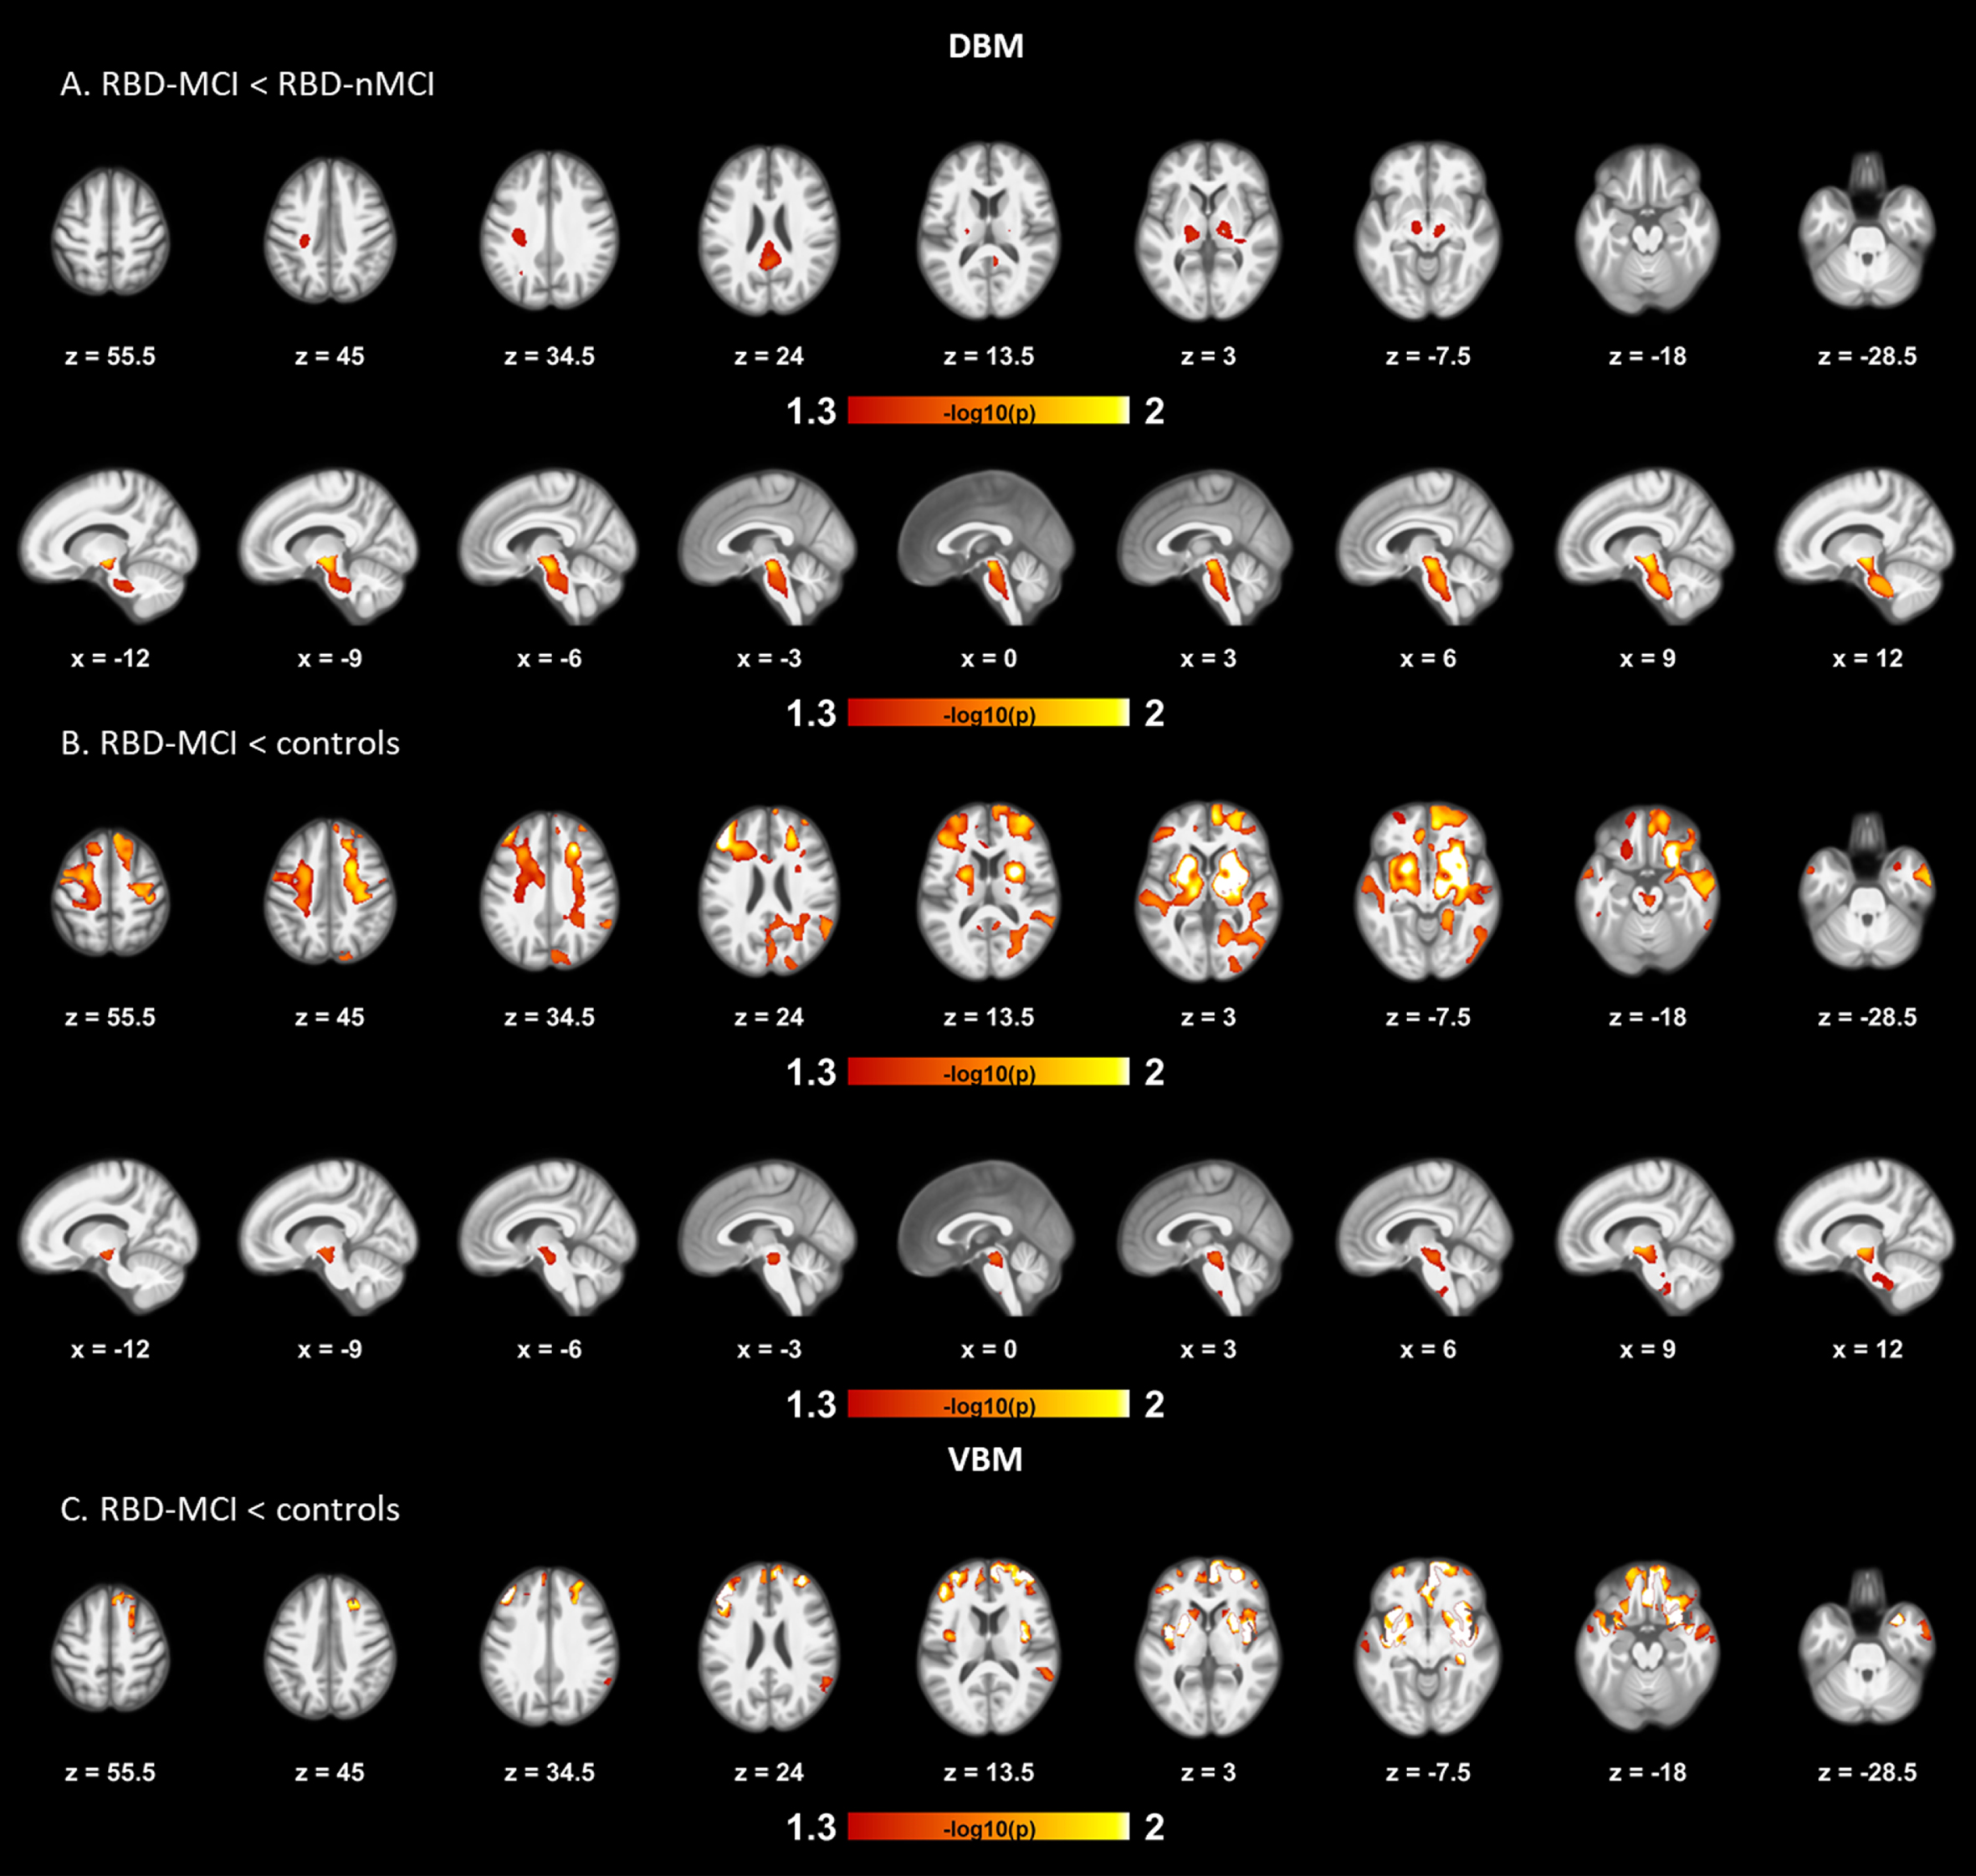
Results of DBM and VBM pairwise comparisons between RBD patients with MCI, RBD patients without MCI, and controls. The first row displays DBM tissue contraction on multiple axial slices in patients with MCI compared with patients without MCI (A). Peaks of contraction are seen in the posterior cingulate cortex, internal capsule, and midbrain, extending to the pallidum, thalamus, and precuneus. The second row displays results obtained from the brainstem mask. The cluster of contracted voxels encompasses the midbrain and extends caudally in the pons. The third and fourth rows display tissue contractions seen in patients with MCI compared with controls on the whole-brain and brainstem masks, respectively (B). Tissue contractions are widespread, but particularly prominent for the insula, middle frontal gyrus, putamen, and superior temporal gyrus. Contracted areas also include the medial frontal cortex, superior occipital cortex, pallidum, thalamus, amygdala, and the right hippocampus. White matter also shows significant areas of tissue contraction across the brain and the midbrain. In ROI analyses of the brainstem, contraction was seen in patients with MCI on most of the midbrain, extending to the superior portion of the pons and ventral ponto-medullary junction. The last row represents VBM results of gray matter volume reduction seen in patients with MCI compared to controls (C). Significant clusters of atrophy were located in the insula, middle temporal gyrus, right angular gyrus, superior temporal gyrus and orbitofrontal gyrus, and extended to bilateral frontal and temporal cortices, basal ganglia, amygdala, the right hippocampus and right anterior cingulate cortex. All results are presented at p < 0.05 corrected for multiple comparisons (FWE), with age, sex, and education as covariates. The color bar indicates the logarithmic scale of p values (-log10) for pairwise group differences, with red-white areas representing volume reduction or contraction (DBM) or gray matter atrophy (VBM) in the first compared to the last group in the contrast. No volume differences were found between RBD patients without MCI and controls. VBM, voxel-based morphometry; DBM, deformation-based morphometry; ROI, region of interest; RBD-MCI, rapid-eye-movement sleep behavior disorder with mild cognitive impairment; RBD-nMCI, RBD without MCI; FWE, family-wise error.
RBD with MCI vs controls. Patients with MCI had widespread tissue contraction spanning the whole cortex that was particularly prominent for the middle frontal gyrus, the insula, and the superior occipital cortex (Table 2; Fig. 1). Subcortical areas also showed significant tissue contraction, including the bilateral putamen, pallidum, thalamus, amygdala, and the right hippocampus. The WM also showed significant areas of tissue contraction across the brain and the midbrain. Comparisons of brainstem masks highlighted two clusters of contraction, one covering most of the midbrain and extending to the superior portion of the pons, the other located at the ventral ponto-medullary junction. No volume expansions were found.
RBD without MCI vs controls. Patients without MCI showed no significant brain deformation.
VBM
In comparison to controls, patients with MCI showed a decrease in GM in the bilateral frontal and temporal lobes, insula, basal ganglia (caudate nuclei, putamen and pallidum), and amygdala, the right hippocampus, medial frontal cortex, right anterior cingulate cortex and right angular gyrus (Table 2; Fig. 1). No significant volume differences were found between the two patient subgroups, or between patients without MCI and controls. Finally, no volume increases were found in patients.
CC volumetry
One control subject and one patient without MCI were rejected for CC analyses after Freesurfer processing due to poor segmentation. Therefore, a total of 51 RBD patients and 40 controls were included in the statistical model. Between-group differences were found on the combined CC subsections (Table 3). Between-groups effect was significant for the mid-posterior segment, patients with MCI having a lower mid-posterior volume compared to those without MCI. A trend towards atrophy was also observed in the mid-posterior segment between patients with MCI and controls (p = 0.055). The ANCOVA testing for the whole CC volume found no significant between-group differences.
Results of ROI volume analyses
Results represent means of normalized volume. Covariables include age, sex, and education. Post-hoc results are adjusted with false discovery rate correction. ROI, region of interest; RBD-MCI, rapid-eye-movement sleep behavior disorder with mild cognitive impairment; RBD-nMCI, RBD without MCI; CC, corpus callosum; BF, basal forebrain; L, left; R, right. aANOVA. bPillais trace. cBetween-subjects effect.
Basal forebrain Ch1-4 regions
No significant between-group differences were found for the Ch1-3 and Ch4 regions (Table 3). However, exploratory analyses using separate ANCOVAs revealed that the volume of the left Ch4 cell group was lower in patients with MCI compared to controls.
Regression analyses
Results of regressions are presented in Table 2 and Fig. 2. DBM analyses revealed that poorer performance in attention and executive functions was associated with brain contraction in the midbrain and insula, extending to regions of the internal capsule, putamen, pallidum, thalamus, orbitofrontal cortex, and anterior part of the right temporal lobe. Poorer visuospatial performance was associated with a cluster of contraction located in the left superior colliculus. Moreover, more severe motor symptoms (UPDRS-III) was associated with contraction in the anterior cingulate cortex, middle frontal gyrus and superior parietal lobule. Contracted regions also encompassed the midbrain, internal capsule, thalamus, caudate nucleus, genu and body of the CC, and regions of the frontal, temporal, and parietal lobes. No significant results were found for the VBM, CC (ROI), and Ch1-4 analyses, or with the learning and memory domain.
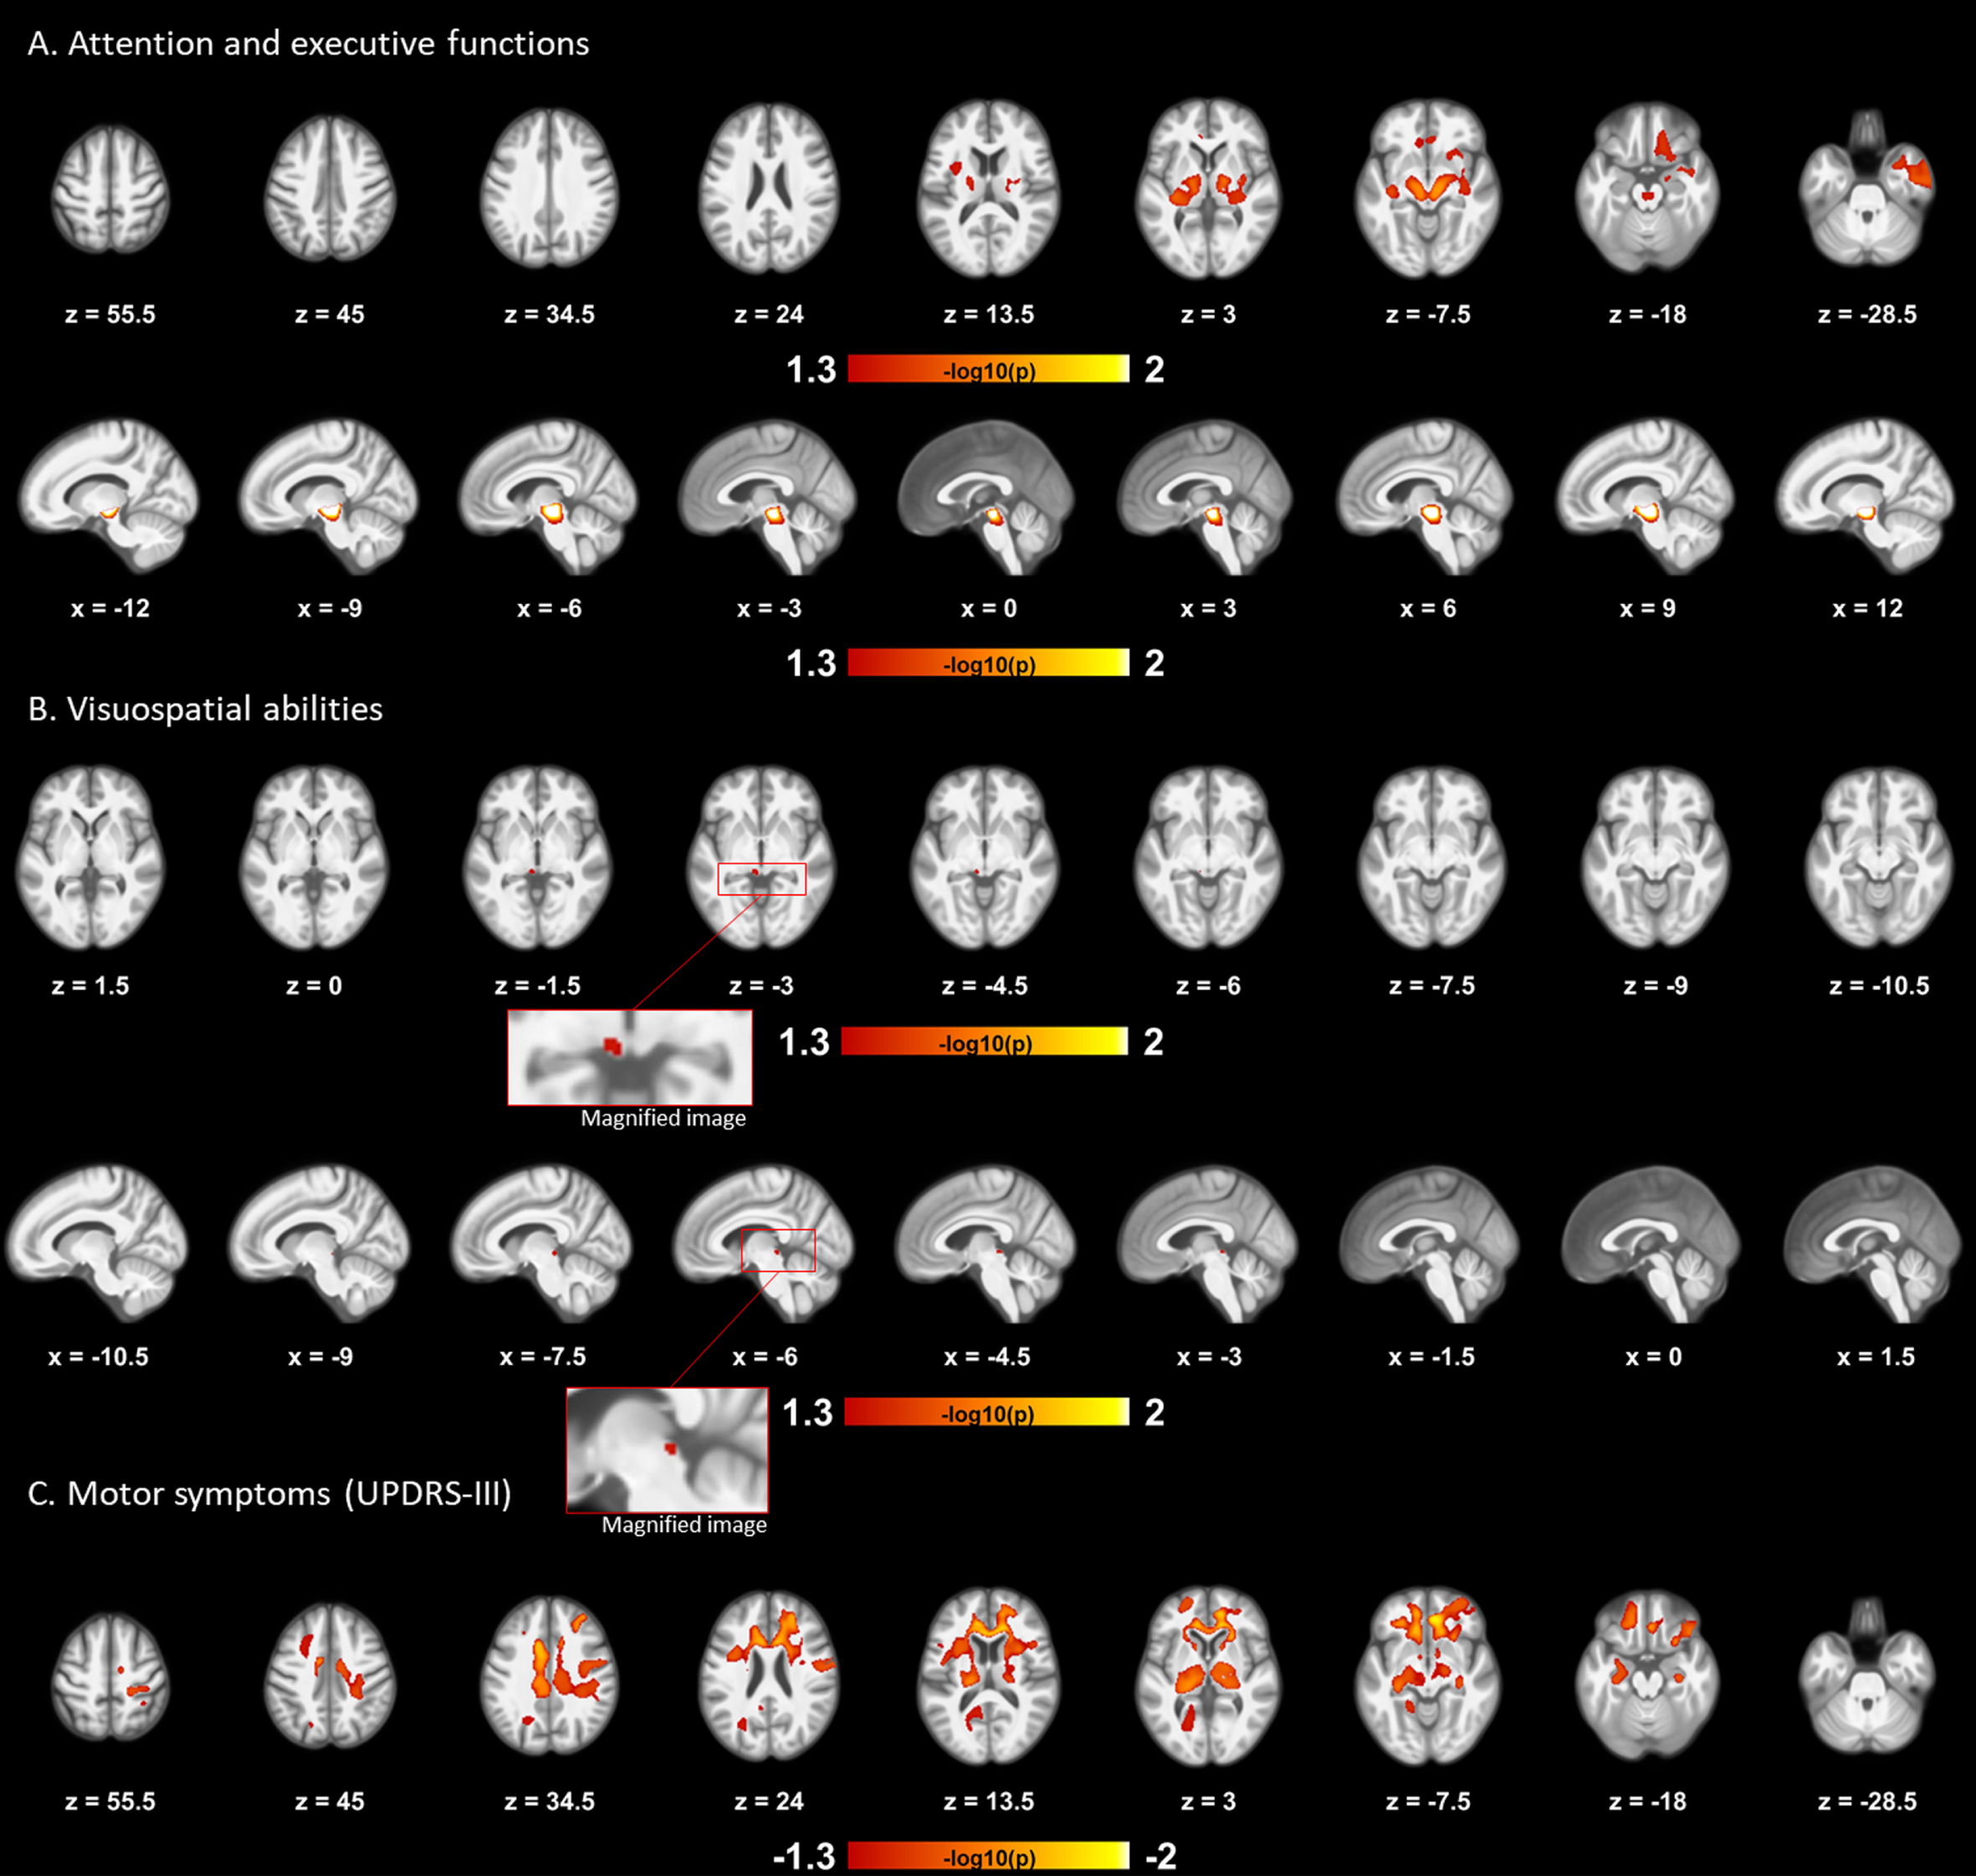
Results of regression analyses. Volume deformations (DBM) were associated with lower composite cognitive scores and more severe motor symptoms in RBD patients. Poorer performance in attention and executive functions was associated with clusters of contracted tissue located in the midbrain and insula, extending to the internal capsule, putamen, pallidum, thalamus, orbitofrontal cortex and anterior part of the right temporal lobe (A). The first and second rows display results obtained from the whole-brain and brainstem mask, respectively. The third and fourth rows represent the positive association obtained from the brainstem mask between poorer visuospatial performance and contraction of the left superior colliculus (B). Results are displayed in the axial and sagittal planes, respectively. The final row displays the association between more severe motor symptoms (UPDRS-III) and clusters of contracted tissue located in the anterior cingulate cortex, middle frontal gyrus and superior parietal lobule, extending to regions of the internal capsule, thalamus, caudate nucleus, genu and body of the CC, and regions of the frontal, temporal, and parietal lobes (C). Color bars indicate the logarithmic scale of p values (-log10) for multiple regressions controlling for age, sex and education. Results were considered significant at p < 0.05, while corrected for multiple comparisons (FWE). RBD, rapid-eye-movement sleep behavior disorder; UPDRS-III, Unified Parkinson’s Disease Rating Scale, Part III; DBM, deformation-based morphometry; CC, corpus callosum; FWE, family-wise error.
DISCUSSION
In the current study, we performed analyses of local brain deformation and volume to investigate the GM and WM tissue alterations related to MCI in RBD. We found that the presence of MCI in patients is associated with more severe and extensive cortical and subcortical tissue loss as compared to both patients without MCI and controls. RBD patients without MCI did not show any significant structural alterations as compared to controls. In RBD, brain contractions were associated with poorer performance in specific cognitive domains. Together with previous results from a study on the same cohort, which focused on cortical thickness and subcortical shape [6], the results of the present study show that patients with MCI have more pronounced neurodegeneration than patients without MCI. This is in line with previous findings that this specific population is at higher risk of conversion to DLB or PD with cognitive impairment [1, 3–5] and should be followed more closely to provide early intervention.
MCI is present in more than one third of idiopathic RBD patients [1, 3–5]. The presence of MCI in RBD associates with a more severe phenotype and with higher risk of developing DLB and PD with cognitive impairment [5]. To our knowledge, only one MRI study on the same cohort has looked at the association between MCI and the MRI structural brain changes in this population, reporting widespread thinning in the frontal, cingulate, temporal, and occipital cortices and surface contractions in the putamen, pallidum, and thalamus in the presence of MCI [6]. The current study focused on volumetric changes over the whole brain and found a pattern of local volume contractions and reductions in some of the previously reported regions, but also in other cortical and subcortical regions, including the precuneus, caudate nuclei, amygdala, corona radiata, midbrain, right hippocampus, and mid-posterior segment of the CC. A few functional neuroimaging studies have investigated brain changes related to MCI in RBD. A recent study using 123I-FP-CIT-SPECT showed that patients with MCI had reduced dopamine active transporter binding in the putamen and caudate compared to patients with normal cognition [3]. This is consistent with our results showing volume contraction of the midbrain (versus patients without MCI and controls) and atrophy of both the putamen and caudate nuclei (versus controls) in patients with MCI, which suggests a link between functional and structural anomalies of the nigro-striatal pathway. Another SPECT study using (99mc) Tc-Ethylene Cysteinate Dimer showed that RBD patients with MCI had cerebral hypoperfusion in the frontal, temporal, parietal, and occipital cortices, and hyperperfusion in the right hippocampus, parahippocampal gyrus, putamen and left paracentral [36], which overlap with several atrophied regions reported in the present study. Globally, RBD patients with MCI undergo extensive structural and functional brain alterations.
A few studies have performed VBM in RBD cohorts without considering the presence of MCI, reporting GM changes in the hippocampus, cerebellum, pons, parahippocampal region and frontal lobes, overlapping with several regions altered in the patients with MCI of the present study as compared to controls [21, 37–39]. The results of the present study suggest that earlier findings could be partially explained by the inclusion of patients with MCI in their RBD population. However, we cannot exclude that brain volumetric differences exist between RBD patients without MCI and controls, and future studies with larger sample size should be performed.
Results of previous studies on prodromal stage and formal DLB and PD with cognitive impairment show a clear topographical overlap with the pattern of brain atrophy reported in the present study. First, neuroimaging studies of the prodromal stage of DLB have identified structural anomalies in this population, most consistently found in the insula and medial frontal gyrus [40]. A recent study, using DBM, identified a pattern of brain atrophy among RBD patients predicting the development of DLB, which included atrophy in the basal ganglia, thalamus, corona radiata, amygdala, fronto-temporal GM, and expansion of the cerebrospinal fluid-filled spaces [41]. PD patients with MCI, who are at higher risk of dementia, show GM atrophy of the left anterior insula, according to a meta-analysis of 20 VBM studies [11]. Moreover, the presence of RBD in PD is associated with a more severe clinical phenotype and with increased risk of MCI and dementia [4, 42]. A few neuroimaging studies have investigated structural changes in PD with RBD using VBM [16, 43–47], DBM [16, 48], and surface-based cortical thinning [16], and found more severe brain alterations in this specific population compared to PD patients without RBD. In DLB or PD with dementia, studies have reported GM atrophy mainly in the insular cortices, temporal lobes, and lenticular nuclei [12], or in the medial temporal lobes and basal ganglia, respectively [13]. The similarity in the pattern of neurodegeneration observed between RBD patients with MCI and individuals diagnosed with synucleinopathies with cognitive impairment could reflect the high probability of conversion of RBD patients with MCI towards DLB or PD with cognitive impairment.
The present study explored the tissue volumes of the CC and cholinergic basal forebrain cell groups, given their importance in the manifestation of cognitive functions in PD [17, 18]. We found volume reduction of the mid-posterior segment of the CC and a trend toward atrophy of the left Ch4 region in patients with MCI. Structural anomalies of the CC (including in the mid-posterior segment) were reported in PD with cognitive impairment [17, 49], PD with RBD [50], and in DLB [51] patients. The Ch4 cell group contains the nucleus basalis of Meynert, which provides the principal source of cholinergic innervation to the cerebral cortex and amygdala [52]. Structural anomalies of the nucleus basalis of Meynert (substantia innominata and posterior subdivision of the nucleus, Ch4p) have been linked to cognitive impairment in PD [7, 18], and have been reported in DLB [20]. Our exploratory analyses suggest that this may also be the case in RBD patients with MCI. Longitudinal studies would be required to better comprehend and predict pathological trajectories of the prodromal phase of synucleinopathies-related cognitive impairment in RBD.
Finally, regression analyses were conducted between MRI metrics and two markers of neurodegeneration in RBD, namely cognitive and motor symptoms [1]. Lower performance in attention and executive functions was associated notably with clusters of contracted GM and WM in the midbrain, lenticular nuclei, thalamus, and orbitofrontal cortex. In a previous study with the same cohort focusing on cortical thickness in RBD, an association was reported between poorer attention and executive functions with thinning in the frontal regions [6]. These results may reflect the implication of the fronto-striatal brain circuit in attention and executive functions, as is the case in PD [53]. Another association was found between poorer visuospatial performance and contraction of the left superior colliculus. The superior colliculi are involved in spatial attention [54] and demonstrate signs of degeneration in DLB and PD [55, 56]. Finally, more severe motor symptoms as measured by the UPDRS-III scores were associated with contraction in several cortical and subcortical regions implicated in motor functions. These results are in line with previous studies, which have reported associations between cognitive and motor performance and cortical thinning [6, 21] or abnormal functional activation [57] in RBD and provide evidence that cognitive and motor symptoms of RBD could arise from the disruption of both cortico-cortical and cortico-subcortical circuits.
Some limitations should be noted in this study. First, there are currently no standard diagnostic criteria for MCI in RBD. We opted for a 3-domain solution, which previously proved effective in detecting structural and functional brain anomalies associated with MCI in RBD [4, 36]. Second, the cross-sectional design and the absence of DAT scan employed in the present study limits the interpretability of morphological data obtained. Indeed, the pattern of atrophy found in patients with MCI as compared to patients without MCI and controls could reflect the possibility that they are further along the process of conversion towards an overt neurodegenerative disorder. The longitudinal follow-up of a large sample of RBD patients will shed light on the structural abnormalities associated with progression toward DLB or PD. Finally, since DBM does not inform on the specific brain networks altered in contracted regions, future studies should more closely investigate diffusion-weighted metrics and functional or structural brain connectivity to better understand the pathophysiology of cognitive impairment in RBD.
Footnotes
ACKNOWLEDGMENTS
This study and authors were funded by the Canadian Institutes of Health Research (RBP, JM, OM, JC, JFG), the Fonds de recherche du Québec –Santé (JFG) and W. Garfield Weston Foundation (RBP, JM, JFG). DRP received scholarships from the Fonds de recherche du Québec –Santé and Parkinson Canada. SR received a scholarship from the Fonds de recherche du Québec –Santé. RBP received personal compensation for travel, speaker fees, and consultation from Biotie, Biogen, Boehringer-Ingelheim, Roche, and Teva Neurosciences, outside the submitted work. JM received personal compensation for consultancy services from Takeda, Merck, Paldin, and Eisai outside the submitted work. He also holds a Canada Research Chair in Sleep Medicine. JFG holds a Canada Research Chair in Cognitive Decline in Pathological Aging.
CONFLICT OF INTEREST
The authors have no conflict of interest to report.