
Abstract
Background:
Idiopathic rapid eye movement sleep behavior disorder (iRBD) often precedes the development of α-synucleinopathy diseases.
Objective:
We aimed to assess the predictive value of clinical variables and biomarkers for the early development of α-synucleinopathy diseases in subjects with iRBD.
Methods:
56 patients with RBD Screening Questionnaire (RBDSQ) scores ≥5 at baseline and subsequent visit were enrolled as probable iRBD from the Parkinson’s Progression Markers Initiative (PPMI) database. Baseline clinical data and biomarkers were analyzed. The endpoint was defined as disease progression to α-synucleinopathy diseases. Cox proportional hazard and Kaplan-Meier analyses were used to evaluate the predictive values of the indicators.
Results:
During a mean follow-up duration of 5.1 years, 15 of 56 patients (26.8%) developed α-synucleinopathy diseases. Baseline clinical variables, including University of Pennsylvania Smell Identification Test (UPSIT, HR = 26.18, p = 0.004), 15-item Geriatric Depression Scale (GDS, HR = 14.26, p = 0.001), Montreal Cognitive Assessment (MoCA, HR = 3.56, p = 0.025), and Hopkins Verbal Learning Test Total recall (HVLT-TR, HR = 3.70, p = 0.014); genotype status of TMEM175 (HR = 3.74, p = 0.017), SCN3A (HR = 5.81, p = 0.022) and NUCKS1 (HR = 0.342, p = 0.049); ratio of phosphorylated tau to total tau (p-tau/t-tau, HR = 8.36, p = 0.001) in cerebrospinal fluid; and gray matter atrophy in inferior frontal gyrus (IFG, HR = 15.49, p = 0.001) were associated with phenoconversion to α-synucleinopathy diseases. A model combined the three independent variables (UPSIT, TMEM175 and gray matter atrophy in IFG) exhibited significantly improved predictive performance.
Conclusion:
For patients with iRBD, progression to α-synucleinopathy diseases can be predicted with good accuracy using a model combining clinical variables and biomarkers, which could form a basis for future disease prevention.
Keywords
INTRODUCTION
Idiopathic rapid eye movement (REM) sleep behavior disorder (iRBD) is a clinical disorder characterized by loss of normal muscle atonia during the REM phase of sleep [1]. Since the seminal work by Schenck et al. [2], a series of studies revealed that some iRBD patients (31.1%–41.9% after 3–5 years follow-up [3–5]) eventually develop α-synucleinopathies, including Parkinson’s disease (PD), dementia with Lewy bodies (DLB), and multiple system atrophy (MSA), which have a long prodromal period before the manifestation of clinical signs [6, 7]. Considering that the median intervals for phenoconversion could be long, early predictors of conversion are needed.
\enlargethispage 2pt Many promising biomarkers associated with phenoconversion have already been reported, including dopamine transporter (DAT) imaging and olfactory impairment [4, 9]. Moreover, the International RBD Study Group has recently assessed combined prospective follow-up data from 24 centers, and 13/21 predictors (clinical features and DaTscan) were recognized to have predictive value for the conversion [3].
In addition to these common markers, the genetic basis of iRBD has increasingly been investigated [10, 11], while tissue and cerebrospinal fluid (CSF) biomarkers have also been recognized [12, 13]. Nevertheless, few longitudinal studies have been performed regarding the predictive abilities of genotype and CSF biomarkers for conversion, and to our knowledge, no previous study has combined clinical data, genotypes, CSF biomarkers, and imaging parameters or calculated the combined predictive value of these variables for the development of α-synucleinopathies in iRBD patients. In this study, we investigated various clinical variables, genetic status, CSF biomarkers and neuroimaging parameters, both individually and in combination, that can be used to predict phenoconversion.
MATERIALS AND METHODS
Study design and participants
The Parkinson’s Progression Markers Initiative (PPMI) is an observational, international, multicenter study aimed at identifying biomarkers of PD progression. The methodology and details of the study assessments are available on the PPMI website (http://ppmi-info.org).
As previously described [14–16], PPMI enrolled healthy participants as well as de novo PD patients. Participants with iRBD or isolated hyposmia were recruited for the prodromal part of PPMI. Non-manifesting carriers of mutations in the SNCA, LRRK2, and GBA genes were also included as genetic cohorts. The data used in this study were downloaded on December 2019 from the PPMI database and were updated on April 2020. For this study, we used the dataset for probable iRBD patients who met the following criteria: 1) men or women aged ≥45 years; 2) RBD Screening Questionnaire (RBDSQ) score ≥5 at baseline and at subsequent visit; 3) had available clinical assessment, genetic and CSF data. RBDSQ is a widely used tool to assess RBD symptoms and has been validated in several populations, demonstrating both high sensitivity and specificity [17–19]. An RBDSQ score of 5 was used as the cutoff value as previously described [20]. To increase stability of our findings, we confirmed that the probable iRBD, which was present at baseline, was still present (with RBDSQ score ≥5) at subsequent follow-up visit. Participants were excluded if they were considered as secondary RBD at baseline, namely if they had a clinical diagnosis of PD based on established diagnostic criteria [21].
Overall, 56 probable iRBD patients with available baseline clinical assessment, genetic and CSF data were included. In particular, 22 of them underwent PSG and were all confirmed RBD with central reading based on the following criteria [14]: 1) 18% of any electromyography (EMG) activity in m. mentalis, 32% of any EMG activity in mentalis and flexor digitorum superficialis (FDS; in 3 s bins); 2) 27% of any EMG activity in m. mentalis and 32% of any EMG activity in m. mentalis and FDS (in 30 s bins). After enrollment, participants were followed up at 3-month intervals in the first year and 6-month intervals in the subsequent years. The endpoint was defined as disease progression from iRBD to α-synucleinopathy diseases. Diagnoses were ascertained by the specialists with reference to the standard diagnostic criteria of PD, MSA and DLB. Evaluations of motor symptoms at baseline and at the time of conversion can be found in Supplementary Table 1.
Each participating PPMI site received approval from an ethics standards committee on human study before the start of the study. Written informed consent was obtained from all study participants.
Clinical assessment
Motor symptom severity was assessed with the Movement Disorders Society Unified Parkinson Disease Rating Scale (MDS-UPDRS) part III. Olfactory impairment was measured by the University of Pennsylvania Smell Identification Test (UPSIT). Depressive symptoms were assessed with the short version of the 15-item Geriatric Depression Scale (GDS). Autonomic dysfunction was assessed with the Scales for Outcomes in Parkinson’s Disease–Autonomic (SCOPA-AUT). Sleep disturbances were assessed with the Epworth Sleepiness Scale (ESS). Global cognitive status was assessed using the Montreal Cognitive Assessment (MoCA). Domain-specific neuropsychological performance was measured using the following instruments. Verbal memory was assessed by the Hopkins Verbal Learning Test (HVLT), Immediate Recall, Delayed Recognition False Alarms, and Delayed Recognition Hits. Verbal fluency was assessed by the Semantic Fluency Test (SFT). Processing speed was assessed by the Symbol Digit Modalities Test (SDMT). Visuospatial abilities were assessed by the Benton Judgement of Line Orientation Test (JLO). Executive functioning was assessed by the Letter-Number Sequencing Test (LNS).
CSF biomarkers and genetic data
CSF was collected at each study site using standardized lumbar puncture procedures. Details about shipment, storage and biomarker measurement were described previously [22] and can be found in the PPMI biologics manual. Briefly, amyloid-β 1–42 (Aβ), total tau (t-tau), and phosphorylated tau (p-tau) were measured using a multiplex Luminex xMAP platform (Luminex Corp) with INNO-BIA AlzBio3 immunoassay kit-based reagents (Fujirebio-Innogenetics, Ghent, Belgium), while CSF total α-synuclein was measured with a commercially available enzyme-linked immunosorbent assay (ELISA) kit (Covance, Dedham, MA).
Genetic testing was performed by PPMI Genetics Core as previously described [23]. Briefly, DNA specimens were genotyped using two genotyping arrays, ImmunoChip and NeuroX, as per the manufacturer’s protocol. Genotype information for selected PD-associated variants was previously extracted and is available on the PPMI site. The selected variants included in this study were also shown in Supplementary Table 2.
Voxel-based morphometry (VBM) analysis
Magnetic resonance imaging (MRI) data were downloaded from the PPMI database on December 2019. Overall, 46 patients had available baseline high resolution three-dimensional T1-weighted MRI scans that were performed within 1 year from baseline evaluations. 4 patients were excluded due to excessive head-motion artifacts. T1-weighted images of 33 subjects were acquired using the following parameters: matrix x = 256, y = 240–256, z = 170–240 repetition time (TR) = 1900–2300 ms, echo time (TE) = 2.3–3.2 ms, slice thickness = 1–1.2 mm, flip angle = 9. T1-weighted images of 9 subjects were acquired using the following parameters: matrix x = 256–268, y = 192–255, z = 133–176, repetition time (TR) = 6.9–12.3 ms, echo time (TE) = 3.2–5.2 ms, slice thickness = 1–1.2 mm, flip angle = 8. Further details can be found in the PPMI MRI operations manual.
Computational Anatomy Toolbox 12 (CAT12, Gaser C, Jena University Hospital, http://www.neuro.uni-jena.de/cat/) and Statistical Parametric Mapping 12 (SPM12, Wellcome Department of Imaging Neuroscience, London, UK) software was used to perform whole-brain VBM analysis. Briefly, T1-weighted images were segmented into gray matter (GM), white matter (WM) and CSF after spatial normalization using the DARTEL algorithm. Nonlinear warping of GM images was then performed on the GM template in MNI space. The spatially normalized GM maps were modulated by the Jacobian determinant of the deformation field and corrected for individual brain sizes. The modulated, normalized GM images were smoothed by an 8 mm full-width at half-maximum (FWHM) isotropic Gaussian kernel.
Statistical analysis
Calculations were performed with SPSS 25 (IBM Corp., Armonk, NY). Baseline characteristics between the disease-free and disease-development groups were compared using the χ2 test or Fisher exact test for categorical variables and Student’s t test for continuous variables. The Kaplan-Meier method was used to analyze disease risk. Cox proportional hazards regression analyses were conducted to test the predictive abilities of the markers. For stratification, the following established cutoff values were used as previously described [3, 24–26]: UPDRS part III > 3 excluding action tremor, ESS≥10, GDS≥5, MoCA < 26, and UPSIT < 22. Cutoff values of cognitive tests were set >1.5 SD below the standardized mean: HVLT Total Recall ≤35, HVLT Recognition Discrimination ≤35, JLO≤6, LNS≤6, SFT≤35, and SDMT≤35. CSF biomarkers and relevant ratios were classified using the quartiles as the cutoff values in our study. Each variable was assessed with Cox regression, with hazard ratios (HRs) adjusted for age, sex and PSG confirmation (the patient underwent PSG or not). Two-tailed values of p < 0.05 were considered statistically significant differences. For VBM analysis, the following variables were used as covariates: age, sex, total intracranial volume (TIV) and imaging parameters. Significant results were displayed at a voxel-wise threshold of p < 0.001 uncorrected for multiple comparisons with a minimum cluster size of 50 voxels. If a significant difference was revealed in a cluster, the mean value of all voxels within this cluster was extracted for region of interest (ROI)-based post hoc analyses. For the model that combined clinical, genetic, CSF and neuroimage markers, the stepwise forward logistic regression model was used to evaluate which combination of variables best predicted iRBD conversion. All predictors with p < 0.05 in univariate analysis were selected for entry into the multivariate model. The stepwise forward selection started with no variable in the model, and then added the variable whose inclusion gave the most statistically significant improvement of the fit, and repeating this process until no further variable can be added to improve the model to a statistically significant extent. The predictive performances of the models were assessed with an area under a receiver operating characteristic curve (AUC).
Data availability statement
All data reported in this article are available in the PPMI database (http://ppmi-info.org).
RESULTS
Demographics
A total of 56 probable iRBD patients were included in this study. The average age at baseline was 66.0 years, and 41 patients (73.2%) were male. As shown in Table 1, no significant difference was observed at baseline between the nonconverters and converters, including age, sex, education, or constipation. To note, there were no significant differences in motor exam scores (UPDRS part III) at baseline between the groups. The mean follow-up duration (between baseline and last visit) was 5.1 years. During follow-up, 15 patients (26.8%) developed α-synucleinopathy diseases, of whom 12 had PD, 1 had DLB, 1 had MSA and 1 was diagnosed with unclassifiable dementia, with a progression-free survival (PFS) time of 7.1 years (Fig. 1) and an overall phenoconversion rate of 6.1% per year. The risk of phenoconversion according to Kaplan-Meier analysis was 7.1% after 2 years, 20.7% after 4 years and 36.7% after 6 years.
Patients demographics
Continuous variables are presented as mean±standard deviation (SD). UPDRS, Unified Parkinson Disease Rating Scale.
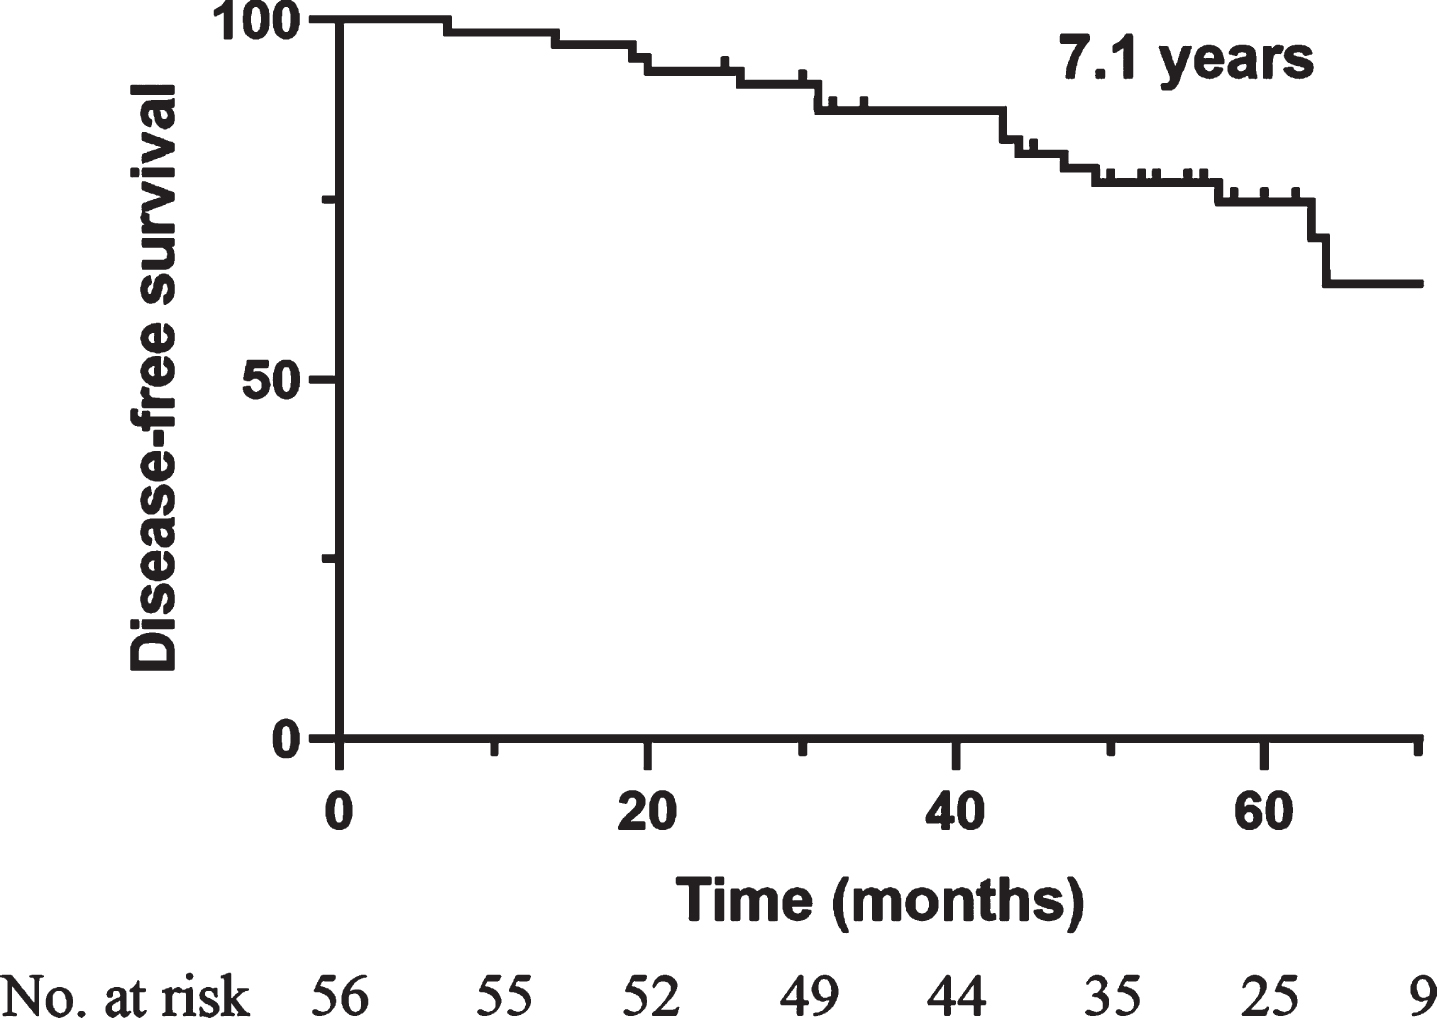
Kaplan-Meier plot of disease-free survival among iRBD patients. Ticks indicate censoring events.
Clinical risk factors for disease conversion
The comparisons of baseline clinical characteristics between the nonconverters and converters are shown in Table 2. Baseline data were missing for JLO, SDMT and UPSIT in 1 patient. iRBD patients with olfactory impairment (HR = 26.18, 95% CI 2.92–235.0, p = 0.004), depression (HR = 14.26, 95% CI 3.03–67.08, p = 0.001) and higher RBDSQ scores (HR = 6.50, 95% CI 1.34–31.44, p = 0.020) were more likely to develop α-synucleinopathy diseases. Furthermore, cognitive decline also showed predictive value, which interestingly appeared to be restricted in certain cognitive domains, namely, verbal memory. Patients with a lower score in MoCA (HR = 3.56, 95% CI 1.17–10.76, p = 0.025) and HVLT total recall (HR = 3.70, 95% CI 1.31–10.50, p = 0.014) were more likely to develop α-synucleinopathy diseases. For HVLT recognition discrimination, no significant difference was observed, although the converted group had slightly lower scores. Regarding the autonomic dysfunction, convertors had higher scores in SCOPA-AUT questionnaire, especially in gastrointestinal and cardiovascular domain. However, the difference was not statistically significant in this cohort.
Potential clinical predictors of α-synucleinopathy phenoconversion in iRBD
Continuous variables are presented as mean±standard deviation (SD). Hazard ratios (HRs) are with Cox proportional hazards, adjusting for age, sex and PSG confirmation, with 95% confidence intervals in parentheses. P values <0.05 are highlighted in bold text. ESS, Epworth Sleepiness Scale; GDS, Geriatric Depression Scale 15-item; HVLT, Hopkins Verbal Learning Test; JLO, Benton Judgement of Line Orientation Test; LNS, Letter-Number Sequencing Test; MoCA, Montreal Cognitive Assessment; RBDSQ, REM Sleep Behavior Disorder Screening Questionnaire; SCOPA-AUT, Scales for Outcomes in Parkinson’s Disease–Autonomic; SDMT, Symbol Digit Modalities Test; SFT, Semantic Fluency Test; UPSIT, University of Pennsylvania Smell Identification Test.
Simultaneously, Kaplan-Meier analysis was performed to analyze the relative PFS time according to the abovementioned index. As shown in Fig. 2A, the mean PFS time was 56.8 months in patients with hyposmia compared with 106.3 months for patients with normal olfaction function (p < 0.001). Patients with scores ≥5 on the GDS appeared to have shorter PFS than patients with scores <5 (29.6 months vs 89.5 months, p < 0.001, Fig. 2B). Moreover, patients with higher HVLT total recall scores (>35) exhibited longer PFS than did the remaining patients (92.1 months vs 49.0 months, p = 0.005, Fig. 2C).
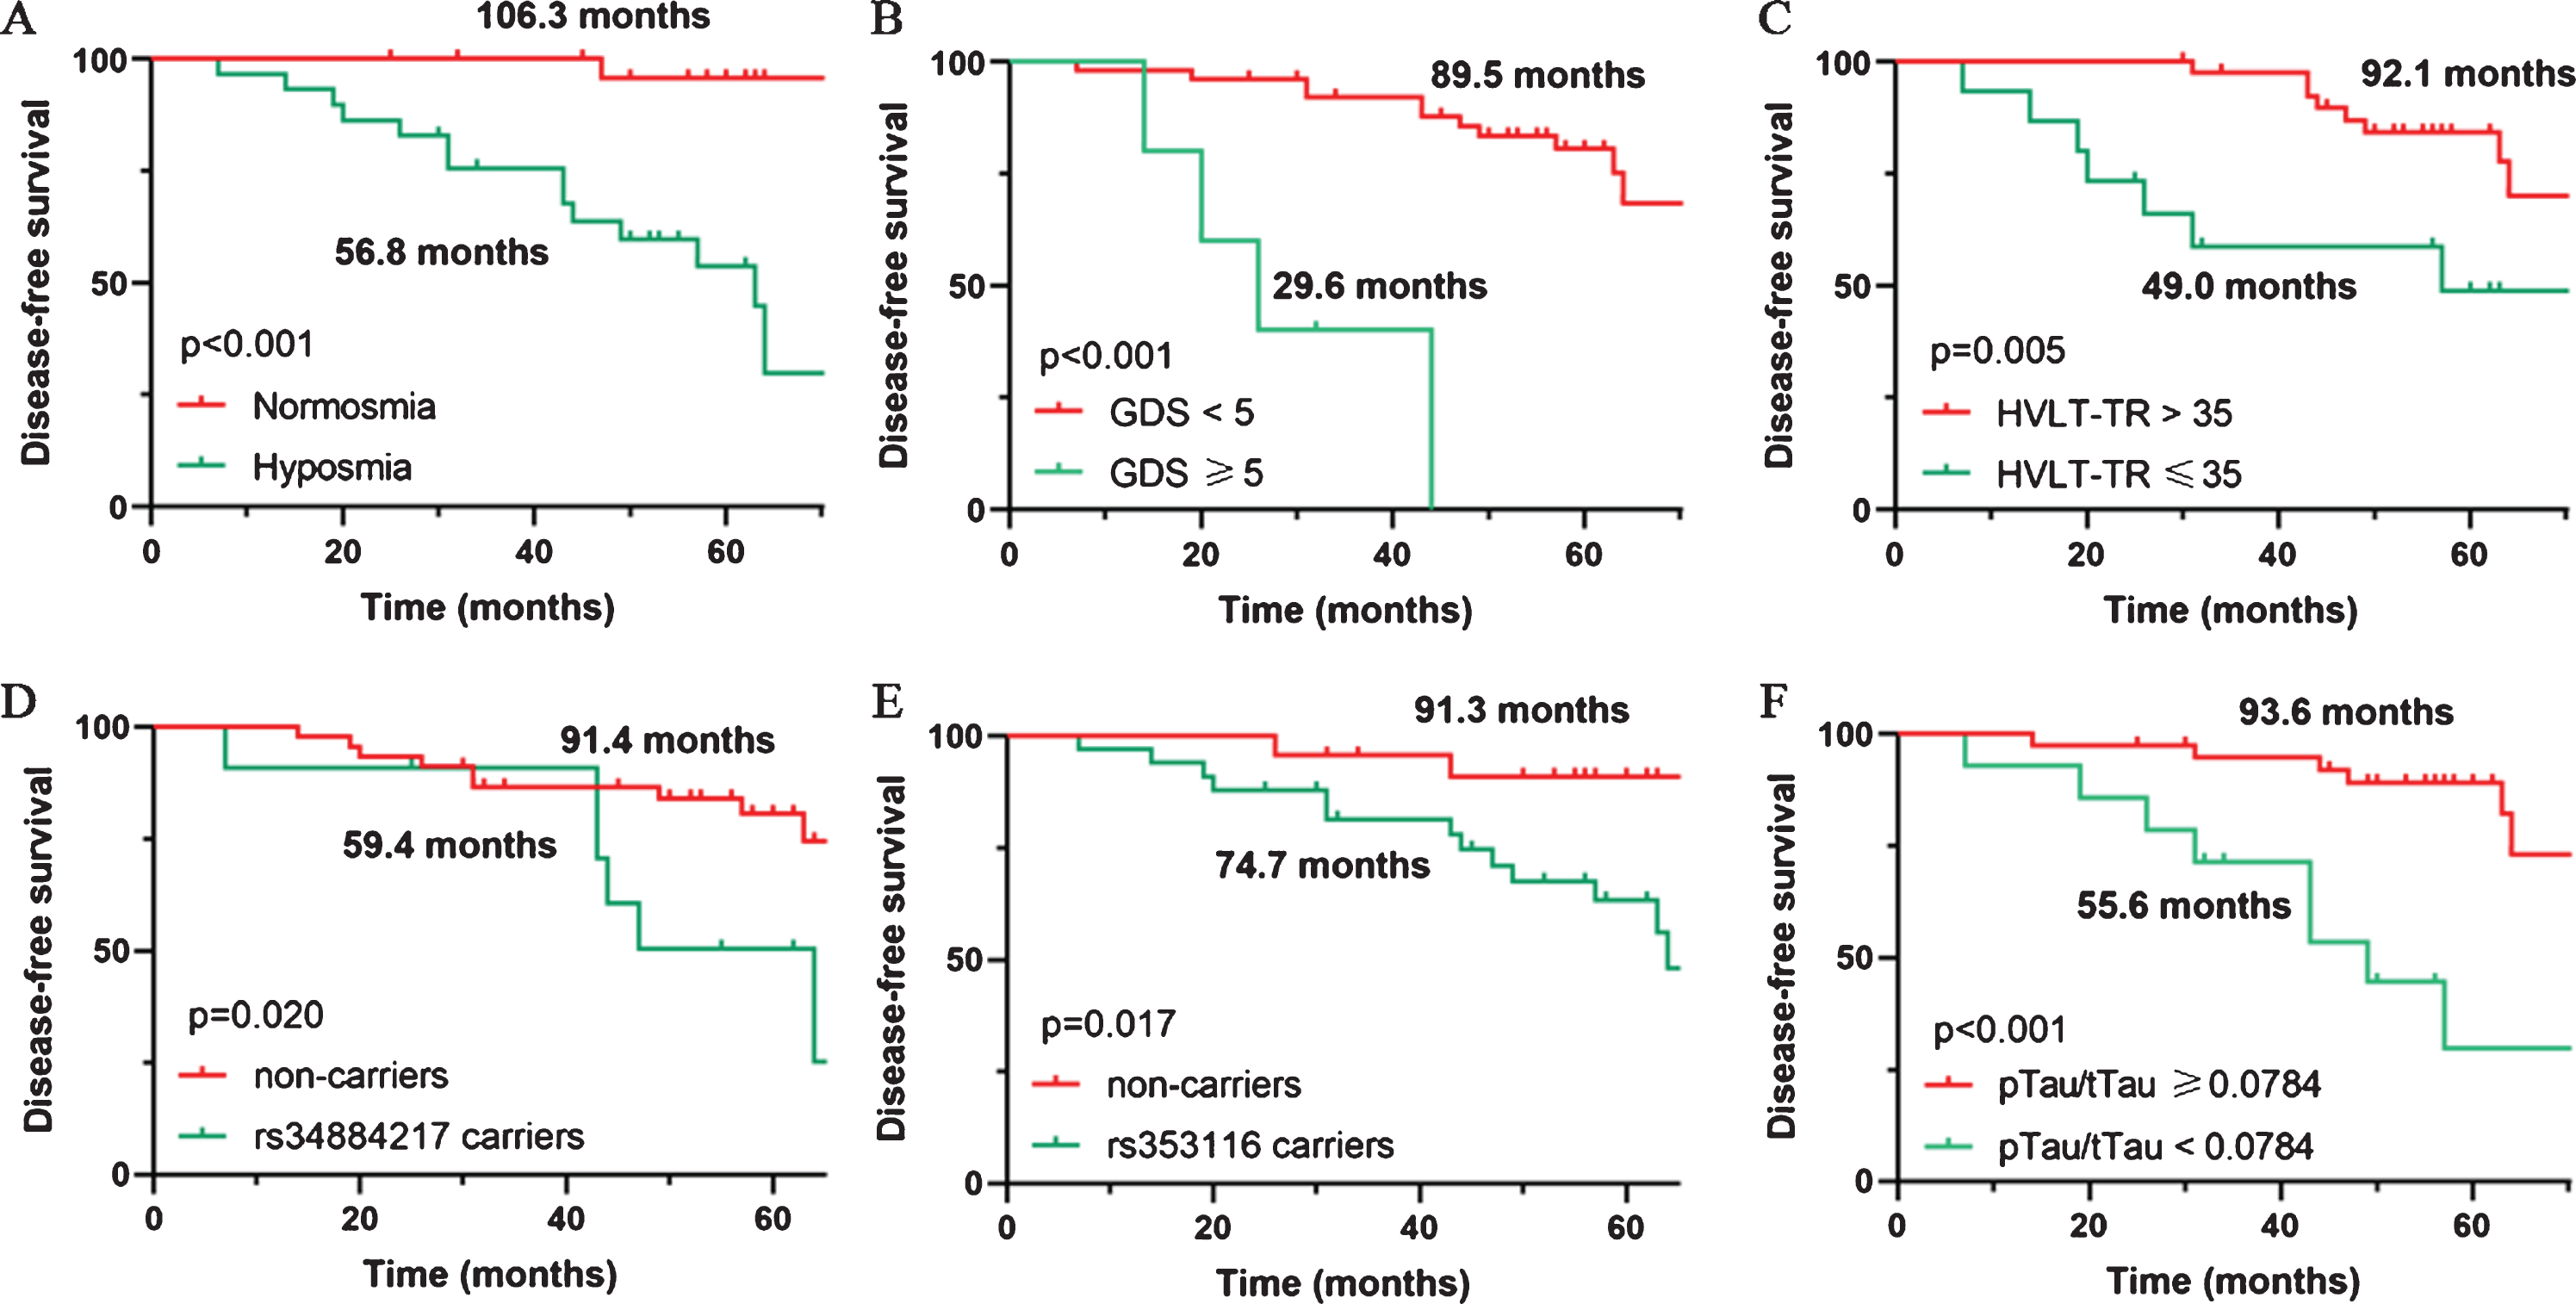
Predictive markers of α-synucleinopathy diseases in iRBD patients. Kaplan-Meier plot of disease-free survival among patients with iRBD, stratified according to (A) presence of olfactory impairment, (B) score of 15-item Geriatric Depression Scale (GDS), (C) score of Hopkins Verbal Learning Test - Total Recall (HVLT-TR), (D) TMEM175 rs34884217 variant carriers, (E) SCN3A rs353116 variant carriers, and (F) p-tau/t-tau ratio in cerebrospinal fluid (CSF).
Potential genotype and CSF biomarker risks for disease conversion
Due to the role of genotype in disease conversion, a total of 72 PD-associated single nucleotide polymorphism (SNP) variants were analyzed (Supplementary Table 2). Four SNP loci with possible associations with iRBD conversion were found by chi-squared test or Fisher exact test, including TMEM175 (p = 0.051), SCN3A (p = 0.011) as well as NUCKS1 (p = 0.055) when a dominant model was considered, and SREBF1 (p = 0.026) when a recessive model was considered. As shown in Table 3, carriers of the TMEM175 rs34884217 variant had a higher risk of developing α-synucleinopathy diseases (HR = 3.74, 95% CI 1.27–11.00, p = 0.017), and Kaplan-Meier analysis revealed a shorter mean PFS time compared with that of noncarriers (91.4 months vs 59.4 months, p = 0.020, Fig. 2D). Similarly, carriers of the SCN3A rs353116 variant were more likely to develop α-synucleinopathy diseases (HR = 5.81, 95% CI 1.29–26.18, p = 0.022), and exhibited a shorter PFS time than noncarriers (74.7 months vs 91.3 months, p = 0.017, Fig. 2E). However, NUCKS1 rs823118 appeared to have a protective role, and carriers of NUCKS1 rs823118 variant were less likely to develop α-synucleinopathy diseases (HR = 0.342, 95% CI 0.118–0.995, p = 0.049).
Potential predictive biomarkers for α-synucleinopathy phenoconversion in iRBD
Continuous variables are presented as mean±standard deviation (SD). Hazard ratios (HRs) are with Cox proportional hazards, adjusting for age, sex and PSG confirmation, with 95% confidence intervals in parentheses. p values < 0.05 are highlighted in bold text. Aβ, amyloid-β 1–42; GMV, gray matter volume; IFG, inferior frontal gyrus; p-tau, phosphorylated tau; t-tau, total tau.
Furthermore, some indicators in CSF were also measured to study their role in conversion prediction. Baseline CSF data were missing for Aβ in 1 patient. 3 patients with p-tau levels below detection limit (<8 pg/mL) and 1 patient with t-tau level below detection limit (<80 pg/mL) were excluded from the final analysis. As shown in Table 3, patients with a lower p-tau/t-tau ratio (HR = 8.36, 95% CI 2.30–30.33, p = 0.001) had a higher risk of developing α-synucleinopathy diseases. Analogously, patients with a lower p-tau/t-tau ratio (<0.0784) exhibited shorter PFS times than the remaining patients (55.6 months vs 93.6 months, p < 0.001, Fig. 2F). However, no significant differences in CSF α-synuclein, Aβ levels, p-tau or t-tau levels were observed.
VBM analysis for disease conversion
Finally, structural MRI of the brain was investigated, and whole-brain VBM analysis was performed. The results showed that iRBD patients who eventually developed α-synucleinopathy diseases had significant GM atrophy at baseline (uncorrected p < 0.001, cluster size > 50 voxels, Fig. 3A), which was mainly located in the inferior frontal gyrus (IFG) (Supplementary Table 3). ROI-based post hoc analyses were further performed. Cox regression reveled a higher risk of developing α-synucleinopathy diseases in patients with GM atrophy in IFG (HR = 15.49, 95% CI 3.15–76.23, p = 0.001). In addition, Kaplan-Meier analysis also revealed a significantly shorter mean PFS time in patients with lower gray mater volume (GMV) in the IFG (53.2 months vs 93.5 months, p < 0.001, Fig. 3B).
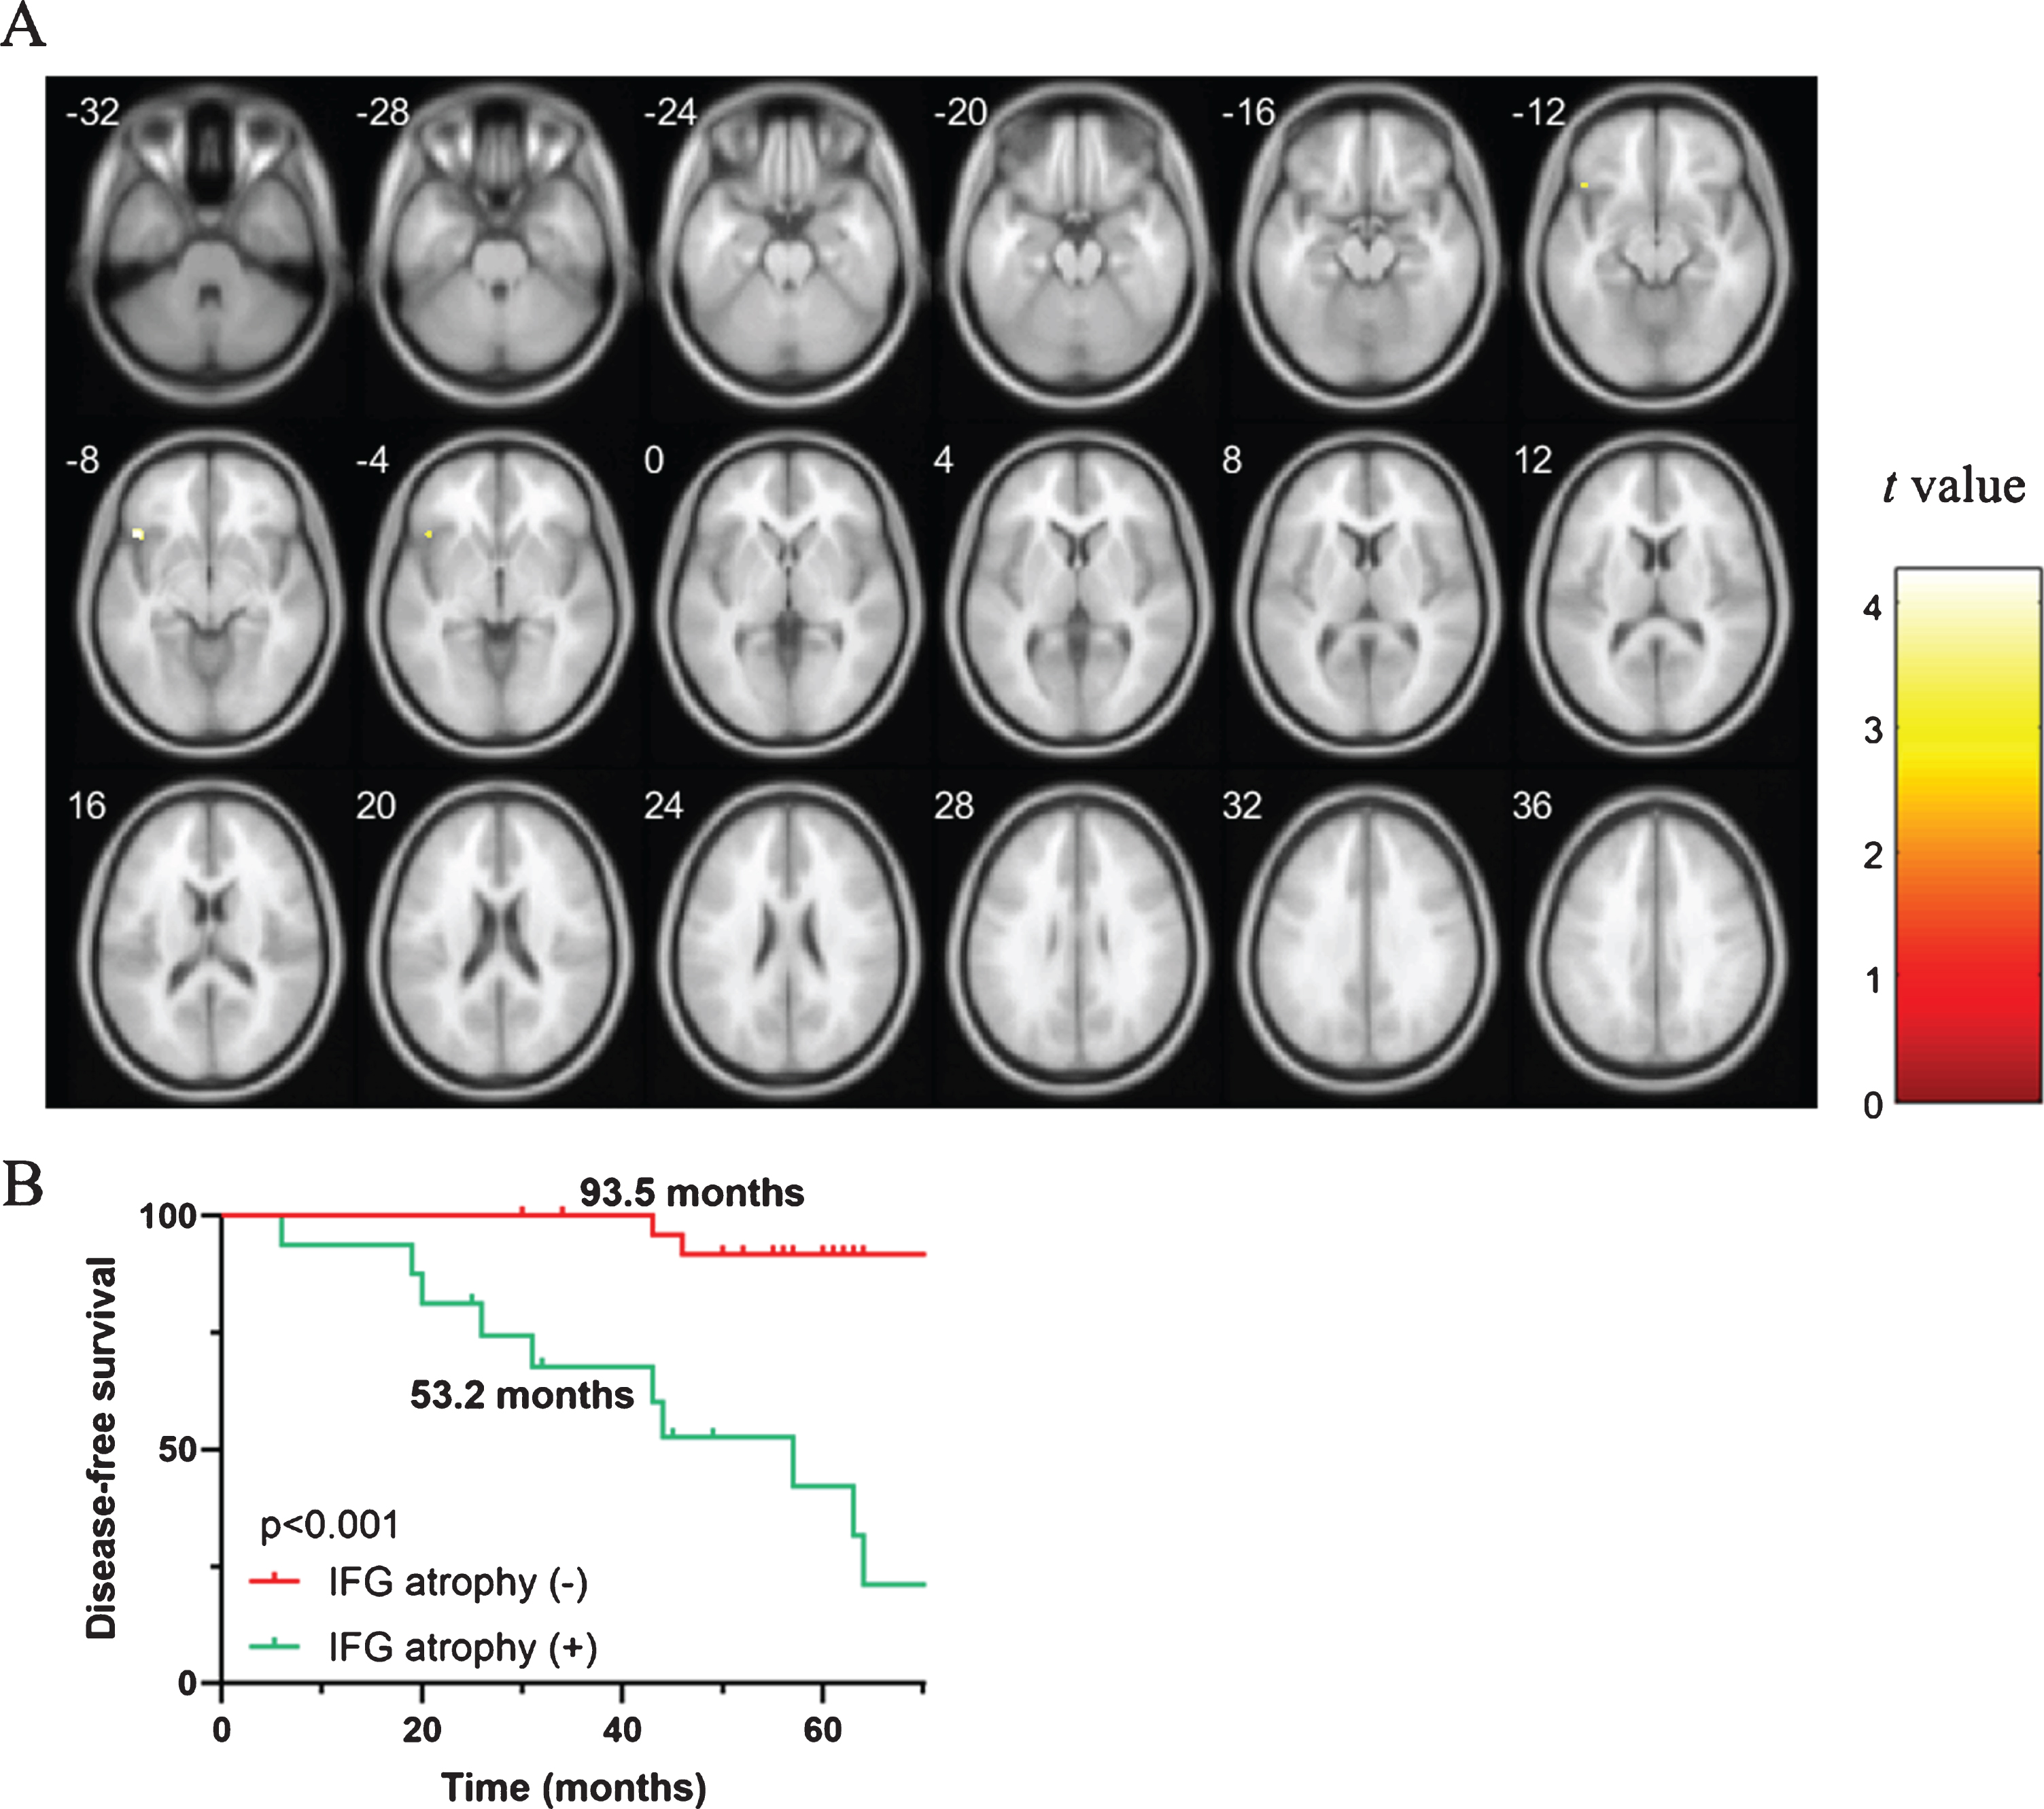
Gray matter atrophy as a predictor of phenoconversion. A) Brain areas showing significant gray matter atrophy in α-synucleinopathy disease converters compared with nonconverters (p < 0.001), as shown by VBM analysis. B) Kaplan-Meier plot of disease-free survival among patients with iRBD, stratified according to gray matter atrophy in the inferior frontal gyrus (IFG). Ticks indicate censoring events.
Predictive value of the combined variables for disease conversion
Since many aforementioned risk factors could be involved in the phenoconversion of iRBD, the stepwise forward logistic regression model was used to explore the best combination of variables for disease conversion prediction. A model combined UPSIT, TMEM175 and GM atrophy in IFG exhibited the best significantly improved predictive performance, with an AUC of 0.928 (95% CI 0.833–1.000, p < 0.001; Supplementary Figure 1). A shorter PFS time of 47.5 months was also observed in high-risk patients compared with 95.6 months in the remaining patients (p < 0.001, Fig. 4).
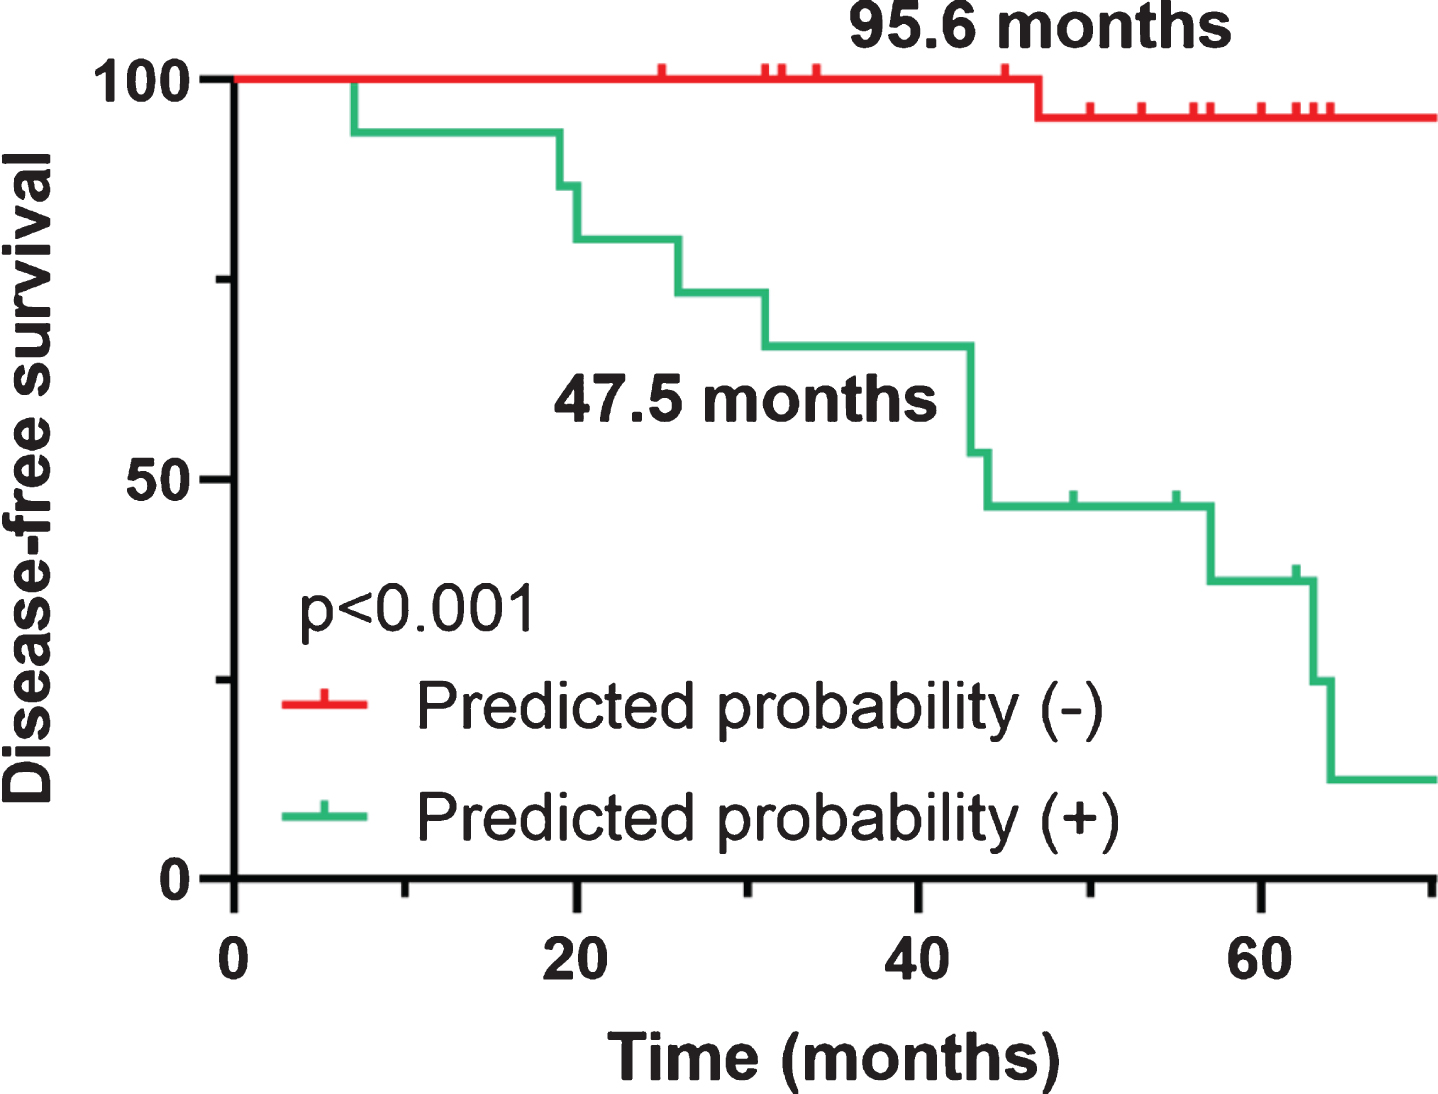
Kaplan-Meier plot of disease-free survival among patients with iRBD, stratified according to the combined predictive model. Ticks indicate censoring events.
DISCUSSION
In this longitudinal study of conversion from iRBD to α-synucleinopathies, we found an overall phenoconversion rate of 6.1% per year, with a majority (12 out of 15) developing PD. Several clinical predictors for conversion were identified, including olfactory impairment, depression, RBDSQ score and cognitive decline. In addition, the p.Q65P TMEM175 variant (rs34884217), SCN3A rs353116 variant and a lower CSF p-tau/t-tau ratio were associated with an increased risk for conversion. Moreover, regarding the neuroimaging markers, GM atrophy in IFG revealed by VBM analysis also showed predictive value for phenoconversion.
As shown by a recent meta-analysis [27], 31.95% of iRBD patients developed a neurodegenerative disease after a mean follow-up of 4.75±2.43 years. In this study, we found a similar phenoconversion rate, although with a smaller proportion of individuals developing dementia. One possible explanation is that patients with abnormal cognitive scale results were initially excluded at enrollment. Age, sex, and years in formal education did not contribute to the prediction of conversion, in line with previous reports.
Considering that iRBD patients frequently exhibit nonmotor symptoms observed in patients with PD [28], it is not surprising that some of the factors associated with phenoconversion were olfactory impairment, depression and cognitive decline. Hyposmia is an early and sensitive marker of the preclinical phase of both PD and dementia [29–32]. Deterioration of the sense of smell might indicate early involvement of the olfactory bulb in both disorders, as suggested by the Braak staging system [33, 34]. Here, we reported a hazard ratio of 26.18 for olfactory impairment, which is higher than some previous estimates [3, 9] and might be the result of a bias caused by the small sample size. Furthermore, we observed a higher risk of developing α-synucleinopathies in patients with impaired verbal memory, measured by a lower HVLT total recall score. Several studies have investigated neuropsychological features in iRBD subjects as a predictive marker of neurodegeneration. However, the potential impaired cognitive domain varies across samples. Some have suggested impaired attention and executive function as predictors of conversion, specifically for DLB [35–37], while some have found selective impairment in memory and visuospatial abilities in iRBD patients [38–40]. The inconsistency in the results can be explained by differences in cognitive tasks across studies and different proportions of outcomes (e.g., PD, DLB, MSA, and those who remained disease-free). Autonomic impairment is highly prevalent in iRBD patients [41, 42]. The most common symptoms reported are gastrointestinal, cardiovascular and urinary impairments [4, 41]. The severity of autonomic disturbances is often evaluated by the SCOPA-AUT questionnaire, and patients with iRBD with higher SCOPA-AUT scores were reported to develop α-synucleinopathies faster [4]. In this study, patients with higher SCOPA-AUT scores, especially in gastrointestinal and cardiovascular domain, were also more likely to develop α-synucleinopathies in our cohort; however, this finding was not statistically significant, which may be due to the small sample size.
Genotype has been proposed as a factor contributing to iRBD, as a previous study observed increased odds of presumed iRBD among siblings and parents of confirmed iRBD patients [10]. Recently, Krohn et al. revealed that a certain SNCA variant (rs10005233) was associated with iRBD [43]. Moreover, GBA mutations were found to have the potential to accelerate the conversion of iRBD to defined α-synucleinopathy [44]. Here, we reported that patients who carried the p.Q65P TMEM175 variant had a significantly accelerated phenoconversion from iRBD to α-synucleinopathy disease. The TMEM175/GAK/DGKQ locus has been identified as one of the strongest risk loci in genome-wide association studies (GWAS) of PD [45, 46]. A recently published study suggested that the TMEM175 p.M393T variant was associated with increased risk for both PD and iRBD, while the TMEM175 p.Q65P variant was associated with a decreased risk for PD but not for iRBD [47]. In this study, we did not observe a significant association between the p.M393T variant and phenoconversion; however, the p.Q65P variant appeared to be a risk factor for phenoconversion. Possible reasons for this slight discrepancy may include the following: 1) a limited sample size with 15 converted iRBD patients was used for the genotyping analysis, especially considering that the p.Q65P variant is uncommon; and 2) the 2 studies focused on different disease stages. Phenoconversion from iRBD to neurodegenerative disease and sporadic iRBD might have different underlying mechanisms. Note that the protective role of the p.Q65P variant was observed in only 1 out of 3 centers [47]. We did not perform the adjustment for multiple comparison since sample size was small. Considering that an overall of 72 SNP were tested, it is possible that some of the results are due to chance. Further studies with larger cohorts are required.
CSF biomarkers in PD patients with or without RBD have already been analyzed; however, they have often shown controversial results [48]. Here, we did not observe a significant association between CSF α-synuclein levels and phenoconversion. Seeing that CSF α-synuclein levels did not correlate with the RBD questionnaire score and that both total α-synuclein and oligomeric/total ratio did not significantly differ among iRBD and healthy control (HC) groups [13], it is possible that α-synuclein is not a predictive biomarker for phenoconversion. Some studies have reported significantly lower p-tau levels in the PD population than in controls, although p-tau levels were not helpful in predicting early cognitive deterioration of PD patients [22, 49]. We also found that patients with a lower p-tau/t-tau ratio had a higher risk of developing α-synucleinopathy diseases, suggesting that different disease stages may involve different mechanisms.
Here, we found that converted iRBD patients had lower GMV in the IFG. Previous studies have shown abnormal spontaneous brain activity in IFG in PD patients [50]. A meta-analysis involving 17 VBM studies also revealed GM atrophy in the left IFG in PD patients [51]. It is possible that a slight lesion already existed in the relevant brain area in the prodromal stage (iRBD) of α-synucleinopathy disease and might gradually worsen with the course of the disease. Future studies with longitudinal structural and functional MRI analysis are required to further validate these findings.
We established a risk model taking into account the aforementioned clinical variables and biomarkers to increase the predictive accuracy. A model combined UPSIT, TMEM175 and GM atrophy in IFG produced good discrimination and calibration for phenoconversion prediction. To date, many potential biomarkers for iRBD conversion has been found and multiple dimensional models may be helpful for better prediction. Future studies with larger sample size can further explore a better predictive model incorporating more variables.
There are several limitations of our study to note. First, iRBD patients were assessed using a questionnaire (RBDSQ), only a subset of 22 patients underwent PSG and were all confirmed iRBD. To minimize the inaccuracy of diagnosis, a well-established cutoff value with high sensitivity and specificity was chosen. Meanwhile, probable iRBD present at baseline was required to be still present at subsequent visit. To elucidate whether the results were driven by differences between 1) a group of people who had RBD versus 2) those who did not have it, but screened positive, subgroup analysis was performed (Supplementary Tables 4 and 5). In this study, 46.7% of the phenoconvertors and 36.6% of the non-phenoconvertors had PSG confirmation. The conversion rate was 31.8% among PSG-confirmed iRBD patients compared with 23.5% among probable iRBD patients who did not have PSG. There was no significant difference between the above-mentioned proportions as revealed by chi-square test (p = 0.494). Moreover, when ‘PSG confirmation’ was added as an adjusted covariate in Cox regression, all significant predictors remained and the variations caused by PSG confirmation did not influence the results. However, future studies with PSG-proven iRBD patients are required to further validate the abovementioned findings. In addition, few patients in this study underwent a DAT-SPECT scan. Since an association between decreased DAT tracer uptake and increased risk of developing α-synucleinopathies in iRBD patients has been observed [4], future studies may consider adding DaTscan parameters into the combined model. Second, the sample size of this study was limited, and T1-weighted MRI scans were performed only in the majority of patients at baseline. Third, the primary outcome was based on clinical diagnoses without pathologic confirmation.
In conclusion, we found several clinical variables and indicators that can predict α-synucleinopathy diseases in patients with iRBD. As new disease-modifying treatments are being developed, strategies to identify individuals at high risk of developing α-synucleinopathy diseases might be useful to prevent or slow the progression of α-synucleinopathy diseases in iRBD patients.
CONFLICT OF INTEREST
The authors have no conflict of interest to report.
Footnotes
ACKNOWLEDGMENTS
Data used in the preparation of this article were obtained from the Parkinson’s Progression Markers Initiative (PPMI) database (![]() ). For up-to-date information on the study, visit www.ppmi-info.org. PPMI—a public–private partnership—is funded by the Michael J. Fox Foundation for Parkinson’s Research and funding partners, including AbbVie, Avid, Biogen, Bristol-Myers Squibb, Covance, GE Healthcare, Genentech, GlaxoSmithKline, Lundbeck, Eli Lilly, Merck, MesoScaleDiscovery, Pfizer, Piramal, Roche, Sanofi Genzyme, Servier, TEVA, and UCB.
). For up-to-date information on the study, visit www.ppmi-info.org. PPMI—a public–private partnership—is funded by the Michael J. Fox Foundation for Parkinson’s Research and funding partners, including AbbVie, Avid, Biogen, Bristol-Myers Squibb, Covance, GE Healthcare, Genentech, GlaxoSmithKline, Lundbeck, Eli Lilly, Merck, MesoScaleDiscovery, Pfizer, Piramal, Roche, Sanofi Genzyme, Servier, TEVA, and UCB.