
Abstract
Background:
Bradykinesia is the defining motor feature of Parkinson’s disease (PD). There are limitations to its assessment using standard clinical rating scales, especially in the early stages of PD when a floor effect may be observed.
Objective:
To develop a quantitative method to track repetitive tapping movements and to compare people in the early stages of PD, healthy controls, and individuals with idiopathic anosmia.
Methods:
This was a cross-sectional study of 99 participants (early-stage PD = 26, controls = 64, idiopathic anosmia = 9). For each participant, repetitive finger tapping was recorded over 20 seconds using a smartphone at 240 frames per second. From each video, amplitude between fingers, frequency (number of taps per second), and velocity (distance travelled per second) was extracted. Clinical assessment was based on the motor section of the MDS-UPDRS.
Results:
People in the early stage of PD performed the task with slower velocity (p < 0.001) and with greater frequency slope than controls (p = 0.003). The combination of reduced velocity and greater frequency slope obtained the best accuracy to separate early-stage PD from controls based on metric thresholds alone (AUC = 0.88). Individuals with anosmia exhibited slower velocity (p = 0.001) and smaller amplitude (p < 0.001) compared with controls.
Conclusion:
We present a simple, proof-of-concept method to detect early motor dysfunction in PD. Mean tap velocity appeared to be the best parameter to differentiate patients with PD from controls. Patients with anosmia also showed detectable differences in motor performance compared with controls which may suggest that some were in the prodromal phase of PD.
INTRODUCTION
The diagnosis of Parkinson’s disease (PD) depends on the detection of bradykinesia [1–4], but in the early stages of disease this may not be easy to see. Bradykinesia is defined as slow velocity of movement but is often seen in combination with other movement abnormalities. These include hypokinesia (reduced amplitude), akinesia (slow initiation contributing to changes in sequence rhythm) and decrement, otherwise known as “sequence effect”, where there is progressive reduction in the velocity or amplitude with repeated movements. These movement irregularities can be detected in gait, arm swing, facial expression and handwriting. Many of the common rating scales for PD assess these features in isolation, and others in combination [5, 6].
Bradykinesia is elicited clinically by sequential finger or foot tapping and can be scored using the motor section of the Movement Disorders Society-Unified Parkinson’s Disease Rating Scale (MDS-UPDRS-III) [7]. For diagnosis, assessment of the whole clinical picture is necessary and reliance should not be placed exclusively on finger and foot tapping [8]. While the MDS-UPDRS-III is a useful research scale, the integers prevent adequate detection of subtle motor changes. In particular, bradykinesia-related sub-scores have imperfect interrater reliability [9]. Part of this variability may be due to the mixed definition of bradykinesia used by the MDS-UPDRS-III, assigning equal weighting to speed, amplitude, and rhythm with no provision to sub-classify them further. This is of particular relevance to the stage of PD close to diagnosis (based on motor criteria), where current questionnaires and scales may be insufficiently sensitive to detect change, reflecting the need for more accurate and specific measures to detect subtle motor dysfunction [10].
Attempts to develop quantitative measurements of bradykinesia that would be useful in clinical practice began fifty years ago, but many devices are too insensitive or cumbersome for routine clinical use [11]. Wearable sensors have shown promise [12] but although these offer the potential of 24-hour monitoring, there are limitations such as lack of context to movement, interference with the natural range of movement and cost. There is also a lack of consensus about which derived metrics are best to assess the subtle motor changes in early stage disease [13]. This study aims to provide proof of concept that motion capture using a smart phone could assess different elements of bradykinesia which may be sensitive to change in early PD.
MATERIALS AND METHODS
This was a cross-sectional, case-control study in which the main aim was to design a test to objectively quantify early patterns of motor dysfunction in PD. Repetitive finger tapping movements were recorded using an ordinary smartphone (iPhone X®) with slow motion video capture. Slow Motion Analysis of Repetitive Tapping (SMART) test results were compared in patients with early PD (less than two years since diagnosis), healthy controls and patients with idiopathic anosmia. Parameters derived from the SMART test were correlated with clinical ratings scored from the gold standard of assessment for PD, the MDS-UPDRS-III [14].
Participants
All the patients with PD fulfilled the UK Queen Square Brain Bank criteria [1]. Exclusion criteria included disease duration (defined as time from diagnosis on motor criteria) of more than two years, and any comorbidities that could interfere with performance of the task, such as arthritis, previous stroke, and dementia. Healthy controls were excluded if they had bradykinesia and scored more than 6 on the MDS-UPDRS-III (a cut off for subthreshold parkinsonism [7]). Cases with PD were recruited from two studies; the East London Parkinson’s disease (ELPD) project based at Barts Health NHS Trust and Quantitative MRI for Anatomical Phenotyping in Parkinson’s disease (QMAP-PD) study based at the Institute of Neurology, University College London. Controls were recruited from the PREDICT-PD study (http://www.predictpd.com) [15] and QMAP-PD study. Patients with anosmia were recruited from the PREDICT-PD study, after referral from specialist ENT clinics, where nasal endoscopy and imaging had revealed no identifiable cause of smell loss. Assessments were carried out between October 2018 and December 2019 and all patients gave informed written consent to the study. Ethics approval was granted by the PREDICT-PD study was approved by Central London Research Committee 3 (reference number 10/H0716/85). The QMAP-PD study has full NHS ethical approval (Fulham Research Ethics Committee, 18/LO/1229).
Assessment
Finger tapping was performed following the same standardised instructions that are used when administering the MDS-UPDRS-III (Supplementary Table 1). Movements were recorded over 20 seconds using a smartphone at 240 frames per second (slow motion capture). In order to facilitate finger recognition by the software, we asked participants to tap their index finger on the thumb ‘as fast and as wide’ as they could while making a fist with the remaining three fingers (Fig. 1). Participants were instructed to not rotate and move the arm during the task with the purpose of capturing the angle at the metacarpal-phalangeal joints between index finger and thumb. Patients were asked to stop taking any dopaminergic medication at least 12 hours before the assessment. In order to compare their performance ‘on’ and ‘off’ medication, they were tested again after taking their regular dopaminergic medication.
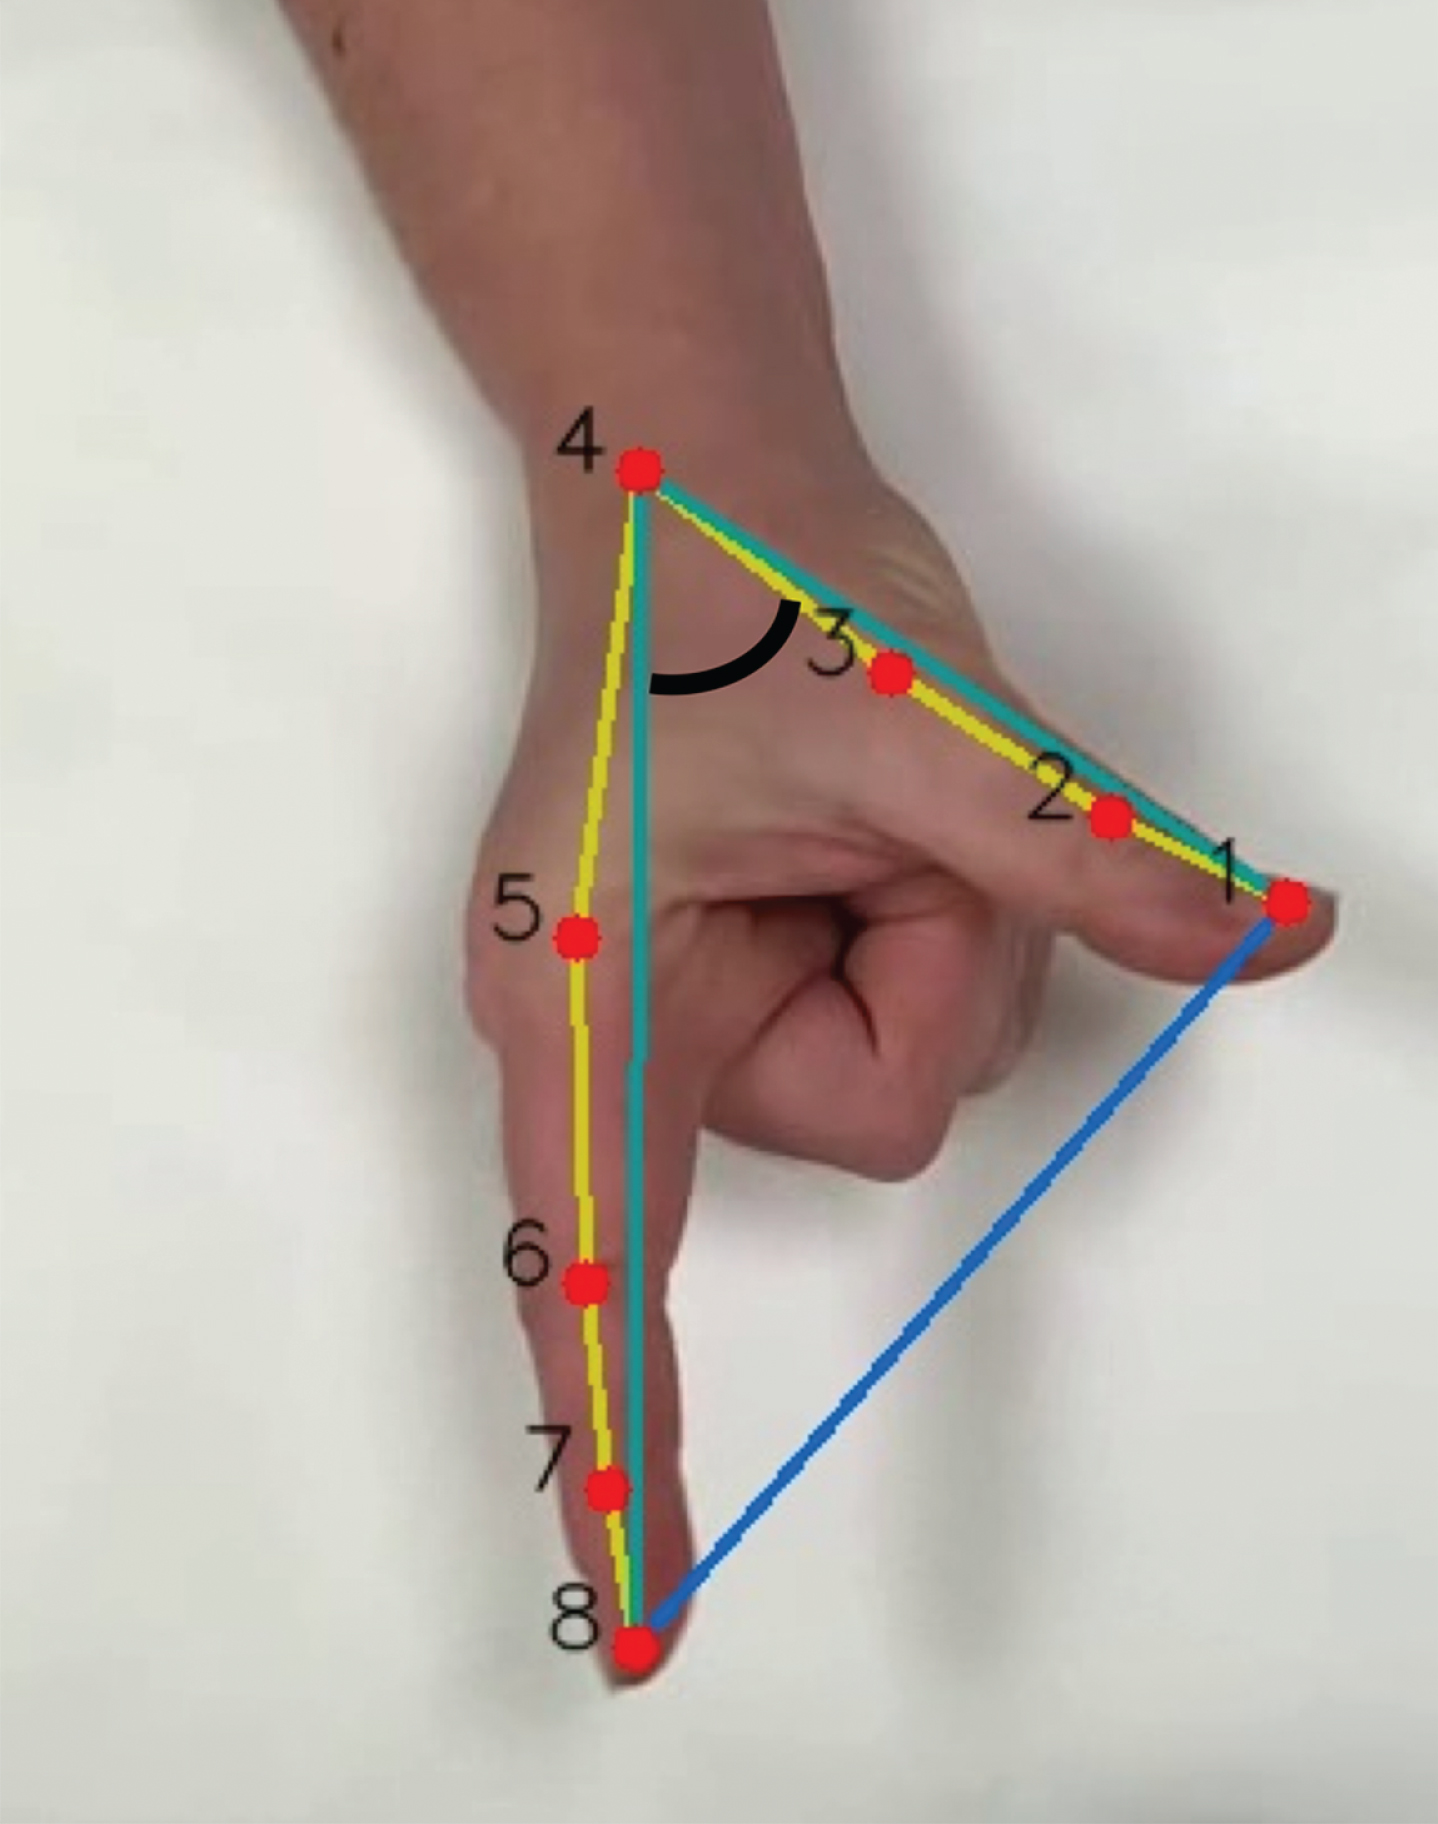
Hand detection: 8 key landmarks across the first and the second finger (red). Angle between 1-4-8 key landmarks (black). Extrapolated amplitude between point 1 and 8 (blue).
Video analysis
We created a convolutional neural network (CNN), which was built using PyTorch 1.6.0 [16], to detect the shape of the hand in the video. This enabled the tracking of movement of the hand during the tapping task. We also built a 2D CNN which was trained to detect 8 key landmarks of the index finger and the thumb which were then tracked over time (Fig. 1). Videos were resized and rotated for standardisation. The ‘pre-processing’ stage was carried out using OpenCV library [17]. Twenty frames were randomly extracted from each video and used as a dataset to train the CNN, making a total of 3934 frames in the initial dataset. The architecture of the CNN was divided into 8 blocks of 2D convolutional layers followed by a batch normalisation, 4 pooling layers and a final 3 fully connected layers, using the ReLU activation function. To measure the accuracy, we computed the deviation as the Euclidean distance between manual and predicted landmarks on the test dataset. We achieved an average deviation of 11.3±8.6 pixels on the final 606 x 1080 images (i.e., an average error of 0.9%).
Once the training was completed, videos were processed using the CNN frame by frame to extract the predicted anatomical landmarks. After the position of the key landmarks had been predicted, the distances between the distal portion of the index finger and the thumb were calculated (Fig. 1). Although normalising the amplitude allowed comparison between samples, the absolute amplitude was needed to calculate the initial and mean amplitude (fully separating the finger from the thumb for one individual is not the same as for another individual), as well as the change in amplitude over time. Moreover, the distance from the hand to the camera could also interfere with the perceived amplitude of finger tapping. To overcome these limitations, the angle formed between the distal part of the index finger and the thumb and the key landmark corresponding to the metacarpal joint was computed (i.e., the angle formed between landmarks 1-4-8 in Fig. 1) to mitigate the need for an external reference to normalise amplitude.
Maximum amplitude peaks were detected for each tap and linear regression models were fitted to those signal peaks. Frequency was measured as the number of taps per second. Velocities were calculated as the change rate of the normalised signal, and a similar process was applied to obtain the peaks of maximum velocities along time. All the signal processing was done using SciPy [18] and NumPy libraries [19].
Statistical analysis
Three kinetic parameters were extracted to be used in the statistical analysis: amplitude (angle formed between index finger and thumb), frequency (number of taps per second) and velocity (distance travelled per second extracted from the derivative of the amplitude). For each parameter, the mean, the coefficient of variation (CV) (standard deviation divided by the mean), and the slope (from regression of time against each parameter) was calculated.
Normality of the data was assessed using the D’Agostino test. Quantitative data was presented as the median and interquartile range (IQR) when non-parametric and the mean and standard deviation (SD) for parametric data. Mann Whitney U tests, t-tests, and Welch’s t-tests (two-tailed) were used to compare test parameters between patients and controls, as appropriate. Linear regression was used to determine whether movement parameters derived from finger tapping (dependent variables) were influenced by age. Logistic regression was performed to examine whether test parameters were associated with binomial factors such as gender and handedness. Receiver operator characteristic (ROC) curves were drawn to find the optimal cut off value with the best combination of sensitivity and specificity for SMART test parameters separately and in combination. Spearman’s correlation coefficient was used to correlate SMART test parameters (continuous) with finger-tapping sub-scores from the MDS-UPDRS-III (ordinal) [20]. Since multiple hypothesis tests were run, one for each component of the test parameters (mean, CV, and slope), a more stringent cut-off for the level of significance (p < 0.005, Bonferroni corrected for nine hypothesis tests) was selected to ensure robustness of results and avoid false positives (i.e., type I error). Data analysis was carried out using STATA V.13 (StataCorp, College Station, TX).
RESULTS
Two hundred and ninety-four videos were analysed (99 recordings for the right and left hand of all participants and recordings of each hand of 24 PD patients during ‘on’ and ‘off’ medication). Associations between SMART test parameters with age, gender and handedness were assessed in control subjects. Neither age, gender, nor handedness overtly affected the test parameters (Supplementary Table 2). Since there was no significant difference in the derived motor metrics between the dominant and non-dominant hands in the control group, the results were mainly focused on the dominant hand in the control and anosmic groups. Even so, we carried out an additional comparison between the non-dominant hand of controls and the PD group. The most affected side in PD was used for comparison since PD is associated with asymmetric onset of motor signs and the patients were all in an early disease stage. The identification of the most affected side was based on the side with the worst finger-tapping sub-score in the MDS-UPDRS-III.
Early PD
Clinical and demographic information
Table 1 summarises the clinical and demographic information of both groups. Twenty-six patients with early PD and 30 controls were included in the first analysis. The other 34 controls were on average much older than the PD patients and were excluded to make both groups more comparable (PD: 59.60 years, SD 10.88 vs Control: 63.81 years, SD 7.21, p = 0.060). Compared with controls, PD cases were more likely to be male (65.38% vs 36.67%, p = 0.030). All patients had a disease duration of less than two years (median 0.75 years, IQR 0.5– 1.2) and were taking levodopa. The median MDS-UPDRS-III score was 20 (IQR 15-26). Most of the patients exhibited abnormal finger-tapping to a slight-mild degree (12 patients scored 1 and 12 patients scored 2 in the MDS-UPDRS-III sub-score). One patient was found to have normal finger-tapping and another one had moderately abnormal finger-tapping performance (score = 3). For sub-score definition see Table 1 in Supplementary material.
Demographic and clinical data
*Finger tapping (FT) sub-score in the MDS-UPDRS-III: 0-normal, 1-slight, 2-mild, 3-moderate, 4-severe. IQR, interquartile range; SD, standard deviation; NA, not applicable. Overall, 64 controls were included. Group (1): 30 out of 64 were extracted to compare with PD. Group (2): overall control group used for comparison with anosmia.
SMART scores
When comparing the most affected side in patients with PD to the dominant side of controls, patients with PD performed repetitive finger tapping with slower mean velocity (PD: 1.20 degrees/s, 95% CI 1.02 to 1.38 vs Control: 1.63 degrees/s, 95% CI 1.44 to 1.81 p < 0.001) but similar mean amplitude to controls with wider confidence intervals (CI) and overlap between both groups (PD: 27.08 degrees, 95% CI 22.49 to 31.67 vs Control: 31.10 degrees, 95% CI 26.91 to 35.28, p = 0.189). There was some evidence that patients with PD displayed greater variability in frequency (CV frequency) (PD: 0.18, 95% CI 0.13 to 0.22 vs Control: 0.11, 95% CI 0.08 to 0.14, p = 0.007) and more so in velocity (CV velocity) compared with controls (PD: 0.31, 95% CI 0.27 to 0.34 vs Control: 0.20, 95% CI 0.15 to 0.25 p < 0.001). There was also more evident decrement (slope) of frequency in patients than controls (PD: -0.02, 95% CI – 0.03 to 0.01 vs Control: – 0.002, 95% CI – 0.01 to 0.007, p = 0.003) (Table 2).
Test parameter comparison and ROC analysis between PD and controls
The dominant hand from controls and the most affected side from PD cases was used for comparison. All parameters presented with 95% coefficient interval (CI). CV, coefficient variation; Amplitude, degrees; Frequency, taps/s; Velocity, degrees/s; p, Welch’s t-tests (two-tailed) except for frequency were Two-sample Wilcoxon rank-sum (Mann-Whitney) test was used.
An additional comparison between the non-dominant hand in controls and the most affected side in the PD group was carried out. Again, the mean velocity parameter was found to show the greatest difference between groups (PD: 1.20 degrees/s, 95% CI 1.02 to 1.38 vs Control: 1.56 degrees/s, 95% 1.30 to 1.67, p = 0.004). Mean amplitude in PD cases did not differ from controls, with wider CI (PD: 27.08 degrees, 95% CI 22.49 to 31.67 vs Control: 29.72 degrees, 95% CI 25.77 to 33.66, p = 0.375). CV velocity was found to be higher in PD cases than controls (PD: 0.31, 95% CI 0.27 to 0.34 vs Control: 0.21, 95% CI 0.17 to 0.25 p < 0.001). However, in contrast to the results with dominant hand, CV frequency and slope frequency were similar between the non-dominant hand of controls and the PD group (all p-values > 0.005 as our pre-established cut-off). When looking at the distribution between non-dominant and dominant hand of controls, CV frequency and slope frequency had wider ranges in the non-dominant hand which might be explained different degrees of hand dominance amongst controls (Supplementary Figure 1).
Action tremor was visible in eleven patients. To prevent over estimation of an inflated frequency parameter caused by tremor, when two consecutive peaks of amplitude were found without reaching the baseline amplitude of 0 (meaning that both fingers were close together), it was interpreted as a finger tremor instead of a finger tap. The highest peak was selected to avoid under estimation of the amplitude. In some patients a re-emergent action tremor was seen with the tremor occurring after a finite period (latency) from the time the patient started the finger tapping task (illustrated in Fig. 2).
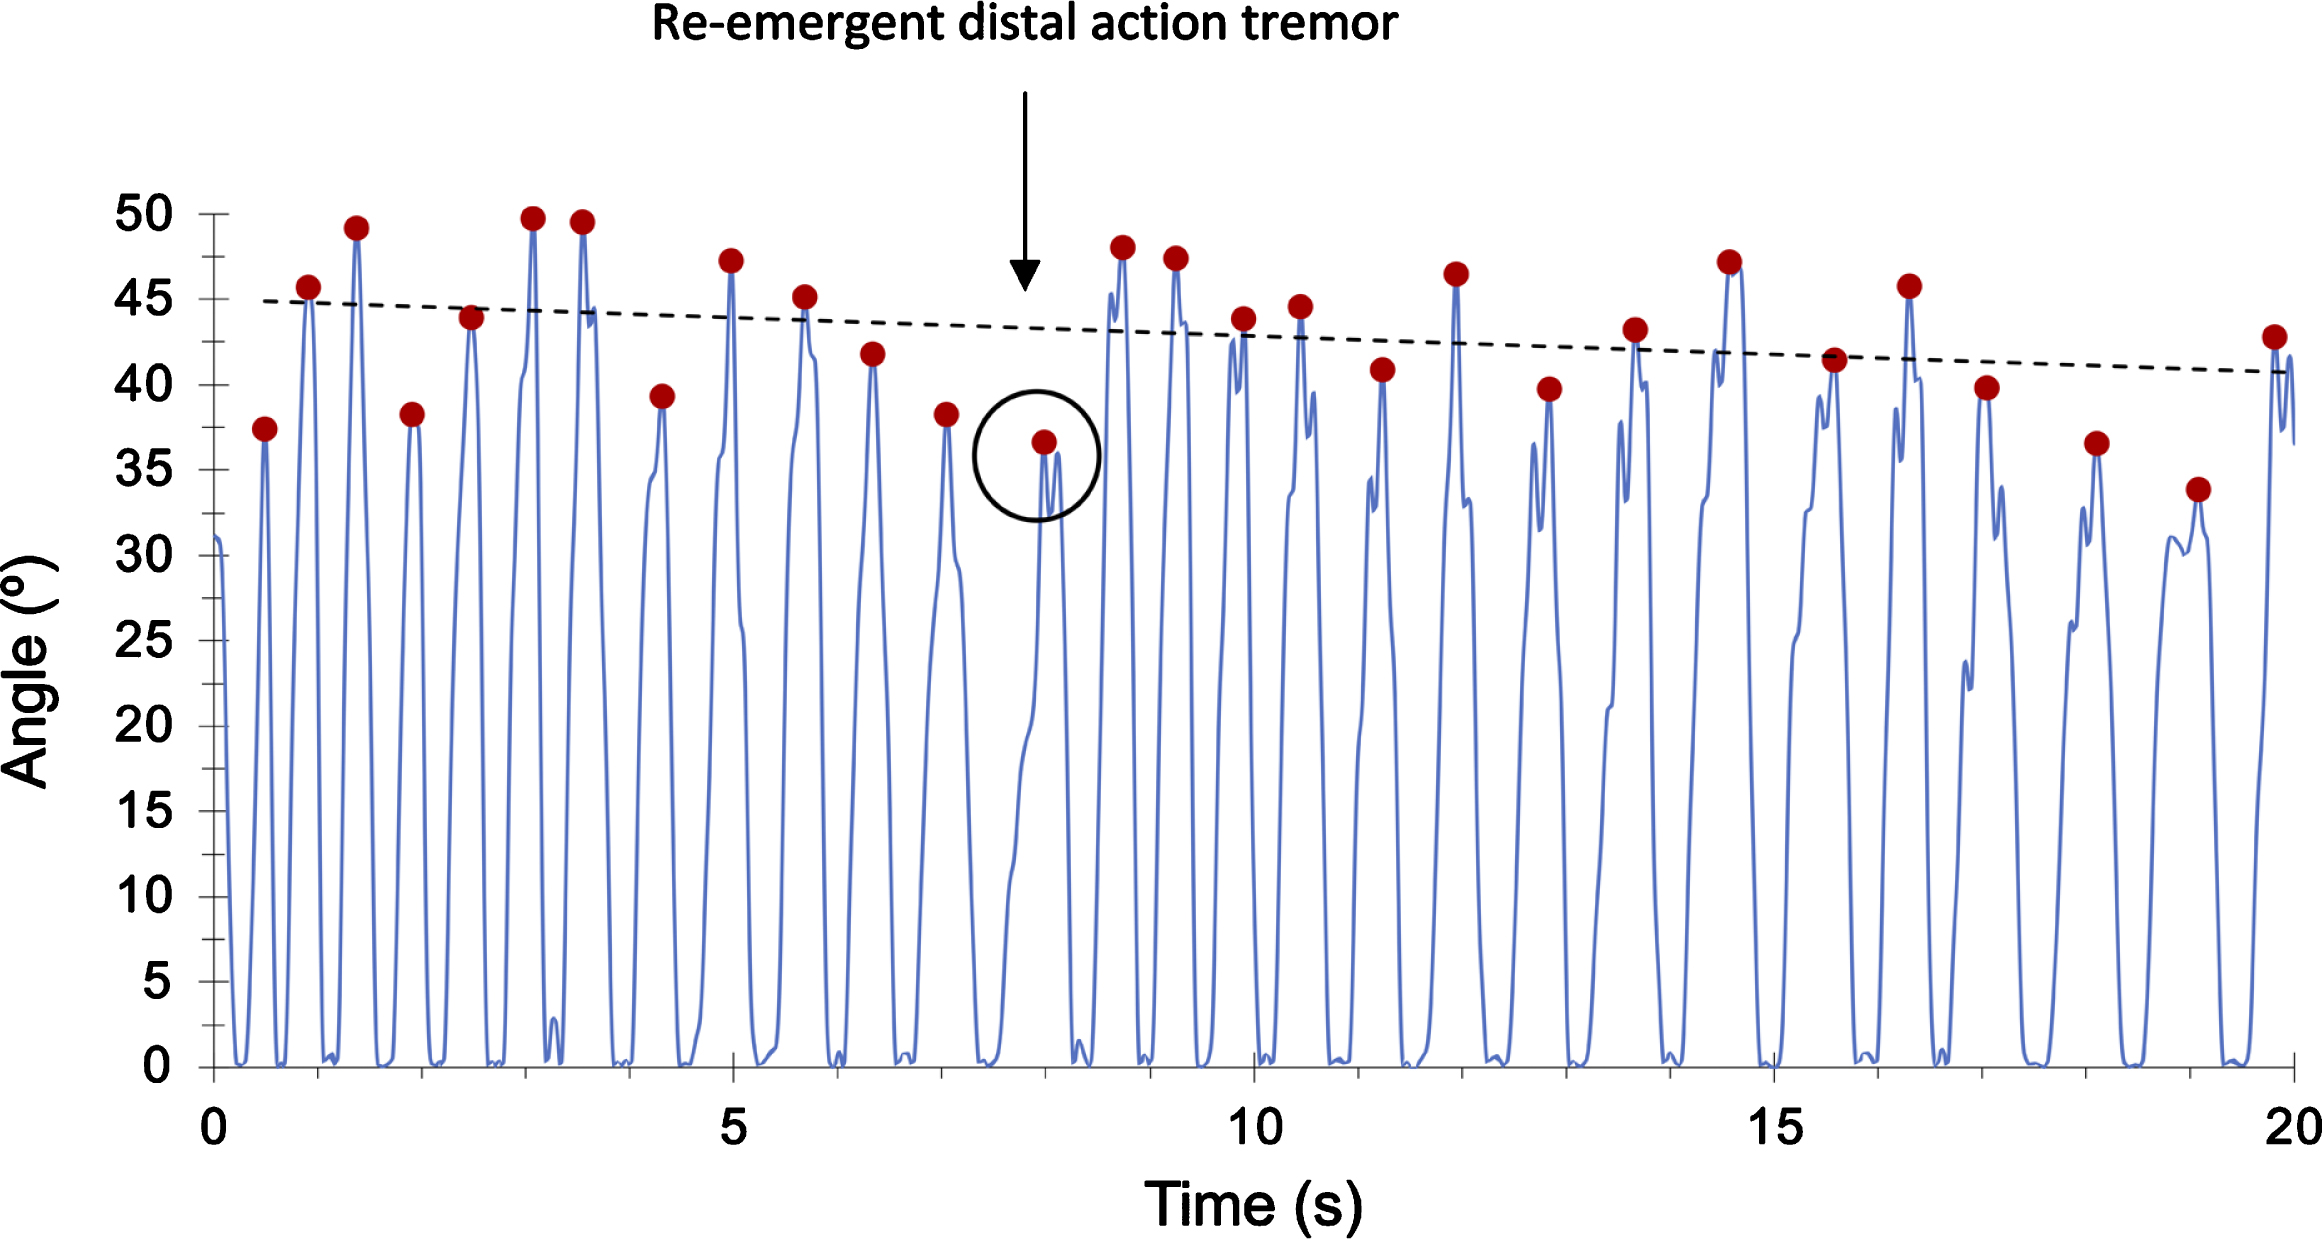
PD case with index finger action tremor appearing after 8 seconds of latency (re-emergence phenomena). Only the highest peak of amplitude is selected.
Diagnostic accuracy
When using the dominant hand of controls for comparison, velocity offered the best discriminatory power with 84.62% sensitivity for 73.33% specificity and an AUC of 0.81 (95% CI 0.69 to 0.93). The CV of frequency also showed reasonable discrimination with 80.77% sensitivity for 70% specificity and an AUC of 0.75 (95% CI 0.62 to 0.88). Combining both parameters (velocity mean and the CV of frequency) meant that the specificity improved to 86.67% for the same sensitivity (AUC 0.83; 95% CI 0.72 to 0.95). The slope of frequency was able to distinguish between groups with a moderate accuracy (AUC 0.72; 95% CI 0.59 to 0.86), but when it was combined with velocity the discriminatory power improved, yielding a sensitivity of 80.77% for 83.33% specificity (AUC 0.88, 95% CI 0.78 to 0.97). In the same way, when the slope of frequency was combined with CV velocity, both parameters also reached a high accuracy (AUC 0.85; 95% CI 0.74 to 0.95) with 80.77% sensitivity for 85% specificity (Table 3 and Fig. 3).
ROC analysis between PD and control group
The dominant hand from controls and the most affected side from PD cases was used for the ROC analysis. AUC, area under the curve for the ROC (Receiver operating characteristic) analysis.
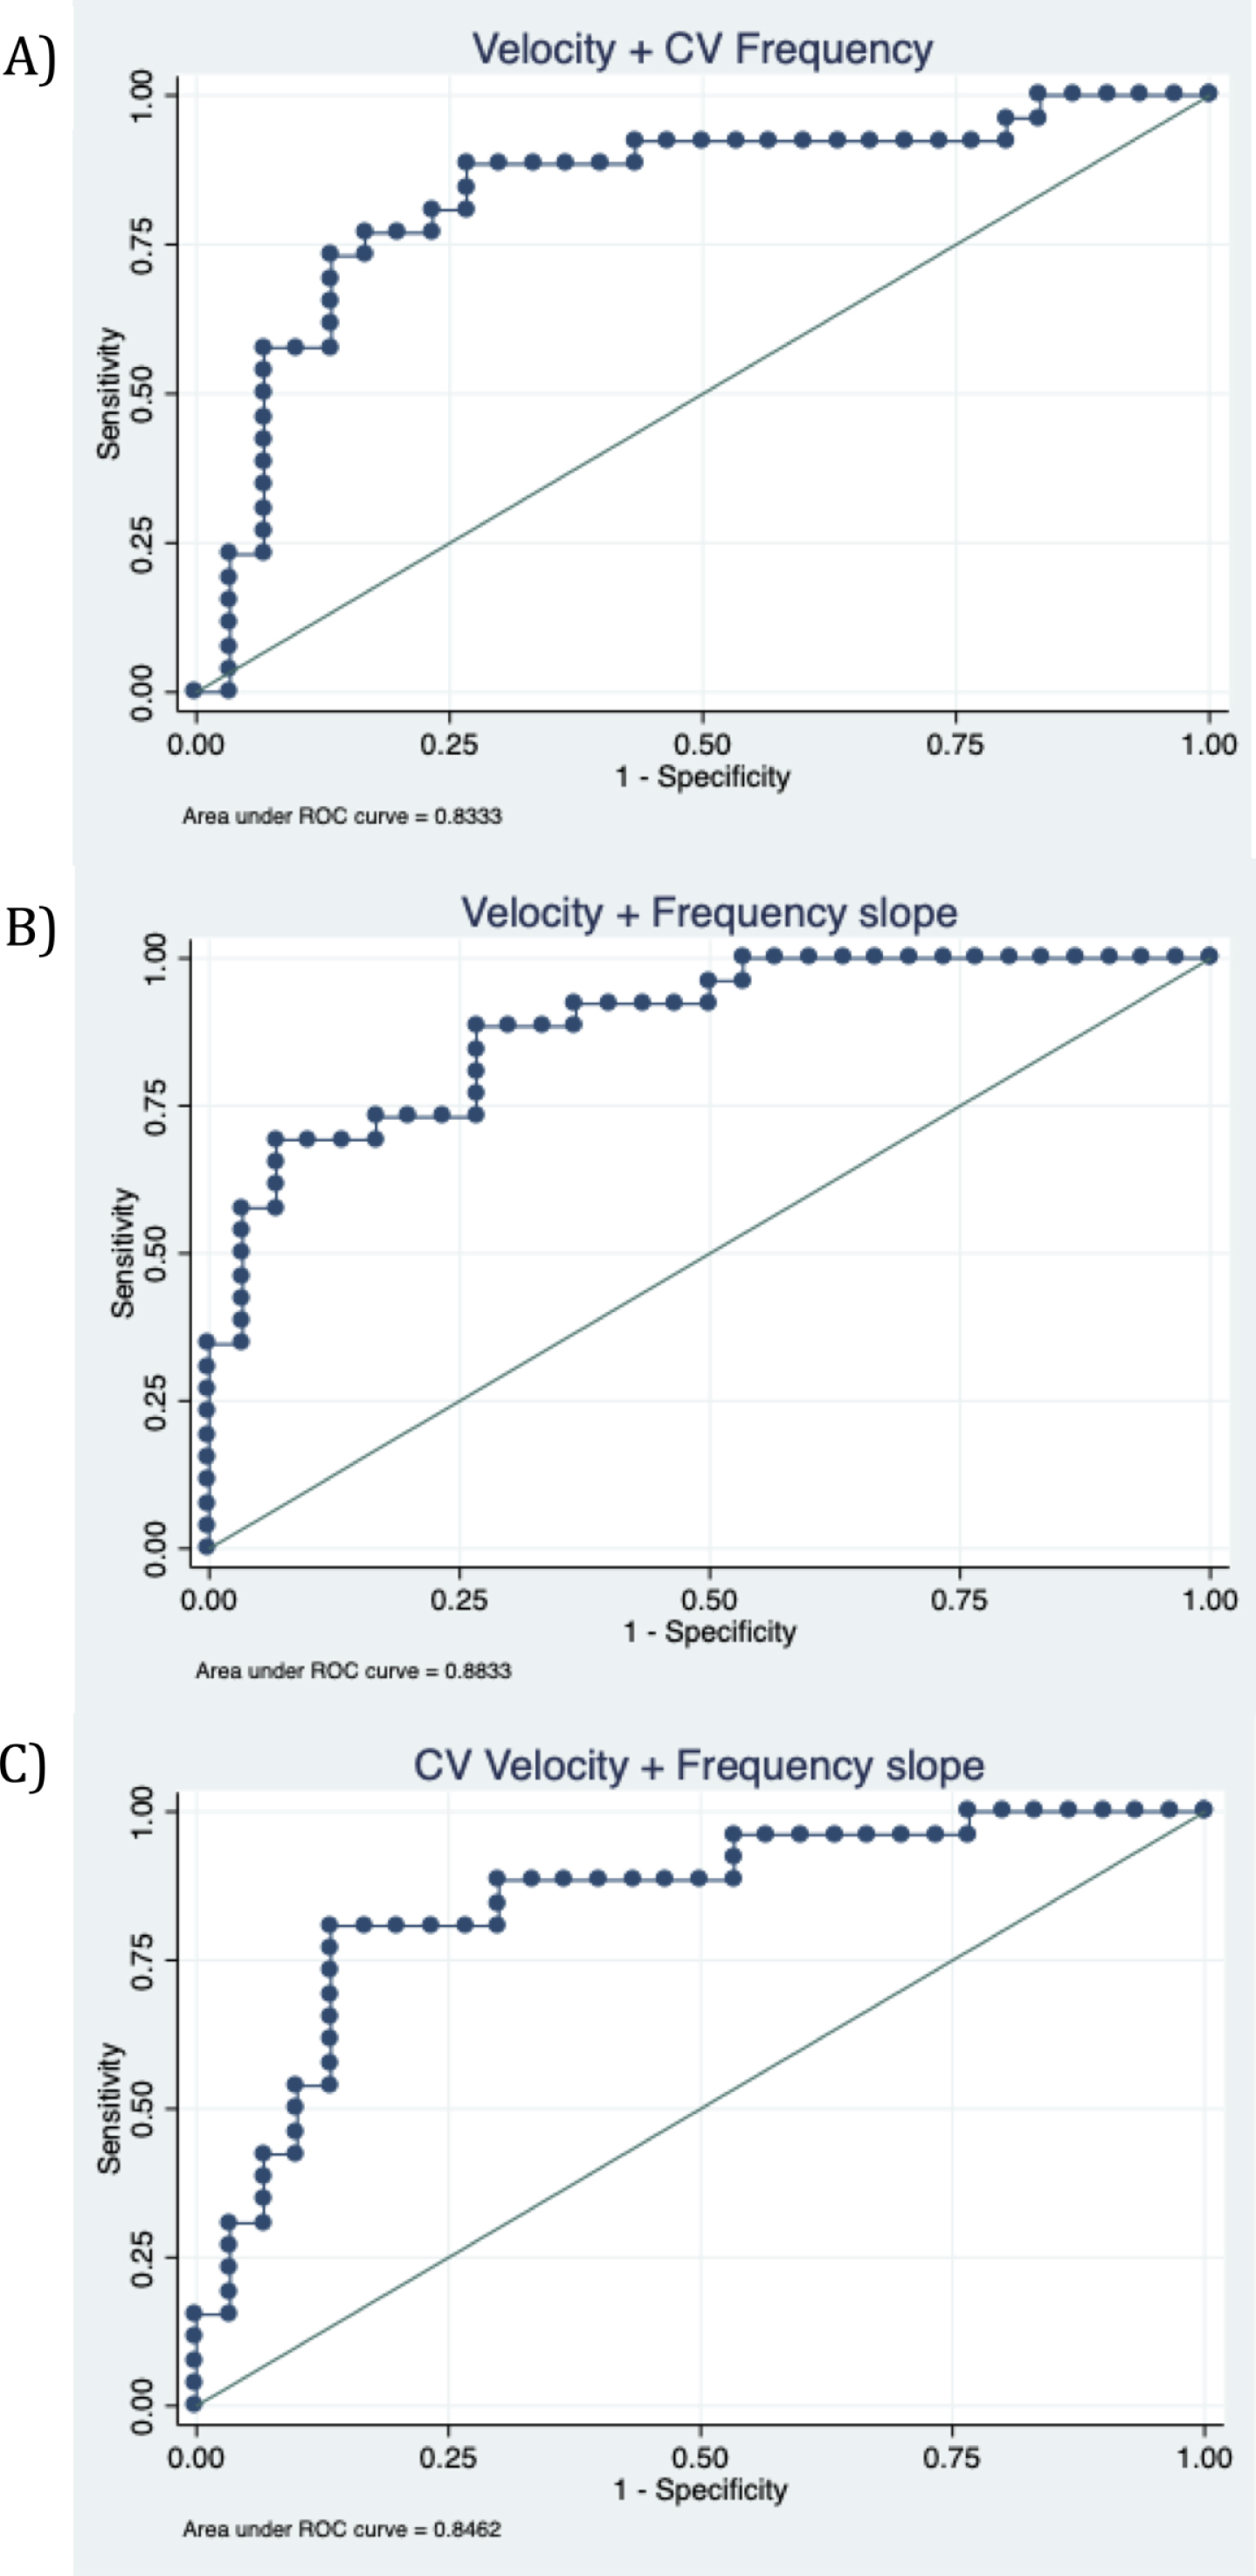
Receiver operator characteristic (ROC) curves for the best parameter combination to distinguish patients with PD and controls. A) Velocity and CV frequency (AUC 0.83; 95% CI 0.72 to 0.95), B) Velocity and frequency slope (AUC 0.88, 95% CI 0.78 to 0 0.97), C) CV velocity and frequency slope (AUC 0.85; 95% CI 0.74 to 0.95).
Clinical correlation
Correlations between the three SMART test parameters and finger tapping sub-scores of the MDS-UPDRS-III were examined in patients with PD (for sub-scores definition, see Supplementary Table 1). All PD patients except two scored between 1 (slight degree) and 2 (mild degree) in the MDS-UPDRS-III sub-score. In order to avoid the two patients scoring 0 (normal degree) and 3 (moderate degree) influencing the correlation curves (Supplementary Figure 1), they were excluded from the main correlation analysis. Thus, the mean amplitude was found to have the highest correlation with finger tapping score (r = – 0.49, p = 0.003) followed by velocity (r = – 0.43, p = 0.016), whereas there was no correlation with mean frequency. For more detailed information about the correlations explored, see Supplementary Table 3 and Supplementary Figure 2.
‘On’ and ‘off’ medication
For 24 of the patients with PD, it was possible to assess them both ‘on’ and ‘off’ dopaminergic medication. All participants except one experienced a worsening in their MDS-UPDRS-III total score with a median of 25% increase in scores from ‘on’ to ‘off’ medication. In contrast, medication did not change MDS-UPDRS finger tapping sub-score in more than a half of patients (62.50%). Seven patients with PD experienced a worsening in their FT score (from 0 -normal- to 1 -slight-) and, in 2 patients, their score improved by 1 point. From SMART recordings, no significant differences were found in any of the parameters (amplitude, frequency, and velocity) when doing a within PD group comparison between the right hand of PD group in their ‘on-medication’ state against their ‘off-medication’ state. The same comparison was done for the left hand with again no differences found. Comparing only those who showed a worsening in their FT sub-scores (n = 7) did not make any difference, with SMART parameters still being on average similar between ‘on’ and ‘off’ medication state.
Idiopathic anosmia group
Clinical and demographic information
Patients with idiopathic anosmia were older on average than patients with PD, with similar mean age to the control group (Anosmia: 70.94 years SD 8.17 vs Control: 69.19 years SD 7.68, p = 0.581) and were therefore compared with the full number of controls. Mean duration since diagnosis of anosmia was 5.25 years (SD 4.65 years). Nine patients with idiopathic anosmia and 64 controls were included in this analysis. There was a higher proportion of males in the anosmia group compared to controls (Anosmia: 77.78% males vs Control: 40.62% male, p = 0.040). The median motor score on the MDS-UPDRS-III was 1 (IQR = 1–3) and no patients met the diagnostic criteria for PD. However, one individual, who scored 10 on the MDS-UPDRS-III, was classified as having sub-threshold parkinsonism based on MDS Task Force criteria (cut off > 6 excluding action tremor) [7]. The remaining patients with anosmia scored between 0 and 4 in the total MDS-UPDRS-III. Finger-tapping sub-scores in the MDS-UPDRS-III were normal (score = 0) except for two individuals who exhibited slight bradykinesia (score = 1) and one who was scored as having mild bradykinesia (score = 2). Table 1 summarises the clinical and demographic information of both groups.
SMART scores
Although FT sub-scores were normal in the majority of anosmic individuals (7 out of 9), the SMART test detected motor impairment in finger-tapping performance compared with the control group. The pattern of movement in participants with anosmia shared similarities with PD patients. Individuals with anosmia performed the task with a reduced mean amplitude; despite broad ranges there was no overlap between groups (Anosmia: 13.94 degrees, 95% CI 9.19 to 18.69 vs Control: 29.38 degrees, 95% CI 26.87 to 31.89 p < 0.001) (Table 4). Compared with controls, the anosmia group showed a slower mean velocity (Anosmia: 0.96 degrees/s, 95% CI 0.64 to 1.27 vs Control: 1.48 degrees/s, 95% CI 1.37 to 1.60 p < 0.001). Although mean frequency was similar between anosmia and controls, there was weak evidence that individuals with anosmia exhibited slightly greater decrement over time compared with controls (p = 0.059). In contrast to PD, CV of velocity was similar between groups (p = 0.054).
We then compared the anosmic group to the unaffected side of patients with unilateral PD (n = 13). Both groups were comparable in terms of the CV of amplitude, the CV of frequency, and the CV of velocity, together with the mean of frequency (all p-values > 0.05). However, they differed in terms of the mean of amplitude (Anosmia: 13.95 degrees, 95% CI 9.18 to 18.69 vs unaffected-side PD: 36.18 degrees, 95% CI 27.89 to 44.36, p < 0.001) and mean velocity (Anosmia: 0.96 degrees/s, 95% CI 0.64 to 1.27 vs unaffected-side PD: 1.89 degrees/s, 95% CI 1.46 to 2.32, p < 0.001). Of note, the anosmic group were significantly older than the PD group with unilateral signs (Anosmia: 70.94 years SD 8.17 vs PD: 59.60 years, SD 10.88, p = 0.004).
Test parameter comparison between patients with anosmia and controls
All parameters presented with 95% coefficient interval (CI). CV, coefficient variation; AUC, area under the curve; ROC, receiver operating characteristic; p, Welch’s t-tests (two-tailed).
DISCUSSION
The main aim of the study was the proof of concept that subtle abnormalities in finger tapping in PD which might be difficult to pick up with the ‘naked eye’, may be detectable through slow-motion video capture. It is important to note that the SMART test was not designed to be used as a diagnostic tool in isolation. PD diagnosis is too complex to be diagnosed with a unique simple test.
We found that patients with PD had slower finger tapping in line with the etymological definition of bradykinesia (‘slowness of movement’). In addition, we found there was significantly greater decrement in frequency of finger tapping. However, we did not find any difference in either mean amplitude or decrement (slope) in amplitude using the SMART test. Slowing, interruptions and reduced amplitude of finger tapping are all aspects typically seen in PD and evaluated in the finger tapping component of the MDS-UPDRS-III. Other studies using electronic measures have yielded similar results [21]. One explanation for the failure of these measurements to capture reduction in amplitude might be that change in amplitude in PD cases does not follow a linear trend over time. This was seen in many of the plots extracted from time series of PD cases showing a non-linear trend with a ‘burst’ phenomenon: repetitive cycles of slowing down and becoming smaller followed by a late amplitude increase. In fact, this last augmentation could compensate for the decrement and the average of amplitude over the 20-second task (see PD case example B in Fig. 4). This rebound pattern could have a proprioceptive origin, suggesting that it might be an early feature before grinding down to a complete halt in more established PD.
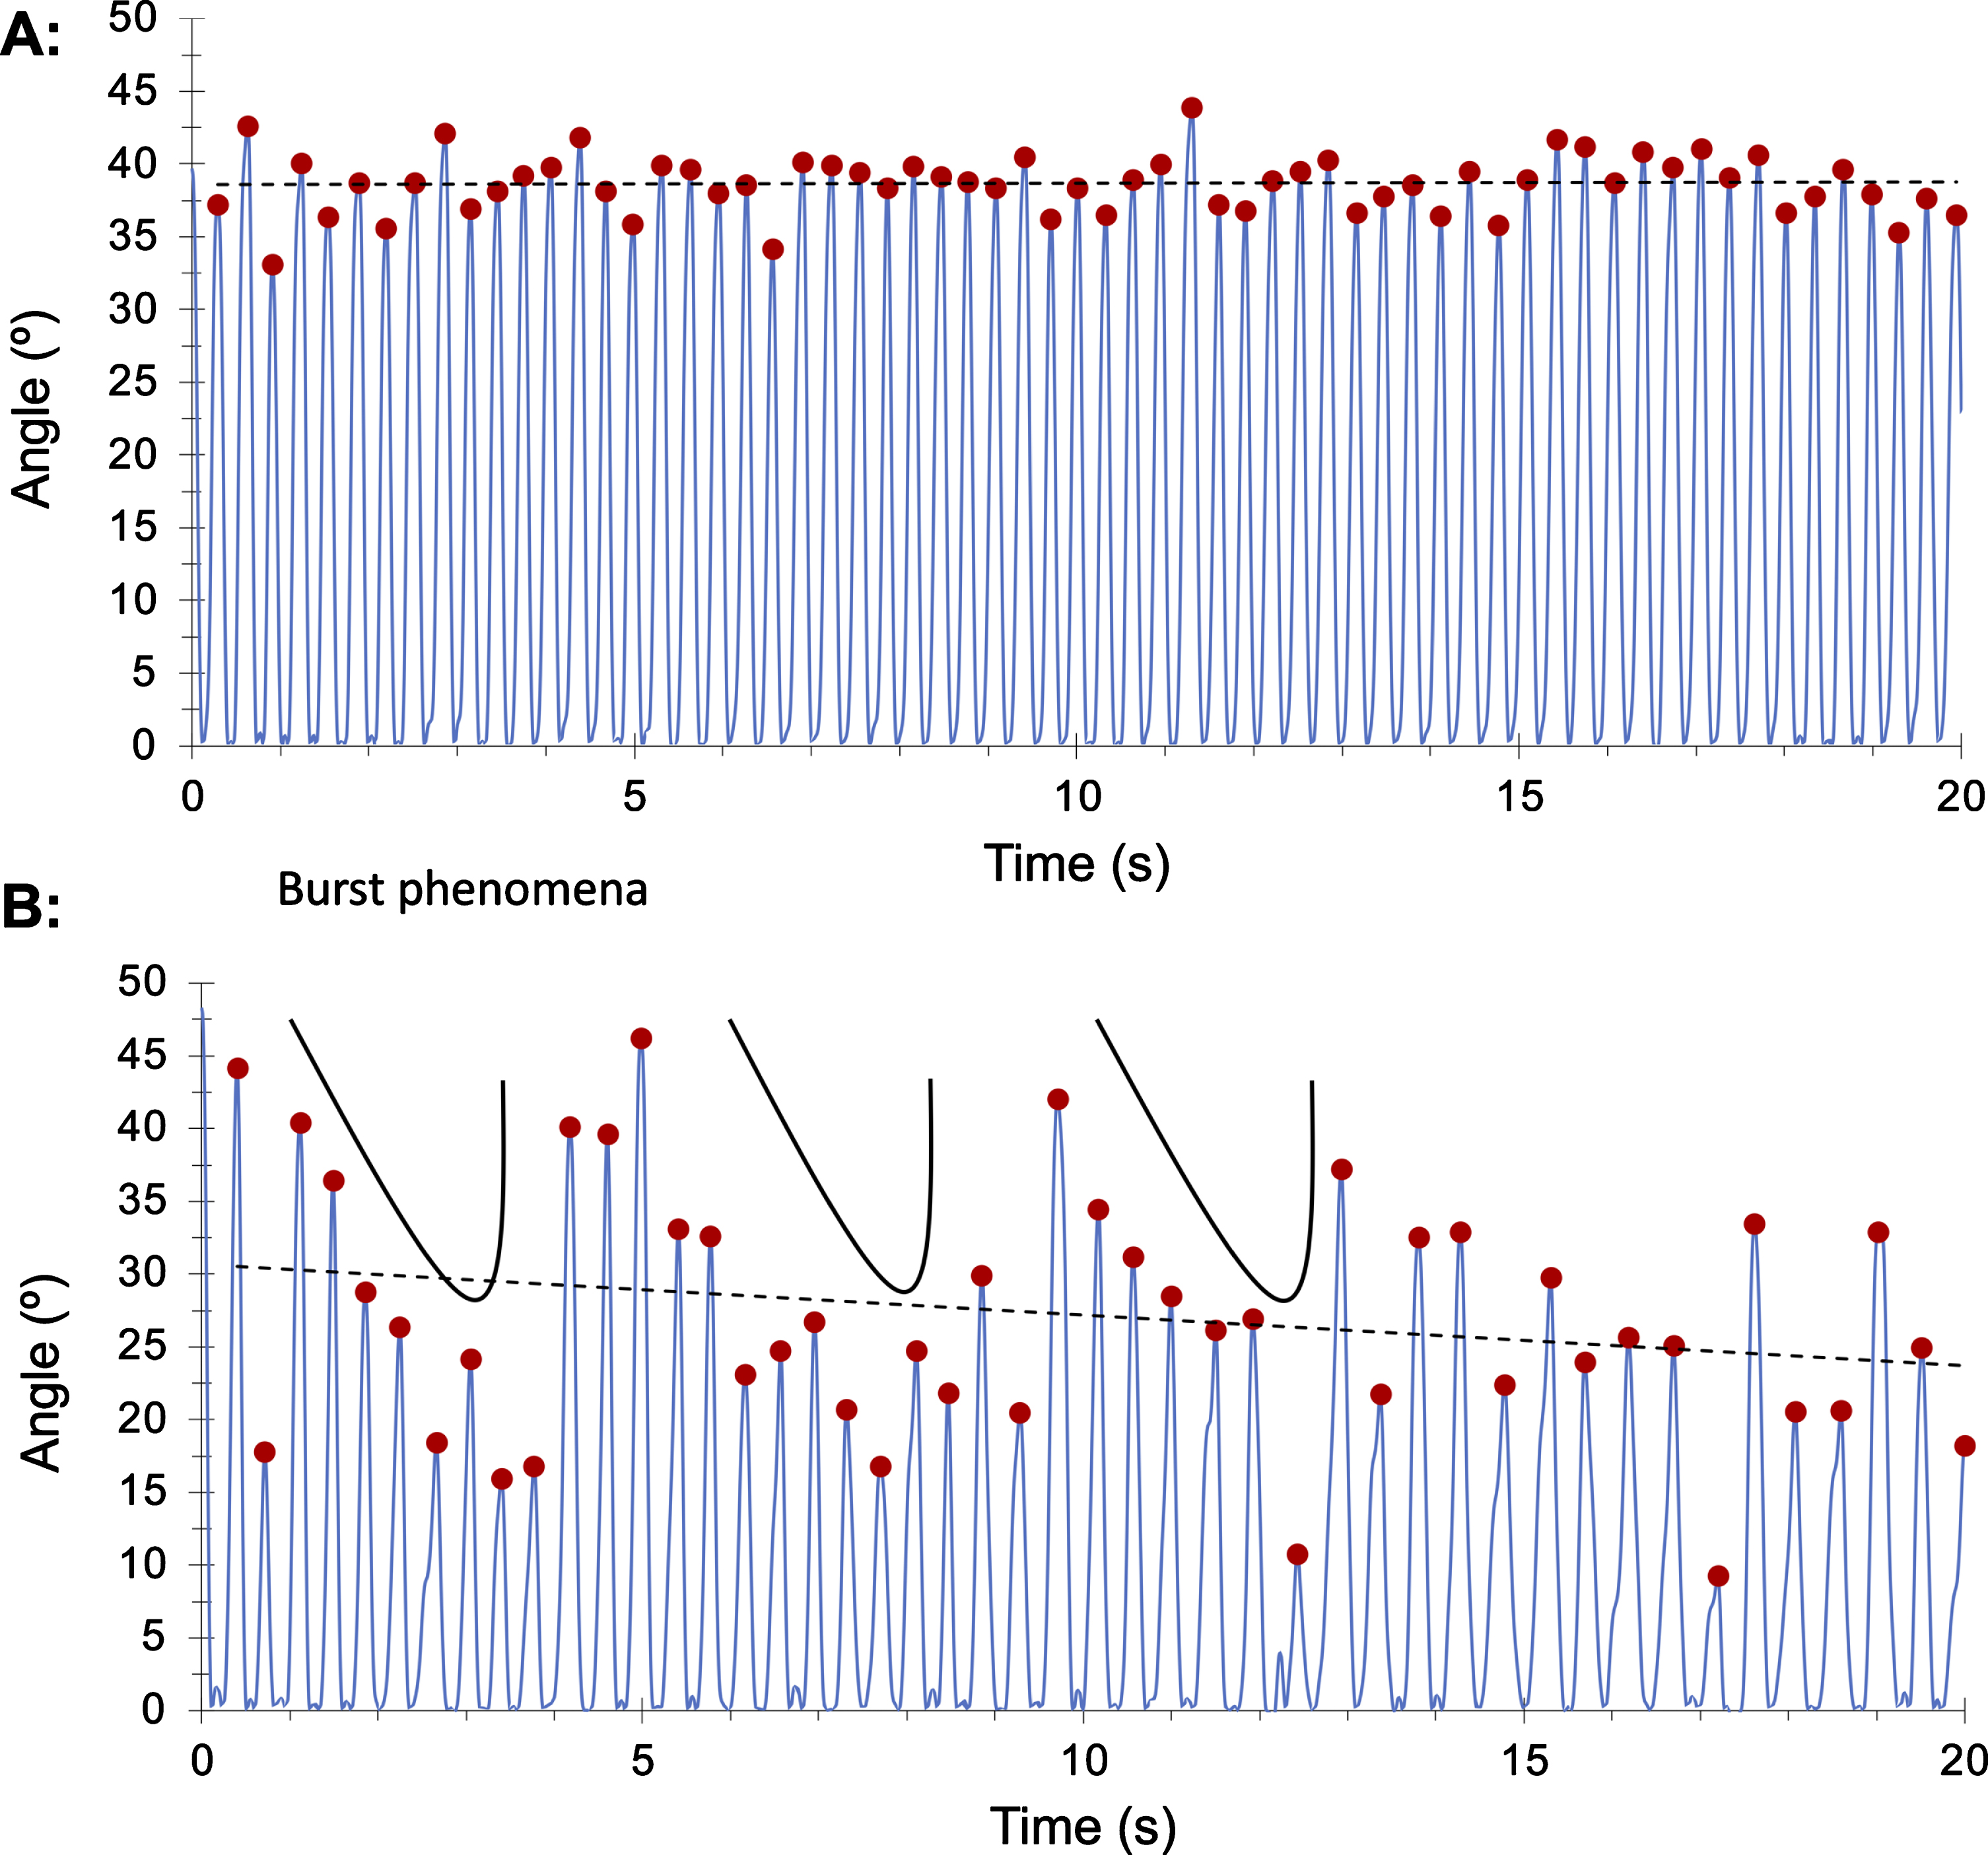
Control subject (A) with constant frequency and amplitude compared to patient with PD (B) showing a ‘burst phenomena’ (repetitive amplitude rebound over 20 seconds task).
In contrast, kinetic parameters (velocity and frequency) were able to distinguish patients from controls with a good accuracy particularly using a combination of both (AUC 0.88). Our findings agreed with some other studies, with velocity and the parameter of variation (CV) found to have a high accuracy (see Table 5). In contrast, in a study by Růžička and colleagues, who used a contactless 3D motion capture system to compare 22 patients with 20 controls, amplitude was the best marker [22]. The slope of amplitude alone provided an accuracy of 0.87. Since their cases had a longer disease duration (9.3 years) than ours, this might suggest that ‘sequence effects’ are more apparent later in the disease course.
Representative literature about quantitative measures of finger movements
**best parameter; NR, not reported; FT, finger tapping; LA, leg agility; ATT, alternating tapping test; PD, Parkinson’s disease; HC, healthy controls; AMC, age-matched controls, SWEDD, scan without evidence of dopamine deficiency; ET, essential tremor; CV, coefficient variance; KS, kinesia score; AT, alternating score; IS, incoordination score; EA, evolutionary algorithms (a form of artificial intelligence using an objective score scaled from – 1 to+1 where higher scores indicate greater severity of bradykinesia), MOV: maximum opening velocity, TD: total distance; Average frequency (AvgFrq), maximum opening velocity (MaxOpV) and amplitude decrement (AmpDec); SVM, support vector machine classifier.
Amplitude and velocity from tapping tasks correlated best with the MDS-UPDRS-III finger tapping sub-scores and might therefore be useful surrogate markers for assessing disease severity. It is however important to consider that two different types of data were compared, categorical (from normal to severe FT sub-score) and continuous data (SMART test parameters). One might expect a floor effect, as it can be interpreted from correlation graphs in Supplementary Figure 2, between lower categorical scores (slight and mild score) which continuous data might be better able to define. Although there was a moderate positive correlation with FT sub-scores, the lack of any stronger correlation suggests that the SMART test and the finger tapping sub-scores of the MDS-UPDRS-III are identifying different phenomena.
Williams and colleagues carried out a project with a similar approach [23]. Smartphone video recordings of a 10-second finger tapping task were tracked with DeepLabCut (CNN). In this study patients had a longer disease duration (median of 4 years) and were on average 9 years older than our group. Although accuracy was not reported, the velocity parameter exhibited a greater correlation with FT-sub-score of MDS-UPDRS-III than ours (r: – 0.74 vs r: – 0.60). This may support the notion that the MDS-UPDRS-III is best adapted to patients with established disease rather than earlier stages [24], suggesting that the findings from this study should be confirmed in people with longer disease duration. In line with the previous study, Schneider and colleagues studied patients with PD (around 4 years of disease duration). Patients were tested using a semiquantitative scale integrated in a motor battery which covered arm swing assessment, single finger tremor, number of finger taps, and handwriting analysis. Whilst the number of repetitive fingers taps per minute was similar between groups, ‘fatigability’ (decrement of amplitude) was more evident among patients. Although the findings were descriptive, they believe that their battery was capable of detecting early subtle motor markers that might be missed by the UPDRS-III [25].
Slow motion tracking of repetitive finger tapping may help to understand how fast, fluid, and erratic normal voluntary movements are. Beyond the decrement of amplitude and frequency, defined as ‘sequence effect’ in bradykinesia, non-linear patterns are seen among patients and controls which make it more difficult to establish cut-offs for normal. It is important to consider that clinical scales are semi-quantitative and semi-objective, and they are prone to individual bias which increases inter- and intra-rater variability [24]. To be of practical value, technology should exceed the performance of “Gold Standard” clinical scales or at least be more efficient.
A study conducted in 384 patients at an early stage of PD (2 or less years from diagnosis), highlighted that limitation of the MDS-UPDRS-III in early PD. The motor impact shown by MDS-UPDRS-II (capturing motor experiences) did not correlate well with motor severity of motor signs detected by MDS-UPDRS-III, especially in those with very mild degrees of severity [26]. A marked floor effect (large concentration of clinical phenotypes near the lower limit) appeared to be the key reason for that gap. The authors concluded that MDS-UPDRS-III had clinimetric limitations which could reduce its accuracy in early disease. In contrast, technology could potentially overcome this limitation. Gao and collaborators designed a sensor device able to assess finger tapping and explore whether it could be used to identify early stages of PD and correlate with disease progression [27]. Readings from the sensors were analysed by using evolutionary algorithms which are a form of artificial intelligence designed to create classifiers of patterns of movement [28]. Their tool reached a high accuracy (≥89.7%) for detecting different severity degrees of bradykinesia. Moreover, it could discriminate early stages of PD with AUC of 0.899. These findings should encourage further research to focus on meticulous detection methods of motor dysfunction throughout the disease course, including the prodromal phase of PD. In fact, a recent review gave evidence about the potential role of video-based artificial intelligence in PD diagnosis and monitoring which could be particularly useful when classification involves complex and dynamical patterns of movement [29].
Our study is the first to use a technology-based tool to look for subtle motor features in idiopathic anosmia. Although our findings remain exploratory and warrant further investigation in a larger sample, the SMART test appeared able to detect subtle changes in anosmia group whilst the finger-tapping sub-score of the MDS-UPDRS-III was less able to identify such discrepancies (6 out 9 patients had normal finger tapping sub-scores). Similar to the most affected side of the PD group, the SMART test was able to detect clear differences in the mean velocity parameter between individuals with anosmia and controls. The anosmic group also shared similarities (CV of all three parameters: amplitude, frequency, and velocity) with the unaffected side of PD, which may suggest identification sub-clinical movement abnormalities. Interestingly, mean amplitude and mean frequency had opposite results. Subjects with anosmia showed on average a reduced amplitude and a similar frequency to controls, whereas PD patients exhibited reduced frequency with similar amplitude to controls (Fig. 5). This might suggest distinct compensatory mechanisms (maintaining a bigger amplitude by reducing the frequency and vice versa) at different stages of the disease.
Anosmia is a prodromal marker of future PD risk [30]. The Health, Aging and Body Composition study showed the hazard ratio for PD over 10 years of follow up to be 4.8 for subsequent PD diagnosis [31]. Another large population-based cohort, the PRIPS study, reported a relative risk ratio of 6.5 in participants with reduced sense of smell after 3 years follow-up [32]. Most studies of idiopathic anosmia did not find detectable motor dysfunction using the MDS-UPDRS-III [33–35]. One longitudinal study showed that whereas subjects with hyposmia did not have worse UPDRS-III scores than individuals with a normal sense of smell, a greater proportion had abnormalities on dopamine transporter SPECT (11% vs 1%) [34]. One systematic review and meta-analysis suggested that anosmia was associated with a 3.84-fold risk of developing PD [36] and the MDS Criteria for Prodromal PD show that, based on seven prospective studies, objective smell loss has a positive likelihood ratio of 4.0 [7]. Based on these findings, the presence of motor features in some patients with anosmia might be expected. The fact that UPDRS-III is often normal in patients with anosmia suggests that other assessments adapted for early stages of PD are needed [37].
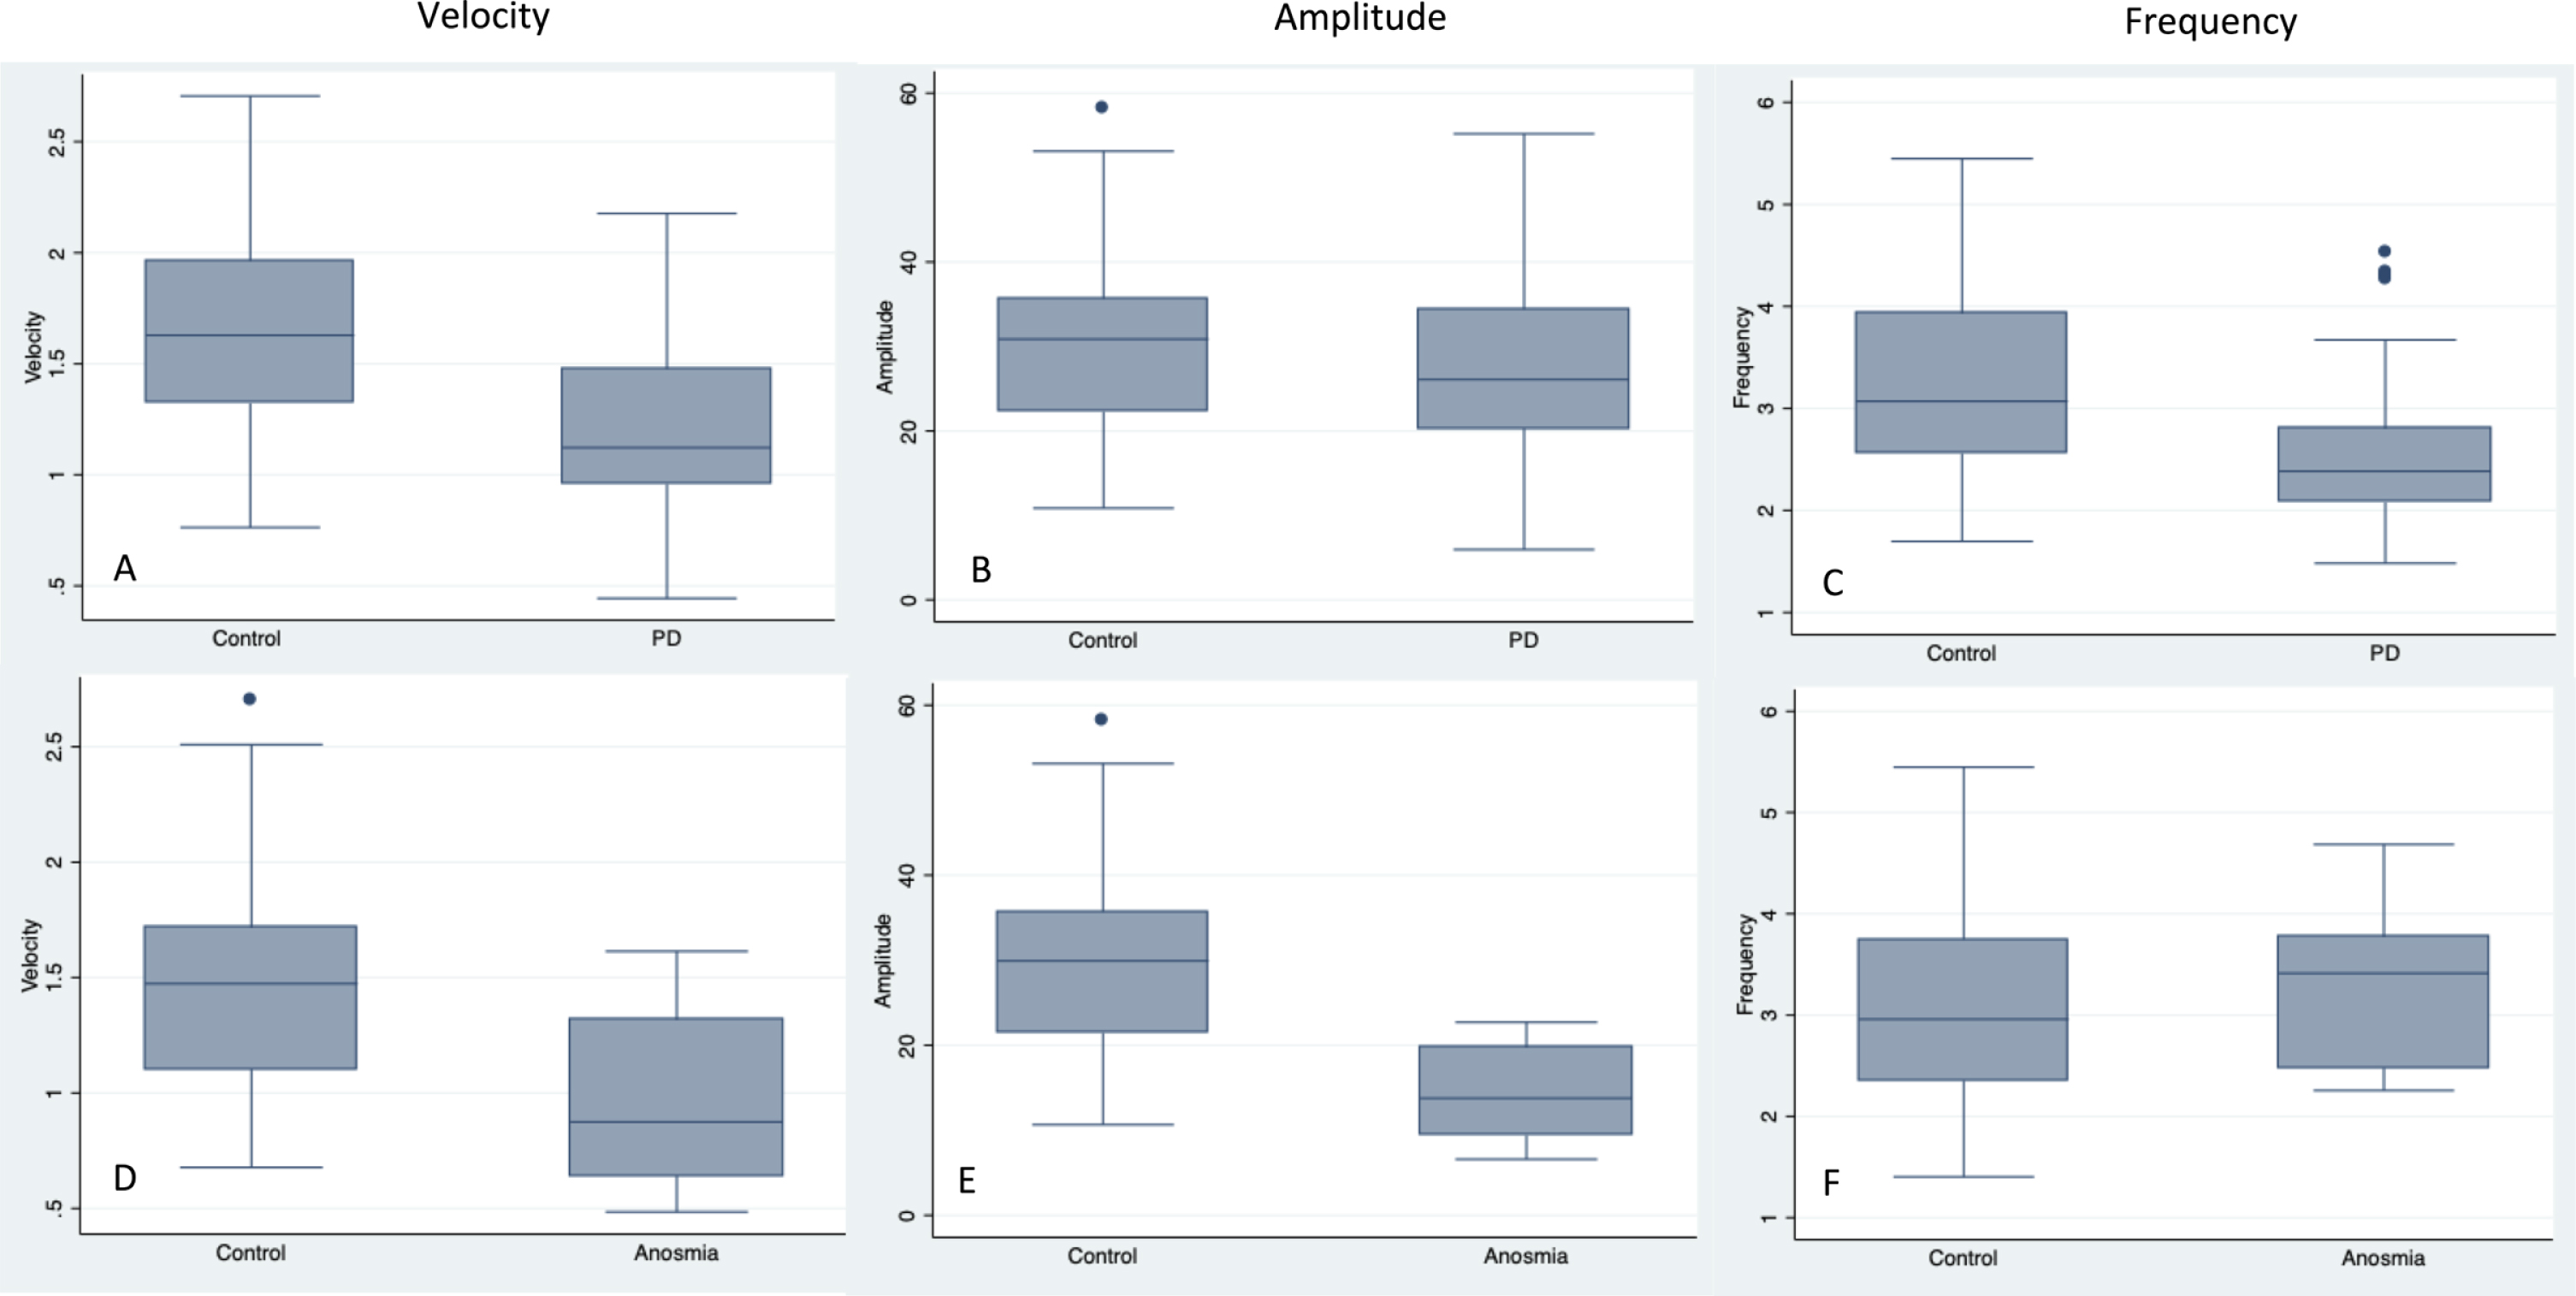
Boxplots comparing the PD group with the control group1 (A-C) and the anosmia group with the control group2 (D-F).
The SMART test offers several advantages. It is a sensor-free tool; therefore, it does not interfere with the natural range of movement. It is inexpensive with a smartphone camera only being required which can potentially make it applicable in larger scale studies. However, it also entails several methodological and data processing limitations.
In terms of limitations, one important consideration is that the exclusion of controls scoring more than 6 in the MDS-UPDRS-III (cut off for subthreshold parkinsonism) may have contributed to artificially increasing test accuracy. In a similar way, the selection of the best scenario comparing the dominant hand in controls and the most affected side in PD could also have magnified the accuracy of the test. Although handedness was reported as a binary variable, degrees of hand dominance amongst controls should be presumed. Pure-right and pure-left handed people are expected to exhibit bigger discrepancies between their dominant and non-dominant hand. However, in this proof-of-concept study, the main purpose was to know whether SMART test was able to distinguish patients form controls under the best circumstances without potential confounding factors such as handedness. Further studies would need to account for the role of handedness as a continuous variable with scales such as Edinburgh Handedness Inventory [38].
Gender matching was difficult to accomplish due to our source of recruitment. Most of our controls were the partners of PD cases (who were predominantly male). One might expect that the lack of gender matching could bias comparisons since men and women’s hands have different characteristics. However, there were no differences in terms of their performance between male and female controls. Another methodological limitation to consider would be that by asking to not rotate the hand, which was done to capture the real angle, we might have prevented patients adopting certain hand postures. It would be particular important in patients exhibiting action tremor since a possible co-existence of dystonic tremor could be expected, especially in early diagnosed patients. Finally, although we tested for a longer period of time than it is recommended by the MDS-UPDRS-III (10 seconds), we should consider testing for longer than 20 seconds, especially in patients at earlier stages.
Moving to data processing limitations, we derived relatively simple summary statistics from the derived time series, and it may be using other techniques based on the frequency domain that capture beat-to-beat variation may be more sensitive, as demonstrated by Biase and colleagues with the tremor stability index [39]. However, the aim of this work was to provide proof of concept, that motion capture using a smart phone could provide metrics sensitive to changes in early PD. There are a large number of non-linear, time-series metrics, and this question will be the focus of future work. Although we used a simple, threshold-based method, for discriminating PD from controls, we acknowledge that there are other approaches based on machine learning that may be able to leverage the whole time-series, or indeed the raw video footage, and ultimately prove more accurate. However, in this work we sought to derive quantitative metrics from video footage, given these measures have much broader utility beyond mere categorical diagnostics (e.g., treatment biomarkers).
Finally, we did not find a difference between ‘on’ and ‘off’ stages whereas MDS-UPDRS-III did find a 40% change. A reasonable explanation for that would be that MDS-UPDRS-III covers the ‘whole picture’ (walking, facial expression, rigidity, etc) whereas finger tapping only assesses distal bradykinesia. A longstanding LD response could be another reason for not having found differences between ‘on’ and ‘off’ medication. Twelve hours off medication might not be enough to get a clinically evident off state, especially in recently diagnosed patient [40]. MDS-UPDRS-III FT sub-scores was also similar in the majority of PD patients. That could suggest that FT might not be a useful task to measure, in isolation, LD response. However, there is a lack of studies measuring the LD response of each one MDS-UPDRS sub-scores separately. Vassar and collaborators carried out a confirmatory factor analysis of the UPDRS for ‘on’ and ‘off’ state examination and found that a five factor model fitted the data better, with finger tapping being included in the same factor as rigidity, hand movements, and leg agility [41]. Although ‘on’ and ‘off’ comparison was not carried out, finger taps had the lowest factor loading contribution in ‘on’ and ‘off’ state separately.
Finally, it is important to mention that the SMART test was not designed to be used as a diagnostic tool in isolation. Ideally, it might help to guide further tools more focused on velocity assessment for in the end to be included in a quantitative motor battery able to capture the whole picture of movement abnormalities (hand dexterity, facial expression and walking, among others), in particular in the early stages of PD.
CONCLUSIONS
The SMART test provides objective evidence of motor dysfunction in PD with velocity being the best parameter to differentiate recently diagnosed PD cases from controls. Individuals with idiopathic anosmia exhibited abnormal patterns of movement supporting the idea of anosmia being part of the prodromal phase of PD.
Footnotes
ACKNOWLEDGMENTS
The Preventive Neurology Unit is funded by the Barts Charity.
AJN reports additional grants from Parkinson’s UK, Virginia Keiley benefaction, Cure Parkinson’s Trust, and Michael J Fox Foundation, and personal fees/honoraria from Britannia, BIAL, AbbVie, Global Kinetics Corporation, Profile, Biogen, Roche and UCB, outside of the submitted work.
CS is funded by Fundación Alfonso Martín Escudero, Spain. No other disclosures were reported.
AL is funded by the Reta Lila Weston Institute of Neurological Studies, University College London, Institute of Neurology and reports consultancies/honoraria from Britannia Pharmaceuticals and BIAL Portela. He also reports grants and/or research support from the Frances and Renee Hock Fund.
AS is supported by the NIHR UCL/H Biomedical Research Centre.
CL is supported by an MRC Clinician Scientist award (MR/R006504/1). The Wellcome Centre for Human Neuroimaging is supported by core funding from the Wellcome Trust (203147/Z/16/Z).
CONFLICT OF INTEREST
The authors have no conflict of interest to report.