
Abstract
Background:
Parkinson’s disease (PD) is a neurodegenerative disorder associated with insoluble pathological aggregates of the protein α-synuclein. While PD is diagnosed by motor symptoms putatively due to aggregated α-synuclein-mediated damage to substantia nigra (SN) neurons, up to a decade before motor symptom appearance, patients exhibit sleep disorders (SDs). Therefore, we hypothesized that α-synuclein, which can be present in monomeric, fibril, and other forms, has deleterious cellular actions on sleep-control nuclei.
Objective:
We investigated whether native monomer and fibril forms of α-synuclein have effects on neuronal function, calcium dynamics, and cell-death-induction in two sleep-controlling nuclei: the laterodorsal tegmentum (LDT), and the pedunculopontine tegmentum (PPT), as well as the motor-controlling SN.
Methods:
Size exclusion chromatography, Thioflavin T fluorescence assays, and circular dichroism spectroscopy were used to isolate structurally defined forms of recombinant, human α-synuclein. Neuronal and viability effects of characterized monomeric and fibril forms of α-synuclein were determined on LDT, PPT, and SN neurons using electrophysiology, calcium imaging, and neurotoxicity assays.
Results:
In LDT and PPT neurons, both forms of α-synuclein induced excitation and increased calcium, and the monomeric form heightened putatively excitotoxic neuronal death, whereas, in the SN, we saw inhibition, decreased intracellular calcium, and monomeric α-synuclein was not associated with heightened cell death.
Conclusion:
Nucleus-specific differential effects suggest mechanistic underpinnings of SDs’ prodromal appearance in PD. While speculative, we hypothesize that the monomeric form of α-synuclein compromises functionality of sleep-control neurons, leading to the presence of SDs decades prior to motor dysfunction.
Keywords
INTRODUCTION
Parkinson’s disease (PD) is a neurological disorder diagnosed by specific, well-defined motor symptoms. However, this disease exhibits a prodromal interval starting years to decades before the appearance of motor disabilities, in which the most notable symptoms present are sleep disorders (SDs) [1–3]. Thus, appearance of SDs is currently the most specific, and powerful prodromal marker for age-related, α-synucleinopathies such as PD [4, 5]. Elucidating the neuronal mechanism of SDs in the prodromal phase of PD offers the hope of earlier disease detection and treatment. PD movement symptoms are associated with substantia nigra (SN) degeneration and abnormal aggregation of the protein, α-synuclein (α-syn), which changes form from a monomeric structure, to damaging oligomers [6] and, ultimately, to fibrils [7]. However, SN degeneration is unlikely to be the cause of the appearance of SDs since SDs precede the movement impairments of PD. A more likely explanation is that as α-syn levels rise [8], α-syn-mediated neurodegeneration starts earlier in sleep- and arousal-control nuclei than in motor control centers.
The most common SDs shown to be prodromal to appearance of PD are REM sleep behavior disorder (RBD) [3, 10] and excessive daytime sleepiness (EDS) which potentially share a mechanistic underpinning, as both disorders may result from activity changes within two state-regulating, brain stem nuclei located in the pontine tegmentum: the laterodorsal tegmental nucleus (LDT) and pedunculopontine tegmental nucleus (PPT) (Fig. 1A). Via ascending projections in the reticular activating system, the LDT and PPT notably control cortical electroencephalographic signs of an alert, aroused brain, induce behavioral attention, and modulate REM sleep initiation [11–14]. Moreover, while the circuitry mediating REM sleep atonia is extensive within the brain stem, neurons of the PPT and LDT are key structures in triggering activity in the pontine and medullary motor inhibitory circuit mediating motor atonia specific to REM sleep [15].
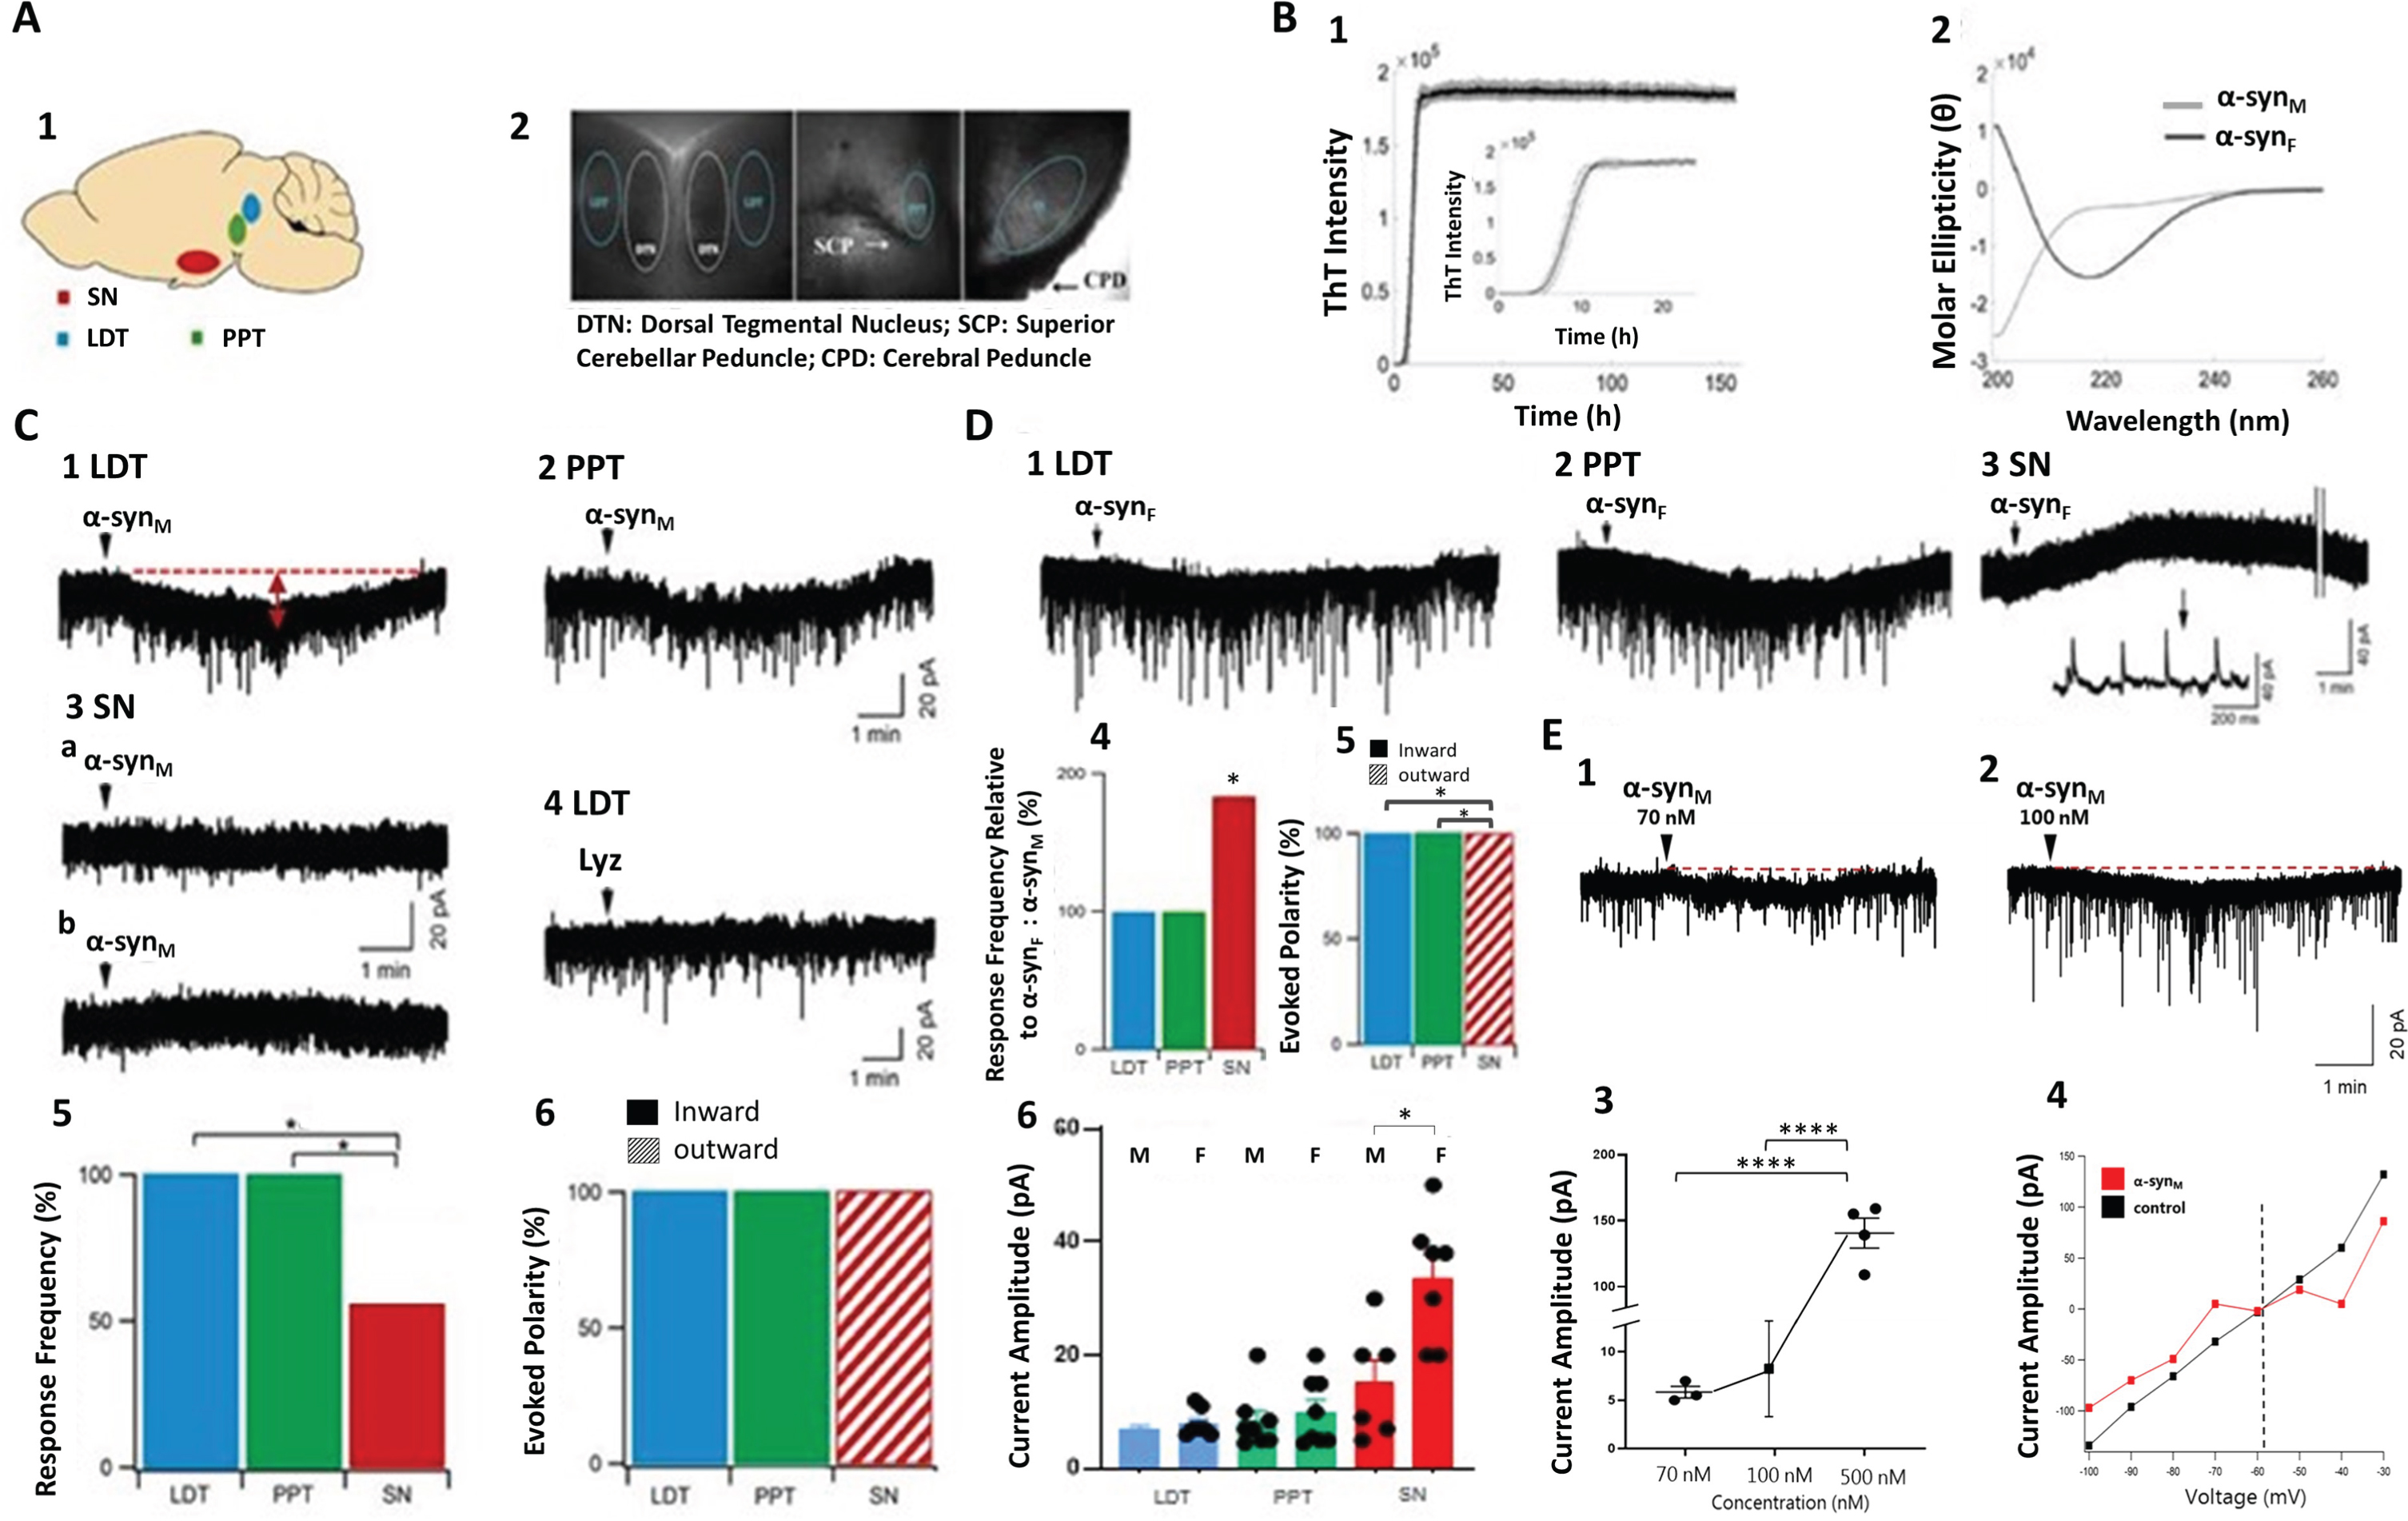
Characterized monomeric α-syn (α-synM in this and subsequent figures) induced inward currents in LDT and PPT neurons; whereas, in the SN, outward currents or no responses were seen. A1) The LDT, PPT and SN are shown in a sagital view of the mouse brain. A2) Under low magnification (4X), the boundaries of the LDT, PPT and SN along with other rostro-caudal extent-marking anatomical structures can be seen. B) The secondary structures of α-syn samples were analyzed in order to confirm monomeric and fibrillar states. Shown in B1 is the ThT fluorescence for the 7 day fibrillation assay depicted as the mean of triplicate runs, with the insert detailing the first 24 h. In B2, the CD spectra of monomeric and fibrillated α-syn (0.15 mg/ml) are delineated, and show the random coil structure for monomeric α-syn, consistent with the native, intrinsically disordered form, and α-sheet structure after fibrillation. C) Monomeric α-syn induced contrasting membrane responses in LDT and PPT neurons compared to SN neurons, and a peptide control failed to elicit a membrane effect. Sample membrane responses to monomeric α-syn, which induced excitatory currents in LDT (C1) and PPT (C2) neurons. In contrast, in both putatively dopamine and non-dopaminergic SN neurons monomeric α-syn induced no response (C3a) or an inhibitory current (C3b). Lysozyme (Lyz) failed to elicit a membrane response (C4). The proportion of cells responding to, (C5) and the polarity of the current evoked (C6) by monomeric α-syn differed markedly between the sleep-related and SN nuclei. D) The fibril form of α-syn (α-synF in this and subsequent figures) also induced disparate currents in sleep-related (LDT and PPT) and motor control (SN) nuclei. Fibril α-syn elicited inward currents in LDT (D1) and PPT neurons (D2), but outward currents in SN neurons (D3). The proportion of SN cells responding to fibril was significantly higher than to monomeric α-syn (D4). A significant difference in the current amplitude elicited in SN neurons by the two α-syn forms was present (D5). Such difference was not seen in either LDT or PPT cells (D6). In this panel, M indicates monomeric α-syn and F indicates the fibril form. E) Monomeric α-syn at three different concentrations induced dose-dependent inward currents in LDT cells, concomitant with conductance changes. E1, 2) Sample membrane responses to monomeric α-syn at two concentrations that induced inward currents in LDT neurons are shown. E3) Plotted are the mean values and S.E.M of the inward current amplitudes induced by monomeric α-syn at a concentration of 70 nM (n = 3), 100 nM (n = 35), and 500 nM (n = 4) demonstrating an increase in response amplitudes with increasing concentration (one-way ANOVA; F(39) = 693.1; {\it{p}} < 0.0001). While we saw no significant difference between 70 nM and 100 nM ({\it{p}} = 0.9509), post hoc testing did indicate significantly different effects of 70 nM and 500 nM monomeric α-syn (p < 0.0001), as well as between 100 nM and 500 nM monomeric α-syn (p < 0.0001). E4) The current-voltage relationship is shown in an LDT neuron before and after monomeric α-syn application. These data indicate that the peptide induced a voltage-dependent conductance change (n = 2), which strongly supports the conclusion that α-syn has an effect on the electrophysiological properties of the membrane of LDT neurons. In this, and subsequent figures, *p < 0.05, **p < 0.01, and ****p < 0.0001, respectively.
RBD is characterized by a lack of motor atonia during REM sleep, is a clinical risk factor for PD [4, 16], and has been conjectured to involve dysregulation in the pontine circuits controlling REM motor behavior [3, 17]. Further, detection of α-syn in patients with RBD was associated with higher risk of development of PD [18]. Patients with RBD that was not associated with a PD diagnosis showed disturbances in the brain stem in the region of the LDT/PPT. Imaging studies conducted in 5 patients with RBD associated with ischemic lesion, multiple sclerosis, cavernoma or neurinoma concluded that RBD was associated with lesions within or near the mesencephalic and pontine tegmentum [9]. EDS, which is characterized by low levels of cortical signs of arousal and reduced behavioral alertness during the day is associated with a threefold higher risk of later-life development of PD, and is one of the most common SDs present in diagnosed PD patients [19, 20]. EDS is unrelated to worsening of motor symptoms in those diagnosed with PD, which suggests a role of neuronal mechanisms independent of degeneration of the SN. As part of the reticular activating system, the LDT and PPT could play roles in the high arousal threshold and low attention symptoms of EDS.
Interestingly, the LDT and PPT are profoundly degenerated in postmortem brains of PD patients and α-syn inclusions have been found in these nuclei [21–23]. Data from a recent imaging study indicated that α-syn-inclusions of PD can source from two modalities, a brain-first pathway, or a body-first transmission of α-syn whose spatial spread is mediated by the autonomic nervous system, supporting the conclusion that presence of idiopathic RBD prior to motor symptoms is a highly predictive marker of the body first modality of transmission [16]. Further, this transmission mode was associated with early degeneration in the pons, although an involvement of α-syn in the degeneration was not shown [16]. However, neurodegeneration in pontine brain stem related to α-syn inclusions has been reported in individuals who were asymptomatic for PD, but diagnosed with RBD [3, 24]. Interestingly, with the goal to develop an α-syn-based RBD animal model, injection of preformed α-syn fibrils into the mouse sublaterodorsal tegmentum, a site located at the caudal level of the LDT, induced neurodegeneration associated with a RBD phenotype, with later development of PD symptoms [25].
Although a definitive link between α-syn-involved degeneneration of the LDT and/or the PPT and manifestation of RBD or EDS prodromal to PD has not been established, when the association between SDs and PD are taken together with findings from protein localization and neurodegeneration studies and the known function of the LDT and PPT, we hypothesize that α-syn has neuronal effects in these two nuclei. Given the appearance of SDs prior to motor complaints in PD, we hypothesized further that the LDT and PPT exhibit a greater sensitivity to actions of the monomeric form of α-syn than does the SN. To examine these hypotheses, we investigated whether native monomer, as well as fibrillated forms of highly purified α-syn had effects on LDT and PPT neuronal function and calcium dynamics, as well as whether exposure to α-syn elicited cell death. Further, we compared these effects to those in SN neurons.
MATERIALS AND METHODS
Recombinant α-syn and size exclusion chromatography (SEC)
Human α-syn was recombinantly expressed and purified as previously described [26] with few modifications. In brief, α-syn was cloned into E. Coli BL21DE3 cells using a pET-11a vector construct. Harvested cells were lysed by osmotic shock and non-heat-stable proteins were removed by boiling and centrifugation. α-syn was isolated by ion-exchange chromatography and the monomer was isolated by SEC. Monomer fractions from SEC were pooled and kept in PBS buffer stored at –80°C.
Fibrillation assay
α-syn in PBS buffer (1.5–2.2 mg/ml) was fibrillated in a microplate reader (FLUOstar Omega. BMG Labtech) at 37°C with 3 mm sterile glass beads and orbital shaking (700 rpm for 280 s in each 360 s cycle). Samples were aliquoted (150μl) in a NUNC 96-well optical polymer-based, clear-bottom black plate (Thermo Fisher scientific 265301) and sealed with clear polyolefin tape (Thermo Fisher scientific 232702). Thioflavin T (ThT; 20μM) was added to three samples, retaining in parallel non-ThT-containing samples for the electrophysiology experiments. ThT emission was recorded at 480±10 nm upon excitation at 450±10 nm. Fibril samples were collected after 7 days, to ensure full fibril maturation, and thereafter stored at room temperature. Although sonication is often used for preparation of pre-formed fibrils, we chose to work with mature fibril formed after 7 days of fibrillation to ensure the stability of the structural states and reproducibility of samples. ThT fluorescence for the 7 day fibrillation assay are shown in Fig. 1 as the mean of a triplicate run, with insert detailing the first 24 h.
Circular dichroism (CD)
The secondary structure of α-syn samples was investigated to confirm monomeric and fibrillar states. CD was measured on monomer and fibrillated α-syn samples, respectively, using a JASCO J-1500 CD spectrometer. Samples were diluted to a final concentration of 0.15 mg/ml (10μM) and placed in a cuvette with a light path of 1 mm. Spectra were collected from 260–190 nm, with a bandwidth of 1 nm, scanning speed of 100 nm/min, and a temperature of 25°C. The final spectra were made as accumulations of three. In Fig. 1, CD spectra of monomeric and fibrillated α-syn are shown indicating random coil structure for monomeric α-syn, consistent with the native, intrinsically disordered form, and β-sheet structure after fibrillation.
Animals
Male NMRI mice (Harlan Mice Laboratories, Denmark) aged 12 to 30 days were used under approved protocols in accordance with European Communities Council Directive (86/609/EEC). At birth, the animals were fostered and housed with a lactating female under controlled temperature (22–23°C) and 45–65% humidity conditions in a 12 : 12 h light-dark cycle, with water and food available ad libitum. At postnatal day 21, the animals were weaned, and group-housed with their same-sex siblings.
Tissue preparation for electrophysiology, calcium imaging and neurodegeneration studies
Following deep anesthesia with inhalation of isoflurane (Baxter A/S, Denmark), a block of the brain containing the LDT, PPT, or SN was excised (Fig. 1A). The brain block was sectioned coronally into 250μm slices using a vibratome (Leica VT1200S, Leica Biosystems, Germany) in ice-cold artificial cerebrospinal fluid (ACSF). The standard ACSF contained (in mM) 124 NaCl, 5 KCl, 1.2 Na2HPO4•2H2O, 2.7 CaCl2•2H2O, 1.2 MgSO4 (anhydrous), 10 dextrose, 26 NaHCO3 at pH 7.4 and an osmolarity of 298–302 mOsm/kg and was saturated with carbogen (95% O2/5% CO2). Within the coronal brain slices, identification of the LDT, PPT and SN for electrophysiology, calcium imaging and neurotoxicity assays was conducted using standard landmarks as shown in Fig. 1. Specifically, the LDT was identified as positioned just lateral to the dorsal tegmentum and ventral to the aqueduct, the PPT was identified by the superior cerebral peduncle, and the SN was identified by the cerebral peduncle. In a subset of slices, immunohistochemistry or electrophysiological protocols confirmed identification of the nuclei.
α-syn, lysozyme, AMPA preparation and application
The highly purified monomeric form of α-syn was stored in solution at –80°C in aliquots of 10μl (150μM) until use. Aliquots (150μM) of mature α-syn fibrils were kept at room temperature and used within a maximum of 2 weeks and all efforts were made to treat the solution gently in order to minimize shifts in structural states. In initial experiments, we found that 70 nM of α-syn induced a short-duration, membrane response; whereas, in the same cell, 100 nM induced a longer-lived shift in current amplitude, therefore, we decided to continue with 100 nM, which had been used in other studies [27] (see Fig. 1). The final concentration of α-syn diluted in ACSF was applied for 3–4 min after the establishment of baseline conditions. As lysozyme has a similar molecular weight as α-syn (14 kDa), it aggregates and forms fibrils in solution, and it has been extensively utilized as a control for non-specific peptide effects in α-syn studies [28, 29], effects of lysozyme were evaluated to control for non-specific peptide effects. Lysozyme solution (1 mM) was stored at 5°C in aliquots of 2000μl until use and was diluted in ACSF to a final concentration of 100 nM and applied for 3–4 min via the slice bath, which failed to elicit an excitatory response in LDT neurons (n = 3; Fig. 1C4). Repeatable effects of α-syn in individual neurons indicated that membrane effects were not due to immediate cell death (n = 3; data not shown).
Patch clamp recordings
Borosilicate glass patch pipette electrodes (Sutter Glass, Inner diameter: 0.86 mm, Outer diameter: 1.5 mm) were fabricated using a horizontal puller (P-97, Sutter Instruments, USA) to a tip diameter of 1–3μM, and filled with an intracellular solution containing in mM: 144 K-gluconate; 2 KCl; 10 HEPES; 0.2 EGTA; 5 Mg-ATP and 0.3 Na-GTP, with a resulting pipette impedance of 6–11 MΩ. The brain slice was placed in the recording chamber and 1.2 ml/min of carbogenated ACSF was continuously perfused. Cells were visualized with a 60x water immersion objective coupled to an upright microscope (BX50WI, Olympus; Japan) with an infrared Dodt gradient contrast system (IR-DGC; Luigs & Neumann, Germany) and a CCD camera (CCD-300ETRC; DAGE-MTI, Michigan City, IN). A patch clamp EPC9 amplifier (HEKA, Germany) and the software Pulse (HEKA; version 13.0) were used in voltage clamp mode and the holding voltage was maintained at –60 mV. Following membrane breakthrough, and at least a 7 min stabilization period, data were collected. Recordings of membrane currents were sampled at a rate of 1 kHz using AxoScope 10.2, and an Axon miniDigi 1B digitizer (Molecular Devices Corporation, USA). In some recordings, current-voltage relationships were established by stepping the membrane in 200 ms duration epochs from –110 mV to –30 mV in increments of 10 mV from a holding potential of –60 mV. Differences between control and drug conditions in current amplitudes required to step the membrane to the test voltages reveal a disparity in membrane conductance, and the crossing of the control and drug curves indicate the reversal potential of the conductance activated by monomeric α-syn. Combined patch clamp recordings and calcium imaging were conducted with a different setup in voltage clamp mode with a EPC9 amplifier guided by Pulse (version 9.0); and, membrane current recordings were sampled at 10 kHz using AxoScope 10.2 (Molecular Devices Corporation, USA) and an Axon Digidata 1440A digitizer (Molecular Devices Corporation, USA).
Proportion of recorded cells responding to 100 nM α-synM and α-synF divided by cell type in the LDT, PPT and SN. Determination of recorded LDT and PPT neurons as cholinergic or non-cholinergic, and identification of SN neurons as dopaminergic (DA) or non-DA revealed that the membrane effects induced by both forms of the peptide in these nuclei were independent of cell phenotype. To identify recorded cells as cholinergic (chol) or non-chol, neurons were filled with Alexa-594 during the recordings that remained in the cell. Following post hoc immunohistochemical procedures, Alexa-594-positive cells were determined to be chol or non-chol based on the presence or absence of brain-derived nitric oxide synthase (bNOS), respectively, as shown in Supplementary Figure 1A. Classification of SN cells in this study followed previously published electrophysiological protocols and examples are shown in Supplementary Figure 1B [31]
SN, substantia nigra; DA, dopaminergic; LDT, laterodorsal tegmentum; PPT, pedunculopontine tegmentum; Chol, cholinergic; α-synM, monomeric form of α-syn; α-synF, fibril form of α-syn.
Identification of cell phenotype
For post hoc identification of the recorded cells as being present within the perimeter of the cholinergic LDT and PPT, or to phenotypically identify recorded neurons, in some recordings, Alexa-594 was included in the intracellular solution, and immunohistochemistry for brain-derived nitric oxide synthase (bNOS), which is a validated marker of cholinergic neurons in the mouse LDT and PPT was performed [30]. While ChAT immunohistochemistry is often used to identify cholinergic neurons, in our studies we have found that it is not as accurate as bNOS immunohistochemistry in brain slices that have not been optimally prepared for antibody detection. Optimal conditions include collection from a brain which has been rinsed, and perfused with paraformaldehyde via transcardial perfusion just prior to cessation of cardiac activity. Our slices are not prepared in this manner, and they incubate for hours in ACSF, with or without α-syn or lysozyme exposure prior to paraformaldehyde fixation. We have previously confirmed that in the mouse brain stem, bNOS is just as reliable a marker for cholinergic neurons as ChAT [30]. Accordingly, after the recordings, slices were submerged in 4% paraformaldehyde and stored overnight. Slices were then cryoprotected by saturation in a 30% sucrose solution and resectioned at 40μm. Immunohistochemical labeling for bNOS was conducted following previously reported protocols on the resectioned tissue [30]. Supplementary Figure 1A shows representative examples of cells recorded in this study (Alexa-594-positive), which were identified as cholinergic or non-cholinergic based on presence or absence of bNOS. In order to determine the phenotype of neurons in the SN, we evaluated firing frequency, degree of presence of an Ih current, and spike cessation during electrophysiological recordings in current clamp recording mode [31], as shown in Supplementary Figure 1B. To evaluate firing frequency, current was applied which depolarized putative dopamine-containing neurons sufficiently (–50 mV to –45 mV) to induce a regular, slow firing of action potentials (< 4–5 Hz). To determine presence of Ih a large hyperpolarizing pulse (–150 pA; 1-2 sec duration) was used to evaluate appearance of a prominent ‘sag’ which is a shift in the voltage of the membrane back towards a more depolarized potential. To evaluate blockade of action potential firing, a large amplitude depolarizing current step (+150 pA; 1-2 sec duration) was applied and cessation of action potentials was monitored.
Multiple cell and single cell calcium imaging
Single-photon, multiple-cell calcium imaging based on the ratiometric fluorescent calcium indicator dye (excitation wavelengths 340 and 380 nM), fura-2 acetoxymethyl ester (fura-2 AM) was conducted. Dye loading of brain slices was performed as in previous studies [32, 33]. For single-cell calcium imaging, bis-Fura 2 (25μM, Molecular Probes) replaced EGTA in the intracellular pipette solution. For both single and multiple cell calcium imaging, changes in fluorescence emitted within selected regions of interest encompassing cells were detected using a cooled CCD fluorescence camera system (12-bit Sensicam, PCO Imaging, Germany) controlled by the imaging software Live Acquisition (TILL Photonics, Germany).
Neurotoxicity assays (DAPI/PI and bNOS)
Coronal slices containing LDT or SN were incubated for a period of 7½ hours in monomeric α-syn (100 nM), or in ACSF under the same time protocols while carbogen (95% O2/5% CO2) was continuously supplied. For studies examining the effect of fibril α-syn (500 nM), bisected slices were used. Another investigator who was blinded to slice treatment conducted the identification of cell viability (C.R.R.L). The slices were incubated for 3 periods of 5 minutes in 1μg/ml solution of both propidium iodide (PI; Sigma-Aldrich) to identify dead cells and DAPI, which stains live cells (Sigma-Aldrich) with a pH of 7.4. Fluorescent signals were detected by an upright Zeiss microscope (Zeiss 59 fluorescent filter cube sets, wavelengths PI: 472–578 nm; DAPI: 358–463 nm) coupled to a monochrome CCD camera (Axiocam MRM, Zeiss, Germany) controlled by Axioskop 2 software (AxioVision 4.6, Zeiss). ImageJ software (National Institutes of Health, Bethesda, MD) was used to analyze the collected images and count the number of DAPI and PI-labeled cells. The total cell count was calculated as PI-positive plus DAPI-positive cells. In a separate population of bisected slices, in order to test non-specific peptide effects on cell death, we incubated LDT and PPT bisected slices in lysozyme (500 nM) or monomeric α-syn (500 nM) for 4–5 hours; thereafter, PI was added, and dead cells were counted in both slice hemi-sections. The proportion of dead cells in the monomeric α-syn exposed half was normalized to cell death seen in the hemi-slice exposed to lysozyme.
To compare relative presence of bNOS-positive cells in the LDT and PPT, coronal LDT slices were bisected and one half was incubated in control solution, and the other half in one of two monomeric α-syn containing solutions (200 nM or 500 nM) for 7 h. Following immunohistochemical procedures, cells were determined to be cholinergic based on presence of bNOS. All bNOS-positive cells within the border of the LDT or PPT were counted, and for presentation in paired plots, the numbers of positive cells in the α-syn-exposed hemi-slice were normalized to control, which was the numbers of positive cells in the other half of the same slice.
Real-time cell viability
Slices containing the LDT were bisected, individual cells were visualized, and patch clamp and calcium imaging recordings were initiated in the same cell. Monomeric α-syn (500 nM) was bath applied, and after filling the recording chamber, perfusion was halted to ensure continuous exposure to α-syn. As a control, the same protocols were conducted on the other half of the slice with the exception of application of peptide. After completing the calcium imaging recording, PI was added to the recording chamber (2μl; 0.1μg/ml), and real-time increases in fluorescent signal of PI were measured by time-lapse imaging using the excitation wavelength of 545 nm and the appropriate filter set (Chroma, USA).
Data analysis and statistics
Calcium imaging data were analyzed in Igor Pro 6 (Wavemetrics, USA). Response amplitude and polarity were quantified with changes in fluorescence below 4% considered too small to reliably discern from background noise. The ratiometric measures of changes in fluorescence are shown in graphs as % DF/F. DF/F is the difference (D) between the average of a series of data points at the maximum change in fluorescence following drug application and the average baseline fluorescence (F) relative to F, with ascendant deflection indicating intracellular calcium elevation. Amplitudes of membrane currents were measured (the difference between baseline and maximum deflection) by using AxoScope 10.5 (Molecular Devices, USA). In Figs. 1 and 2, the axis label, Response Frequency equals the percentage of tested cells which responded with membrane current or changes in calcium, and the axis label, Evoked Polarity indicates the polarity (inward or outward) of the current or increase or decrease in calcium elicited in the population of responding cells, respectively. Statistical analyses of data were performed in Prism (version 7.0, GraphPad, USA). Results are presented as mean values±SEM with the degrees of freedom (df). The figures were prepared using Igor Pro software, Graphpad Prism and Matlab R2018b. The n reported reflects numbers of single neurons recorded and represents neurons collected from at least 3 different animals, which sourced from different litters. Sample sizes were determined from past experiences with electrophysiological recordings in order to limit unnecessary loss of animal life in adherence to 3R guidelines. Differences in numerical data were tested using a one-way ANOVA with Tukey’s post hoc test, or a two-way, Paired or Unpaired Student’s t-test, and reporting of the f or t statistic is included as per APA style guidelines. Differences in categorical data were examined using the Fisher’s exact test, two-way Chi Square test, or a three-way Chi Square test that in cases of overall significance, was followed by a post hoc Fisher’s exact test to identify which contingency table cells differed significantly from expected outcomes. The alpha level for statistical significance was set at 0.05, and the exact p value is presented.
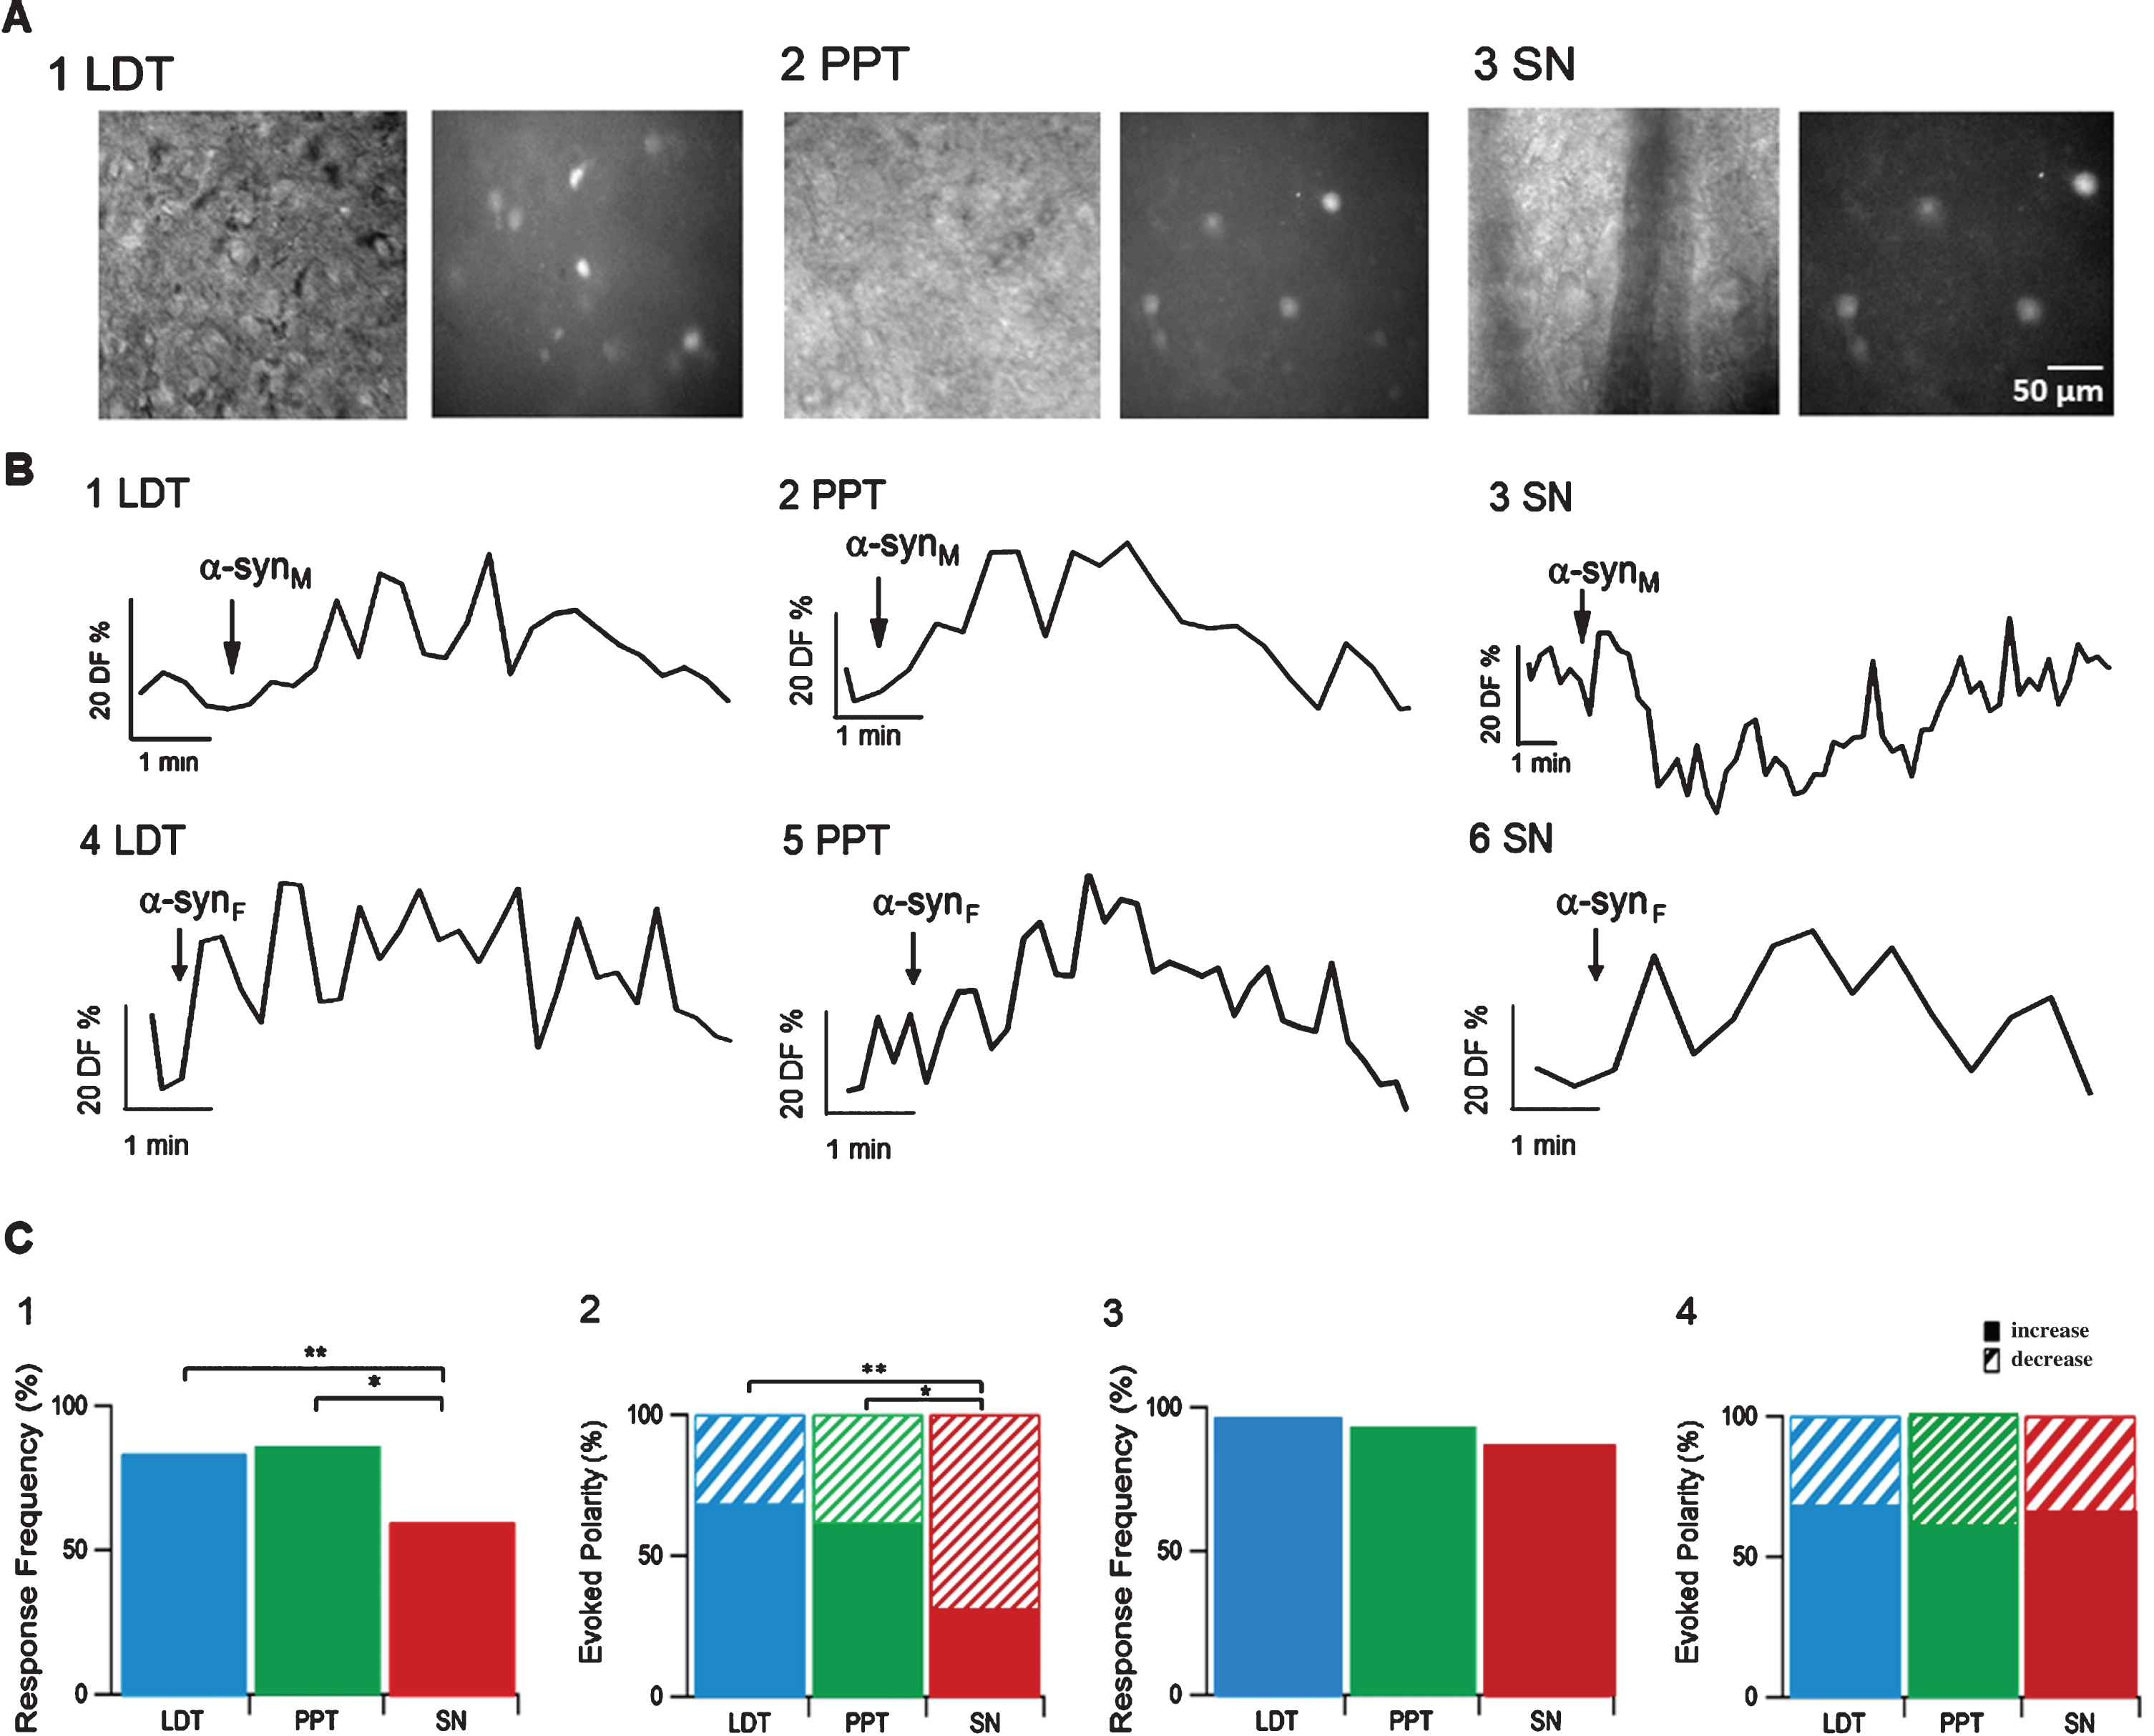
A) Representative image under bright field illumination and under fluorescence of fura-2 loaded neurons within LDT (A1), PPT (A2) and SN are presented (A3). Sample effects of monomeric and fibril α-syn on fluorescence indicative of alterations in intracellular calcium levels in LDT, PPT and SN are shown (B1-6). Summary data from the population of recorded cells showed that the proportion of cells responding to monomeric α-syn (C1), and the valence of calcium effects (C2) differed significantly between the sleep-related nuclei and SN. However, when nuclei were exposed to fibril α-syn, there were no differences between the three nuclei in the proportion of neurons responding (C3), nor of the valence of the response (C4).
RESULTS
α-syn fibrillation and characterization
α-syn monomer fractions were frozen in solution directly from size exclusion chromatography to avoid aggregate formation. A Thioflavin T (ThT) assay was used to monitor the fibrillation of α-syn, and displayed a typical sigmoidal curve indicating fibril formation (Fig. 1B1). The secondary structure of α-syn was investigated with CD showing the expected random coil for monomeric α-syn and β-sheet structure for the fibril form (Fig. 1B2).
Membrane responses
The monomeric and fibril forms of α-syn induced membrane currents in the majority of LDT, PPT and SN neurons. Surprisingly, the polarity of the elicited currents was opposite in the sleep-regulating LDT and PPT neurons to those elicited in the motor-controlling SN neurons. Inward currents were induced in the sleep-regulating nuclei (Fig. 1C1, 2), whereas, outward currents were elicited in SN neurons (Fig. 1C3). The proportion of LDT neurons and PPT cells responding to monomeric α-syn (100 nM) was greater than the proportion of SN neurons responding to this form of the protein (LDT: n = 35/35 and PPT: n = 8/8 vs. SN: n = 6/11; Fisher’s test; df:1, p = 0.003; df:1, p = 0.04, respectively, Fig 1C5). The fibril form of α-syn produced a significantly higher response rate in the SN than the monomeric form (Percentage Responding: Monomer: 54.5%, n = 6/11; Fibril: 100%, n = 7/7, Chi Square, df: 1, p = 0.0358, Fig. 1D4), and the amplitudes of the currents were significantly greater (Monomer: 15.1±3.9 pA, n = 6; Fibril: 33.7±4.1 pA, n = 7; Unpaired Student’s t-test, t(11) = 3.18, p = 0.008; Fig. 1D6). Within the LDT and the PPT, the proportions of cells responding to, and the amplitudes of inward current induced by α-syn were not significantly different for the two forms of the protein (Fibril LDT: n = 7; PPT: n = 8; Unpaired Student’s t-test, proportion responding: t(40) = 0.81, p = 0.7; Amplitude: t(14): 0.58, p = 0.5, respectively, Fig. 1D4, 6).
Calcium responses
α-syn altered the concentration of intracellular calcium in the majority of cells examined. Monomeric α-syn induced responses in most calcium indicator-labeled cells in the LDT (n = 56/68) and PPT (n = 34/41) (Fig. 2A, B). While the fibril form elicited calcium changes in even larger proportions of cells, this difference was not significant (LDT: n = 60/62, PPT: n = 56/60, Fisher’s test, df: 1, p = 0.0958; df: 1, p = 0.1155 Fig. 2C). Among responding LDT and PPT cells, the majority of changes in fluorescence induced by either form of α-syn indicated calcium increases (Monomeric: LDT: n = 38/56; PPT: n = 20/34; Fibril: LDT: n = 43/60; PPT: n = 34/56; Fig. 2C). Monomeric α-syn elicited calcium responses in a significantly lower proportion of cells in the SN (n = 34/60) than in LDT or PPT (Fisher’s test, df: 1, p = 0.001; df: 1, p = 0.0278; Fig. 2C). Further, a relatively higher proportion of cells in SN exhibited calcium decreases (n = 24/34) than in LDT or PPT (Fisher’s test, df: 1, p = 0.0005; df: 1; p = 0.0272; Fig. 2C). Interestingly, when the fibril form was applied, there were no significant differences between the proportions of cells responding in the SN (n = 51/56) from those in the LDT or PPT (Chi Square test, df: 2, p = 0.429; Fig. 2C). Further, of those SN cells responding to the fibril form, more showed increases in fluorescence (n = 39/51) than decreases (n = 13/51) (Fisher’s test, df: 1, p < 0.00001, n = 39/51), and the distribution of the direction of responses did not differ between nuclei (Chi Square Test, df: 2, p = 0.237, Fig. 2C). Recovery to baseline and rises in calcium induced by a subsequent application of 1μM AMPA (α-amino-3-hydroxy-5-methylisoxazole-4-propionic acid; 3 ml) confirmed in LDT cells that changes in calcium by α-syn were not due to acute cell death. The average amplitude of AMPA-mediated rises was 37.3±5.9% DF/F (n = 5; data not shown), which is similar to that seen in other studies (% DF/F: 34.7±6.5; [33]).
Neurotoxicity assays
As we hypothesized that continuous exposure to the monomeric form of α-syn could have adverse effects on LDT and PPT neurons, but not on SN cells, we examined neuronal death induced by relatively brief, but continuous exposure to α-syn via DAPI/PI labeling or bNOS immunohistochemistry. For DAPI/PI labeling, LDT and SN slices were incubated in monomeric α-syn (100 nM) or control solution for 7½ hours and cell viability fractions were calculated as the ratio of living cells (DAPI-positive) to the total number of cells (DAPI-positive+PI-positive). Relative to control slices, α-syn-exposed LDT slices exhibited a greater proportion of dead cells (Control: n = 4; α-syn: n = 7; Unpaired Student’s t-test, t(9) = 2.52, p = 0.03; Fig. 3A). Further, in bNOS immunohistochemistry studies, fewer surviving cholinergic cells (bNOS-positive cells) in α-syn-exposed slices were noted when compared to the other half incubated in control solution (Fig. 3B). Similarly indicative of heightened cell death in the PPT, we found a lower proportion of bNOS-positive cells in monomeric α-syn-exposed hemi-slices when compared to the other half of the slice, which was incubated for an equivalent period in absence of α-syn (n = 6; Paired Student’s t-test, t(5) = 3.331, p = 0.02; Fig 3B). However, SN slices showed no indication of heightened cell death over control (Control: n = 8; α-syn: n = 7; Unpaired Student’s t-test, t(13) = 0.04, p = 0.96, Fig. 3A. Cell death seen in LDT, PPT and SN slices after exposure to the fibril form of α-syn was significantly higher in the LDT (n = 6; Paired Student’s t-test, t(5) = 2.415, p = 0.03), PPT (n = 6; Paired Student’s t-test, t(5) = 2.350, p = 0.03), and the SN (n = 6; Paired Student’s t-test, t(5) = 2.185, p = 0.04) compared to control solution exposure (Fig. 3A).
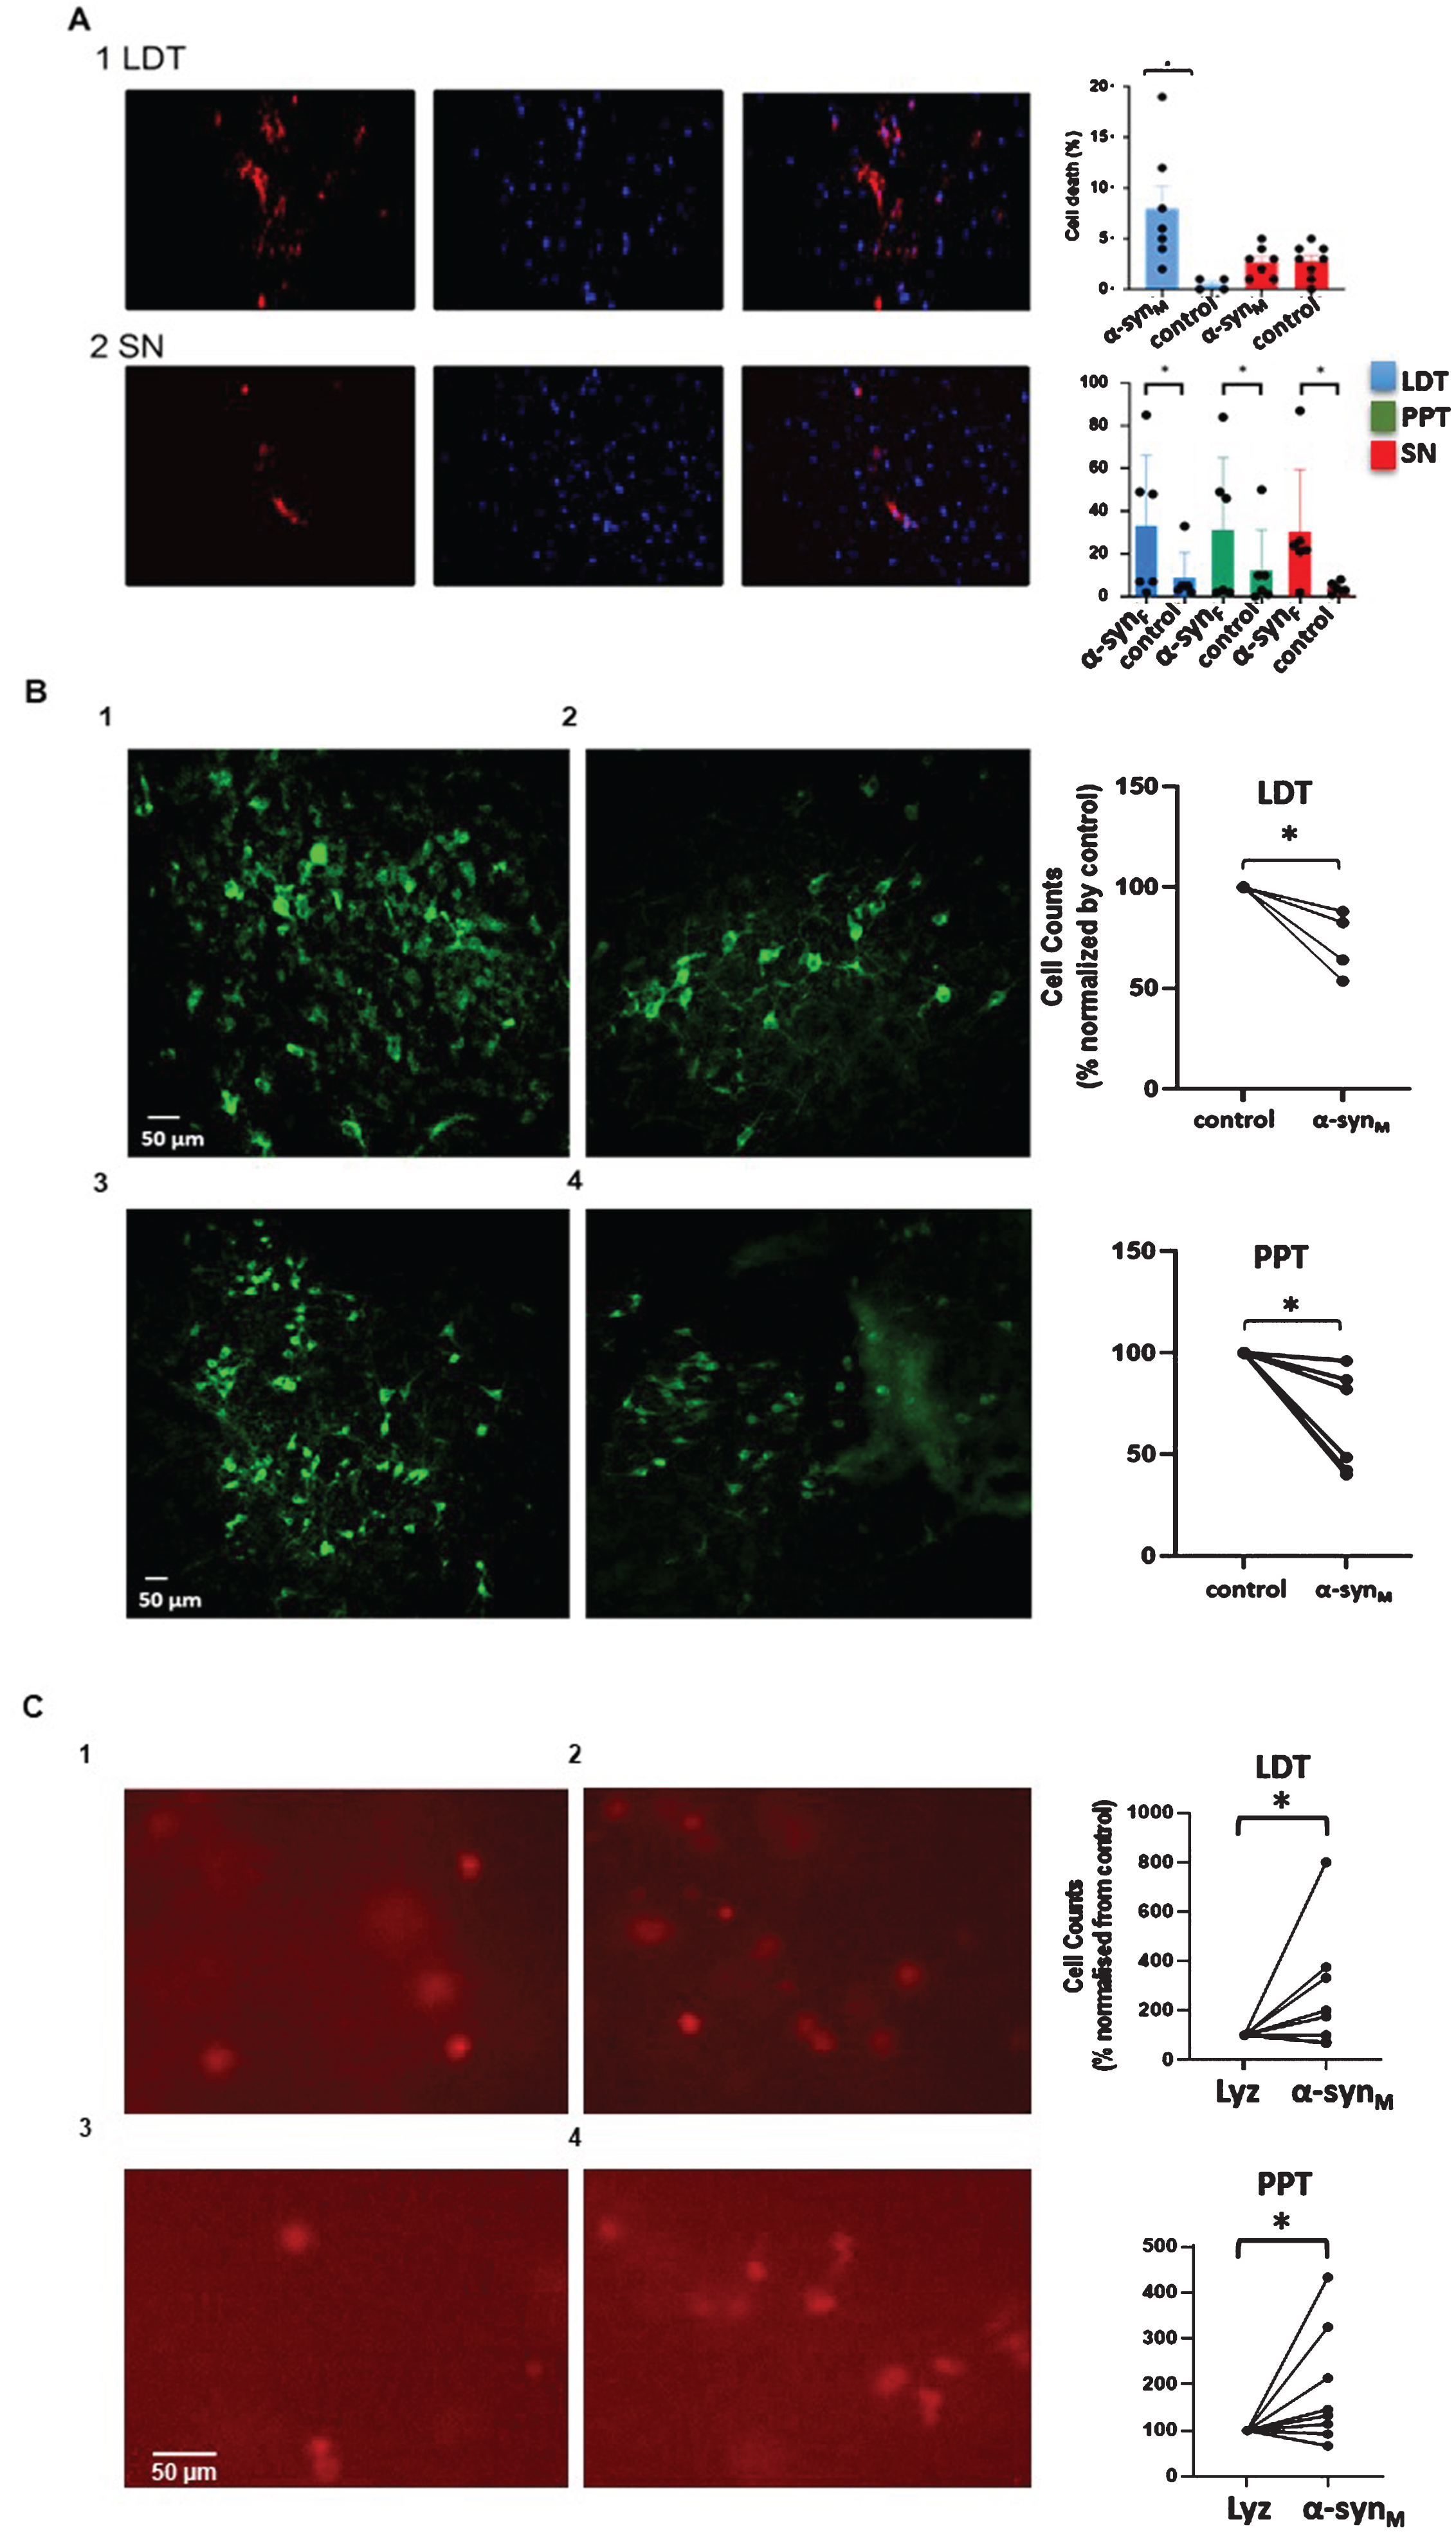
A) Monomeric α-syn facilitated cell death in the LDT and the PPT, but not the SN, whereas the fibril form induced greater cell death in all three nuclei. Fluorescent images of LDT (A1) and SN brain slices (A2) exposed to monomeric α-syn showing dead cells in red (PI-positive, left) and live cells in blue (DAPI-positive, middle) with the two fields overlaid (right). As shown in the bar graphs to the right (top), there was a significantly greater percentage of cell death over control in the population of LDT cells exposed to monomeric α-syn; whereas in the SN, cell death was not significantly different between control and α-syn-exposed slices. (A, right bottom) Bar graphs show DAPI/PI-assayed cell death induced by the fibril form of α-syn, which was significantly greater than in control studies in the LDT, PPT and SN. B) Quantification of bNOS-positive cells in bisected LDT and PPT slices revealed a smaller number of cholinergic neurons within monomeric α-syn-exposed half slices (B2, 4) when compared to the number in the equivalent region in the other half of the slice incubated in control solution (B1, 3) for the same time period. A count of bNOS-positive cells in the LDT revealed 14.7% fewer cholinergic cells in the monomeric α-syn-incubated, hemi-slices (200 nM; n = 2) relative to control, and 47.3% fewer when incubated in 500 nM (n = 2), which constituted a significant difference (Paired Student’s t-test; df: 6; p = 0.04 *p < 0.05). Within the PPT, 35% fewer cholinergic cells were noted in the half of the bisected slice which was exposed to 200 nM monomeric α-syn compared to the control half (n = 6; Paired Student’s t-test, t(5) = 3.331, p = 0.02). C) Fluorescent images of PI cells in the LDT (top panels) and PPT (bottom panels) in hemi-slices exposed to lysozyme (C1, 3) or monomeric α-syn (C2, 4) showing heightened cell death in the half of the slice exposed to monomeric α-syn. Paired plots are shown to the right, which demonstrated elevated cell death in cells exposed to monomeric α-syn compared to those exposed to lysozyme. These data support the conclusion that cell death seen in the LDT and PPT was not due to general protein effects, but rather was due to specific actions of monomeric α-syn.
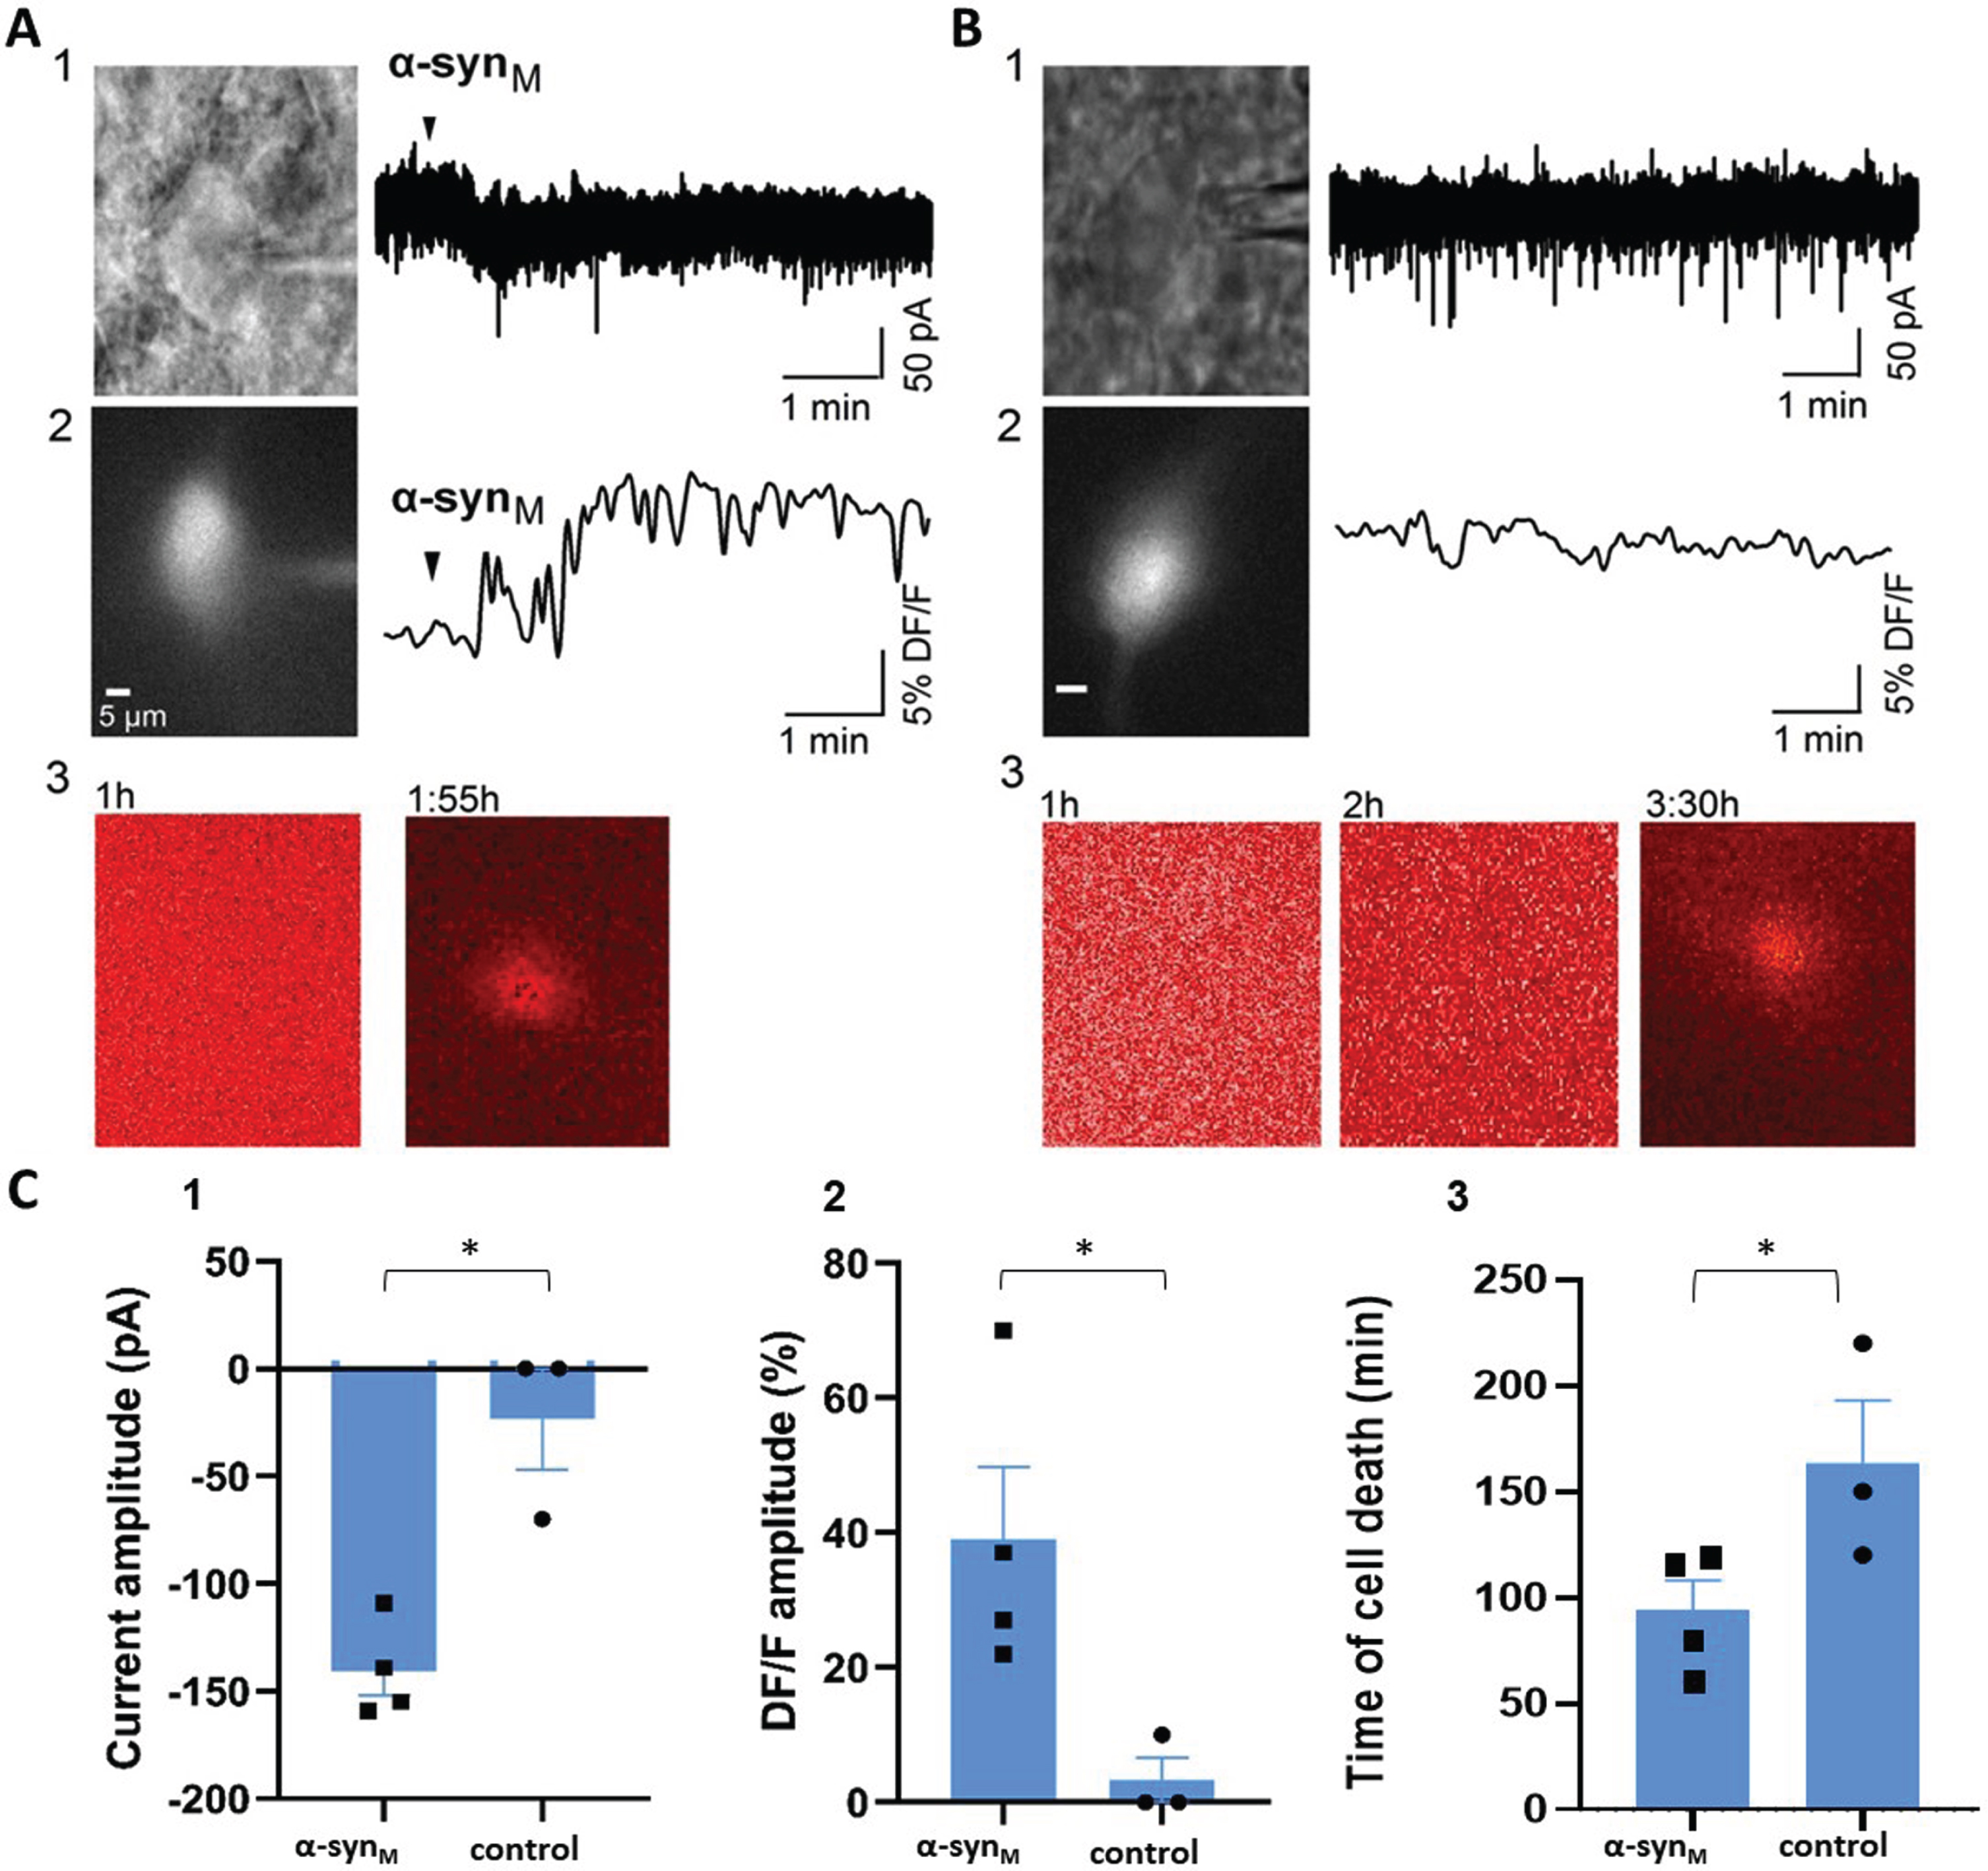
Real-time recordings of cell death were conducted in LDT neurons in which membrane responses and calcium rises were induced by α-syn. A) Representative example of the responses of a LDT neuron, which is shown in bright field in (A1), and in fluorescence in (A2), to application of monomeric α-syn. As can be seen, patch clamp recordings revealed induction of an inward membrane current (A1), and fluorescence changes indicative of an increase in intracellular calcium concentration (A2) following application of α-syn. Real-time visualization of the PI fluorescence signal in the same cell revealed cell death at 1 : 55 h following α-syn exposure (A3). B) Similar recordings were conducted in LDT neurons in control conditions, as illustrated by this example of a patch clamp recorded cell shown under bright field (B1), and under fluorescent optics in (B2). Recordings from control conditions at equivalent time points as in treatment sessions were conducted. We did not see any changes in membrane current or intracellular calcium levels similar to those observed following α-syn exposure. However, it should be noted that in control conditions, when the perfusion was halted, we observed a change in the membrane current in one recorded cell suggesting mechanical disturbance. Live cell imaging from the cell recorded under control conditions indicated that cell death occurred at 3 : 30 h (B3). C) Analysis showed that the same population of LDT cells which exhibited significantly different α-syn-mediated inward currents (Unpaired Student’s t-test, t(5) = 4.94, p = 0.004) (C1) and rises in fluorescence (Unpaired Student’s t-test, t(5) = 2.78, p = 0.04) (C2) from control also demonstrated significantly shorter cell lifetimes compared to control LDT neurons to which α-syn was not applied (C3).
In order to examine whether heightened cell death was specific to monomeric α-syn or merely due to high protein levels, we applied lysozyme to LDT and PPT slices. We found a significantly greater number of PI-positive cells in LDT and PPT hemi-slices exposed to monomeric α-syn, than in the other half of the same slice which had been exposed to lysozyme, suggesting that effects on cell death were specific to α-syn, and were not due to non-specific protein effects (LDT: 165% cell mortality rate increase, n = 8, Paired Student’s t-test, t(7) = 1.915, p = 0.04; PPT: 91% cell mortality rate increase: n = 8; Paired Student’s t-test, t(7) = 2.015, p = 0.04; Fig. 3C).
Single cell recordings of membrane effect, calcium influx and real-time, cell viability assay
As we observed effects on membrane currents, calcium levels, as well as heightened cell death by monomeric α-syn in separate populations of cells in sleep control nuclei, we next examined whether those effects co-occurred in the same cell. As these studies were difficult to execute because they required long recording times, we only conducted them in the LDT to confirm that the membrane events, calcium changes, and cell death co-occurred in the same neuron. Thus, in LDT slices exposed to a high concentration of monomeric α-syn (500 nM), we tracked neuronal viability in real-time using PI fluorescence and, within the same neuron, we monitored the membrane current and intracellular calcium response. As control, the same protocols were conducted in the other half of the slice, which was not exposed to α-syn. In all neurons tested, α-syn induced inward currents (–140.5±11.3 pA, n = 4), and an increase in intracellular calcium levels (39.7 ± 10.7 % DF/F, n = 4), which were significantly different from control conditions (Fig. 4A-C). Subsequent real-time recordings of PI fluorescence showed a significantly shorter lifetime of the cells which were α-syn-exposed compared to control cells (α-syn: 93.7±14.3 min; n = 4, control: 163.3±29.6 min, n = 3, Unpaired Student’s t-test; t(5) = 2.3; p = 0.04; Fig. 4C3).
DISCUSSION
The most common SDs PD patients experience prior to the disease-defining motor symptoms are RBD and EDS [19, 34–36]. While the mechanisms underlying RBD and EDS are unclear and could be multi-factorial, given the known functions of the LDT and PPT, these nuclei likely play a role in symptoms of both of these SDs [11, 38]. More specifically, cholinergic neurons within the LDT and PPT are believed to modulate arousal and maintenance of wakefulness, as well as initiate motor atonia during REM sleep, with the LDT likely playing a greater role in REM sleep atonia than the PPT [39] (for review, see [40]). Based on the role of the LDT and PPT in controlling sleep and wakefulness behaviors shown to be dysfunctional prior to, and after development of PD motor signs, we hypothesized that processes occurring early in PD affect neurons involved in state control. Consistent with this hypothesis, we found that within the LDT and PPT, in addition to excitatory currents, monomeric α-syn induced intracellular calcium increases, which could trigger calcium-dependent apoptotic processes of cell death. This conclusion is supported by our findings of cell death promotion in the LDT and PPT by even relatively brief exposure to a form of α-syn, which did not induce damaging effects in a motor control nucleus in our study, or in other studies [27]. While we did not conduct an exhaustive study of each phenotype within the LDT or PPT, we determined that numbers of cholinergic cells were significantly reduced by presence of monomeric α-syn, which is interesting in light of very recent findings using DAPI staining of an α-syn-mediated pathology selective to cholinergic PPT cells, and older work showing a high cholinergic depletion in the LDT and PPT in patients with Lewy body disease, which is characterized by α-syn inclusions [41, 42]. Further, cholinergic signaling is normal in PD patients without RBD, but significant cholinergic cell denervation is present in PD patients with this SD [43]. Finally, we confirmed that membrane actions and rises in calcium were associated with shortened cell life in the same LDT cells. Our data support the hypothesis that in early stages of PD, and even prior to clinical recognition of presence of this disease, rising levels of the monomeric form of α-syn lead to excitotoxic cell death of neurons of the LDT and PPT, including among the cholinergic neurons which modulate cortical and behavioral arousal, as well as REM sleep-specific atonia. The early loss of the neurons of the LDT and the PPT could play a mechanistic role in the elevated EDS and RBD morbidity in the prodromal phase of PD.
Our proposal of a role of α-syn-mediated degeneration of the LDT and PPT in SDs prodromal to motor signs of PD is highly speculative. We have developed a systems-level hypothesis based on data collected from an ex vivo cellular study. However, in support of our hypothesis, using real-time quaking induced conversion analysis of cerebrospinal fluid from RBD patients, increased levels of α-syn were associated with an elevated risk of later life diagnosis of PD [18]. Degeneration of nuclei which are involved in sleep has been shown in PD patients, which suggests that cell death in sleep-controlling nuclei could result from α-syn-related pathology [23, 44]. In addition, neurodegeneration has been noted in RBD patients in the pontine reticular formation where the LDT and PPT are located [10, 16]. Interestingly, cats in which the PPT and LDT had been ablated displayed REM sleep without atonia, which were the first findings mechanistically linking the pons with this REM sleep-specific motor phenomenon [12, 45–49]. Those early studies were not able to selectively lesion individual nuclei within the pons, and, therefore, almost certainly ablation involved structures beyond the LDT and PPT. However, with the advent of optogenetics, studying nucleus-specific effects became possible. While modulation of the LDT and PPT has been conducted [50–52] as far as we know, no one has selectively and chronically inhibited the LDT and PPT to examine the outcome on sleep and wakefulness behaviors, which could be functionally similar to degeneration of this region. However, optogenetic inactivation of the sublaterodorsal tegmental nucleus in rodents, which is located in the caudal LDT, did induce RBD behavior [53]. Interestingly, the prodromal SD profile seen in many PD patients is believed to be due to the early brain stem degeneration, which has been suggested to be caused by a body-first transmission pattern in which α-syn propagates from the periphery to the brain via the autonomic nervous system [16, 54]. Such rostral spread of α-syn could lead to dysfunction of brainstem-controlled processes prior to loss of motor function. This is supported by recent imaging studies in idiopathic RBD patients which revealed brain stem degeneration similar to that seen in PD patients who presented with RBD, but absent in PD patients who were RBD negative [16], as well as findings that levels of dopamine in the putamen were unaffected in the idiopathic RBD group [54].
While the early ablation studies in cats do suggest that inhibition of the LDT and PPT result in a condition resembling RBD, it is important to note that imaging data leading to the body-first hypothesis do not support the conclusion that degeneration of just one brain stem nucleus is involved in generation of RBD [54]. In addition, while the role of the LDT and PPT in RBD in a patient with Lewy Body disease, which is characterized by α-syn inclusions, was considered probable, the lack of marked degeneration of the LDT and PPT lead the authors to conclude that degeneration of these nuclei was not central in this case [9]. However, in the latter study, tissue was not prepared in a manner allowing detailed neuronal quantification, and degeneration was observed in the pontine tegmentum that could not be ascribed to any specific nucleus [9]. Further, loss of LDT and PPT activity is not likely to result in a state identical to that exhibited by EDS patients, as this disorder, while poorly understood, is classified as a broad condition with different manifestations, which likely arises from several different neural pathologies that could, for example, source from dysfunction of arousal-promoting centers in the hypothalamus or basal forebrain, as well as dysregulation within the brain stem [19, 55]. However, the well-known role of the LDT and PPT in arousal does suggest that alteration in functionality of these nuclei would induce a state of low arousal. To fully examine the role of the LDT and PPT in RBD and EDS, selective, long-term inhibition of phenotypically-identified cells in these nuclei should be examined along with behavioral state. Moreover, to determine whether RBD or EDS is due to nucleus-specific degeneration, imaging utilizing high spatial resolution scanners needs to be conducted in the brain stem of SD patients, and any apparent neurodegenerative processes need to be charted across time. Currently, the North American Prodromal Synucleinopathy (NAPS) consortium is initiating clinical trials in RBD patients for treatments against neurodegenerative diseases (https://www.naps-rbd.org/participate). These trials involve long-term collection of biomedical information, which could lead to availability of such data in the future. Further, while difficult, the involvement of α-syn-related pathology of other nuclei that have been implicated in control of SDs needs to be investigated in RBD as well as EDS patients and correlated with eventual appearance of α-syn-related diseases, including PD.
While our findings support the speculation that monomeric α-syn-induced, excitotoxicity-mediated neuronal death starts early in the LDT and PPT, and involves cholinergic neurons within these nuclei, they also suggest the intriguing possibility that a neuroprotective process occurs in SN neurons at this early PD stage. Inhibitory current induced in SN neurons could be due to effects on activity of ATP-sensitive K+ channels, as shown in insulin-secretory granules and later, in hippocampal neuronal culture [56, 57]. In a high proportion of dopamine- and non dopamine-containing SN cells, in addition to inhibitory currents, α-syn elicited decreases in intracellular calcium. This effect could be caused by activation of SERCA pumps which appear responsible for reductions in calcium induced by α-syn in cell culture models [58]. Interpreted with reference to previous studies, our results, thus, suggest that, while initially protective, exacerbation of the inhibitory effect induced by fibril α-syn could eventually lead to cell death, as it is well documented that dopaminergic SN neurons require a baseline level of activity to ensure their survival [59], and therefore, sustained inhibition may become counterproductive by leading to hypoactivation and degeneration of SN neurons.
Several caveats exist in our interpreting the results of our study. We used brain slices from young, male mice. In humans, it is highly likely that the brain would not be exposed to altered levels of monomeric α-syn until a comparatively later point in the lifespan. It is possible that the cellular responses of neurons to α-syn differ in younger vs older neurons. As only tissue from males was used, we are precluded from making any conclusions regarding potential sex-differences in our results. REM-sleep behavior disorder occurs with a higher frequency in males, as does PD [62], and after diagnosis, the occurrence of RBD and EDS in males is higher than in females with PD, which in the case of EDS is not a sex disparity seen in the general population [63]. Thus, future studies should investigate potential sex-based, differential cellular effects of α-syn on nuclei controlling SDs. In addition, the concentration of α-syn peptide used in our study was several-fold higher than the normal interstitial concentration of this peptide in mice, which ranges from 14 to 69 picograms [60, 61]. Accordingly, effects could be due to non-specific peptide actions. Our concentration curves showing a greater effect on the membrane of an increasing concentration of peptide do not rule out such non-specific effects. However, we did use a control solution of lysozyme, which is a protein of comparable size to α-syn, and found that at the same concentration as that used of α-syn, lysozyme did not elicit membrane effects, and cell death associated with α-syn was higher than that associated with lysozyme in the other half of a bisected slice, suggesting that effects were specific to α-syn, rather than due to high levels of protein.
Another caveat with our study is that we do not know the mechanism by which monomeric α-syn elicited cell death in the LDT and PPT. We speculate that cell death increases seen in LDT and PPT involve excitotoxity, however, we did not directly examine this, nor the processes by which α-syn could lead to excitotoxicity, which remains for future studies. Current theories of the toxicity of α-syn center on the ability of this protein to cause transmembrane seeding, leading to intracellular protein aggregations which are associated with toxic cellular events. Interestingly, such a process has been shown to occur when monomeric α-syn is applied exogenously [64]. However, this process depends on several factors including temperature and salt conditions, and in another study, injection within the PPT of monomeric α-syn was not associated with markers of aggregation [41, 64]. When taken together these results call into question whether seeding and aggregation events are occurring to a meaningful degree in our study. Thus, it is difficult to say whether the toxicity we see elicited in LDT and PPT ex vivo by the monomeric form would occur in vivo, and if so, whether the toxicity would be mechanistically similar to that which would be seen in vivo.
Exposure to the fibril form of α-syn caused neurodegeneration in the LDT, PPT and SN, which provides more data to the literature that this structure of the protein is toxic to neurons [65, 66]. Our data showing that monomeric α-syn can be toxic is novel as studies of other cell types did not find monomeric α-syn to induce cell death [27, 67]. Since we do not know the mechanism leading to cell death, it is unclear why LDT and PPT neurons are so relatively vulnerable. However, our data do contribute to the literature in support of the emerging viewpoint that rising levels of monomeric α-syn could be deleterious. Current theories posit that elevated levels of monomeric α-syn lead to formation of more toxic forms across the entire protein conformation spectrum, which differs from the older concept that the more damaging structural forms could exist in a non-toxic conformation that would alter and become toxic [68]. Supporting this view are findings that shifting the levels of the monomeric form can lead to protein aggregations [68]. Regardless, while we do not know how monomeric α-syn leads to cell death in the LDT and PPT, when taken together, our study and other studies support the development of strategies to reduce levels of the monomeric form in order to limit neurodegeneration [69, 70].
In summary, using multiple, naturally-occurring isoforms of α-syn, which were carefully prepared and validated, our study is the first to report membrane effects of pure monomeric and confirmed fibril forms of α-syn in native, mammalian neurons when extracellularly applied; moreover, our findings indicate the toxic potential of the monomeric form of this protein in brain stem nuclei which could control behaviors that are commonly aberrant during the prodromal phase of PD. Furthermore, our findings document a functional difference in cellular responses to α-syn between LDT, PPT and SN neurons, thus providing data toward a mechanistic explanation regarding why SDs precede motor symptoms in PD. The hypothesis that monomeric α-syn is toxic to some neurons, and could lead to non-motor symptoms during the prodromal phase of PD requires further examination. Future experiments including those using transgenic, monomeric α-syn-overexpressing rodents will need to be conducted to specifically examine our hypotheses that rising levels of monomeric α-syn are associated with degeneration of the LDT and PPT, and appearance of behavioral state disturbances. Further studies should be designed to elucidate the neuropathological cellular effects of α-syn by examination of mechanisms underlying the sensitivity of the LDT and PPT neurons, including the cholinergic neurons, to the monomeric form of α-syn.
CONCLUSIONS
We suggest a novel mechanism to explain the presence of sleeping disorders in PD prior to appearance of motor disturbances. In the PD brain, levels of the monomeric form of α-syn rise which is associated with seeding leading to formation of aggregates that lead to neurodegeneration of SN cells. However, our data raise the question whether the monomeric form itself confers a direct neurodegeneration risk to brain stem nuclei. We show that LDT and PPT neurons which play a role in control of maintenance of aroused wakefulness and induction of REM sleep atonia are sensitive to the monomeric form of α-syn as evidenced by membrane excitation, rises in intracellular calcium, and cell death. Although cell death was seen in the SN following exposure to the fibril form, effects similar to those seen in the LDT and PPT were not found in SN neurons in response to the monomeric form.
Our data showing selective vulnerability of the brain stem sleep control nuclei suggest a mechanistic basis regarding why sleeping disorders like EDS and RBD appear in patients up to decades before the presence of motor abnormalities that eventually lead to diagnosis of PD. Further, our data fit well with current models of a body-first modality of transmission of α-syn, as in this model, brain stem nuclei are exposed to elevated levels of the monomeric forms of the protein prior to more rostral brain structures. Our results form a basis for further investigations and a deeper understanding of the cellular mechanisms underlying α-syn effects resulting in non-motor symptoms in prodromal PD.
Footnotes
ACKNOWLEDGMENTS
We thank Dr. Arsenios Vlassis for contributions to the experimental design of imaging of cell lifetime.
This research was funded by Coordenação de Aperfeiçoamento de Pessoal de Nível Superior (CAPES), Brazil in the form of PhD Grant to Altair Brito dos Santos, with additional funding provided by the Department of Drug Design and Pharmacology at the University of Copenhagen. Line K. Skaanning and Annette E. Langkilde received financial support for the resources used in this study from the Lundbeck Foundation Initiative BRAINSTRUC (2015-2666, Denmark). None of the funders had any control over study design. No other funding was received for the work presented in this report.
CONFLICT OF INTEREST
All authors declare that there are no conflicts of interest in regard to this manuscript.
PREPRINTS
An earlier version of this work was uploaded on Research Square in the form of a preprint with the DOI: 10.21203/rs.3.rs-134060/v1.