
Abstract
Background:
Clinician-based rating scales or questionnaires for gait in Parkinson’s disease (PD) are subjective and sensor-based analysis is limited in accessibility.
Objective:
To develop an easily accessible and objective tool to evaluate gait in PD patients, we analyzed gait from a single 2-dimensional (2D) video.
Methods:
We prospectively recorded 2D videos of PD patients (n = 16) and healthy controls (n = 15) performing the timed up and go test (TUG). The gait was simultaneously evaluated with a pressure-sensor (GAITRite). We estimated the 3D position of toes and heels with a deep-learning based pose-estimation algorithm and calculated gait parameters including step length, step length variability, gait velocity and step cadence which was validated with the result from the GAITRite. We further calculated the time and steps required for turning. Then, we applied the algorithm to previously recorded and archived videos of PD patients (n = 32) performing the TUG.
Results:
From the validation experiment, gait parameters derived from video tracking were in excellent agreement with the parameters obtained with the GAITRite. (Intraclass correlation coefficient > 0.9). From the analysis with the archived videos, step length, gait velocity, number of steps, and the time required for turning were significantly correlated (Absolute R > 0.4, p < 0.005) with the Freezing of gait questionnaire, Unified PD Rating scale part III total score, HY stage and postural instability. Furthermore, the video-based tracking objectively measured significant improvement of step length, gait velocity, steps and the time required for turning with antiparkinsonian medication.
Conclusion:
2D video-based tracking could objectively evaluate gait in PD patients.
INTRODUCTION
Parkinson’s disease (PD) is a neurodegenerative disease characterized by bradykinesia as a core clinical symptom, accompanied by rigidity or resting tremor [1]. Besides these cardinal symptoms, gait disturbance is frequently seen in patients with PD and is characterized by short steps, slow gait speed with festination or freezing of gait [2, 3]. Gait disturbances significantly affect the quality of life and can lead to fall-related injuries which is related to mortality risk in PD [4, 5]. Therefore, it is important to identify and monitor gait disturbance in patients with PD. Currently, the Unified PD Rating Scale (UPDRS) part III, a clinician-measured evaluation of parkinsonian motor symptoms, is the most widely used scoring system for clinical and research purposes [6, 7]. The UPDRS part III has an item for evaluating gait (item 10); however, the scores are semi-quantitatively measured with high inter-rater and intra-rater variability [8, 9]. Moreover, the gait item ranges from 0 (normal) to 4 (severely impaired) and the scores are rated with the overall observation of gait speed, step length and turning. Thus, the score may reflect the overall gait performance of the PD patients, but the 5-point score system is not sufficient to capture the complex aspect of parkinsonian gait. Although there are more sophisticated questionnaires and clinical rating systems for gait in PD including the freezing of gait questionnaire (FOG-Q) or the Tinetti gait and balance score [10–12], they are also limited by their semi-quantitative nature with inter- and intra- rater variability [13]. Therefore, it is difficult to objectively evaluate and monitor gait disturbance with a current clinician-dependent rating of gait.
In this perspective, there have been many studies targeting objective measurements of gait in PD patients using wearable sensors, pressure sensor mat or motion capture system [14, 15]. These methods revealed the complex and nuanced characteristics of parkinsonian gait [16, 17]. Currently, the pressure sensor mat system has been widely used in gait analysis in PD in clinics. Also, 3D motion capture system provided a comprehensive and detailed measure of gait analysis in PD [18]. However, these methods are limited by their accessibility as the measurement requires devices and appropriate setup which are ideally done in the lab thus may not be able to reflect gait in natural settings [14]. Previous studies using wearable sensors in gait analysis showed the potential to be used in clinical practice and research [14, 19]. These studies performed gait analysis with single or multiple sensors including accelerometer or gyroscope installed in the ear, shoes, limbs or the trunk [19]. Wearable sensors have been continuously developed to be portable with an affordable cost which is becoming more accessible. However, the methods require IMU (inertia measurement unit) devices to be attached or installed to the participants. The accessibility is further reduced when the installation of multiple sensors is required [19].
2D video is widely used in clinics or at home for recording parkinsonian motor symptoms including gait, tremor and bradykinesia due to easy accessibility [20]. However, videos are usually subjectively evaluated by clinicians rather than quantitatively analyzed. Recent studies showed that using video-tracking of the 2D videos enables objective measurement of parkinsonian motor symptoms such as limb bradykinesia [21, 22]. However, the simple application of 2D videos for gait analysis is limited as evaluation of gait requires 3D information. There have been attempts to use a 3D-depth camera or to measure gait parameters [23]. However, the hardware and software require costs and setups which is not easy to access.
A recent development in computer vision enables reliable estimation of the 2D joint position of the human in images or videos with varying environments including lighting and angle of view [24, 25]. The algorithm outputs joint position (e.g., knee, ankle, foot and hip) in the plane of 2D image-plane in each frame of a video. Furthermore, 3D motion reconstruction from the 2D pose in the image or video has been proposed without any markers or manual labeling [26–28]. To develop an easily accessible and objective tool to evaluate gait in PD patients, we performed quantitative gait analysis in PD patients with a single 2D video which is easily accessible, cost-effective and without the attachment of markers or sensors. We validated the performance of video-based algorithm with the conventional pressure-sensor mat system (GAITRite). Consecutively, we applied the algorithm to the previously archived videos of the PD patients and analyzed the correlation with clinical parameters.
METHODS
Participants and collection of the videos
This study is composed of two main analyses. First, validation experiment of video-based analysis with pressure-sensitive gait analysis system (GAITRite) in prospectively recruited participants. Second, application of the video-based analysis to previously recorded and archived videos of PD patients.
For the validation of video-tracked gait analysis, we prospectively recruited 16 patients with PD and 15 healthy controls between May and June 2020. PD was clinically diagnosed according to the UK brain bank criteria [29]. Healthy controls were caregivers of the patients who were free of any neurological disease. As the estimated step length and gait velocity are lower in PD patients, we recruited healthy controls to validate the algorithm in long steps and fast gait velocities. Information regarding age, sex, and disease duration (in PD patients) are summarized in Supplementary Table 1. All the participants performed timed up and go test (TUG; round trip for 7 meters) at a corridor in the movement disorder center (Figs. 1 and 2). The TUG included the following phases: sit-to-stand, walking 7 meters (m) forward, turning around (180 degrees), walking 7 m back and stand-to-sit to the chair. The starting and turning point for each task were indicated by a horizontal line on the floor. The videos were recorded in the frontal view (patients walked toward and away from the camera). The video camera (HXR-NX5R, SONY, Japan) was fixed on a tripod 1.5 meters from the horizontal line of the turning point where all reference points (starting and turning point, corners from the walls and ceiling, Fig. 1) are within the video frame. The camera remained in the same location during the recording. The videos were recorded in 30 frames per second with 1920x1080 resolution. The videos were not zoomed in or out and all body parts were within the frame during the recording. A pressure-sensitive gait analysis system (GAITRite, CIR System INC., Franklin, USA) was used to measure the ground truth parameters of gait. The GAITRite was installed in the middle of the walkway (Figs. 1 and 2).
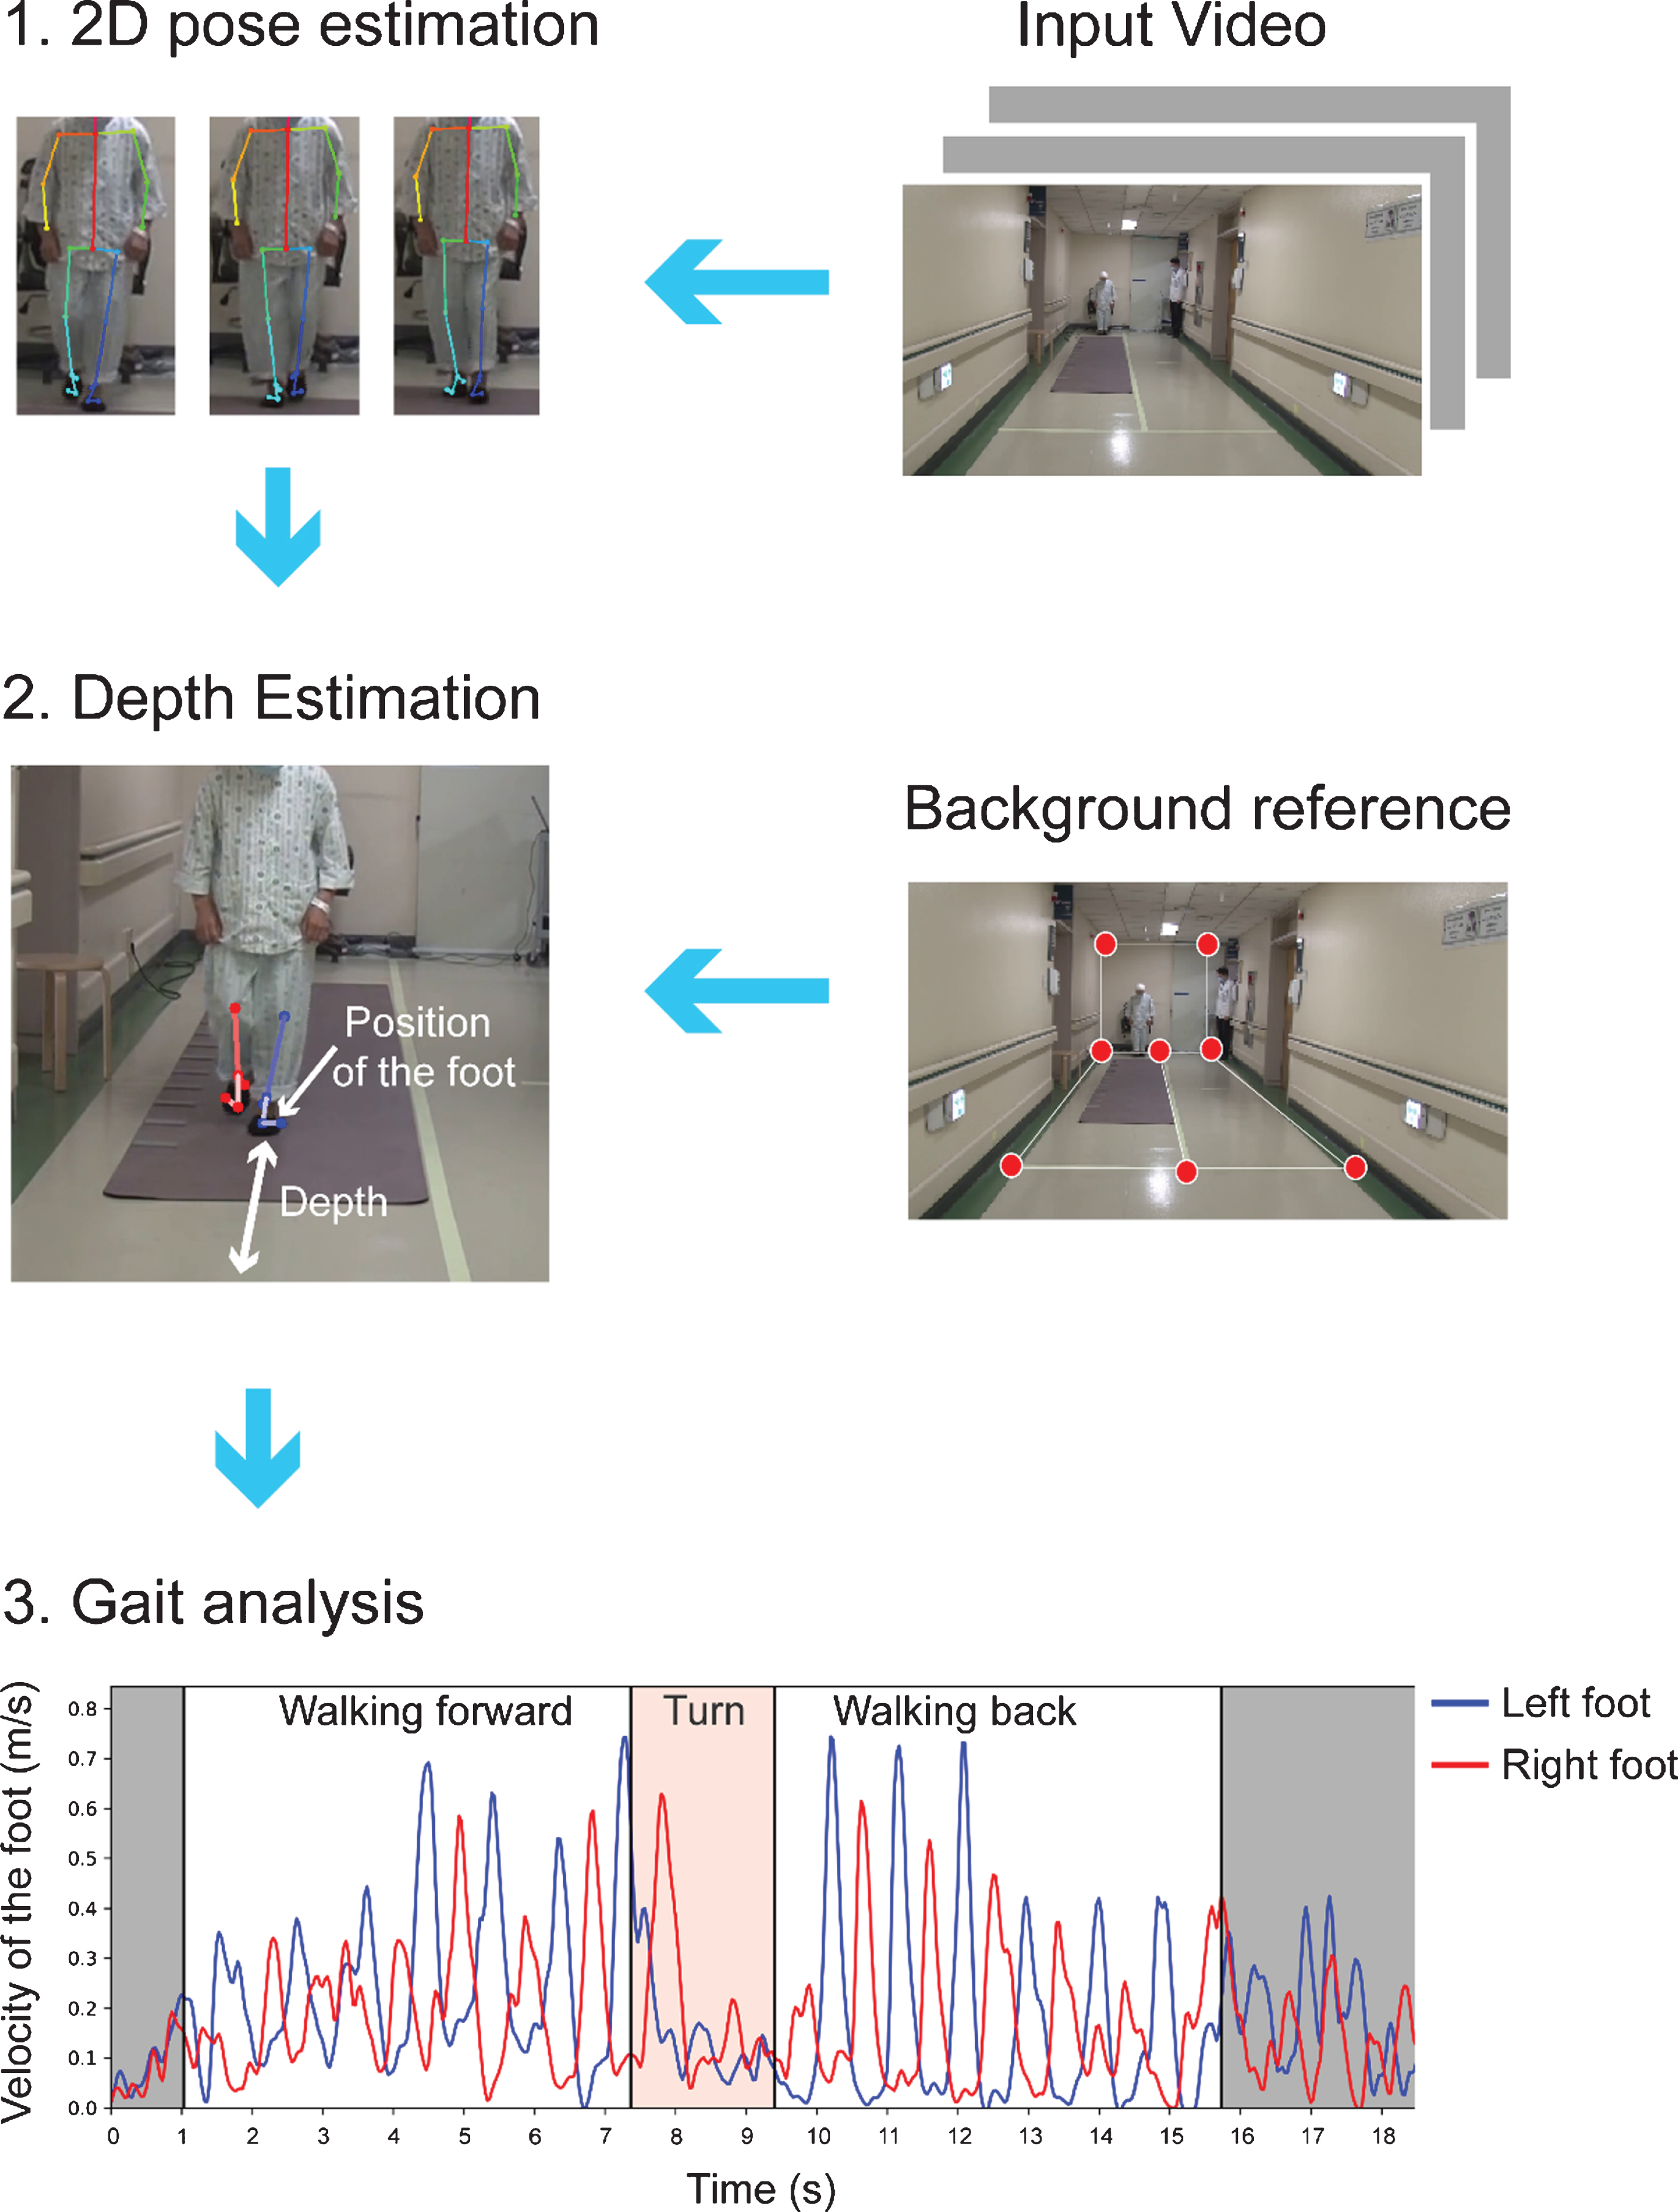
Schematic diagram of the workflow of the video-based gait analysis. Flow diagram of the analysis scheme. The TUG was classified into three parts: walking forward, turn, and walking back. Gray zone indicates standing up and sitting.
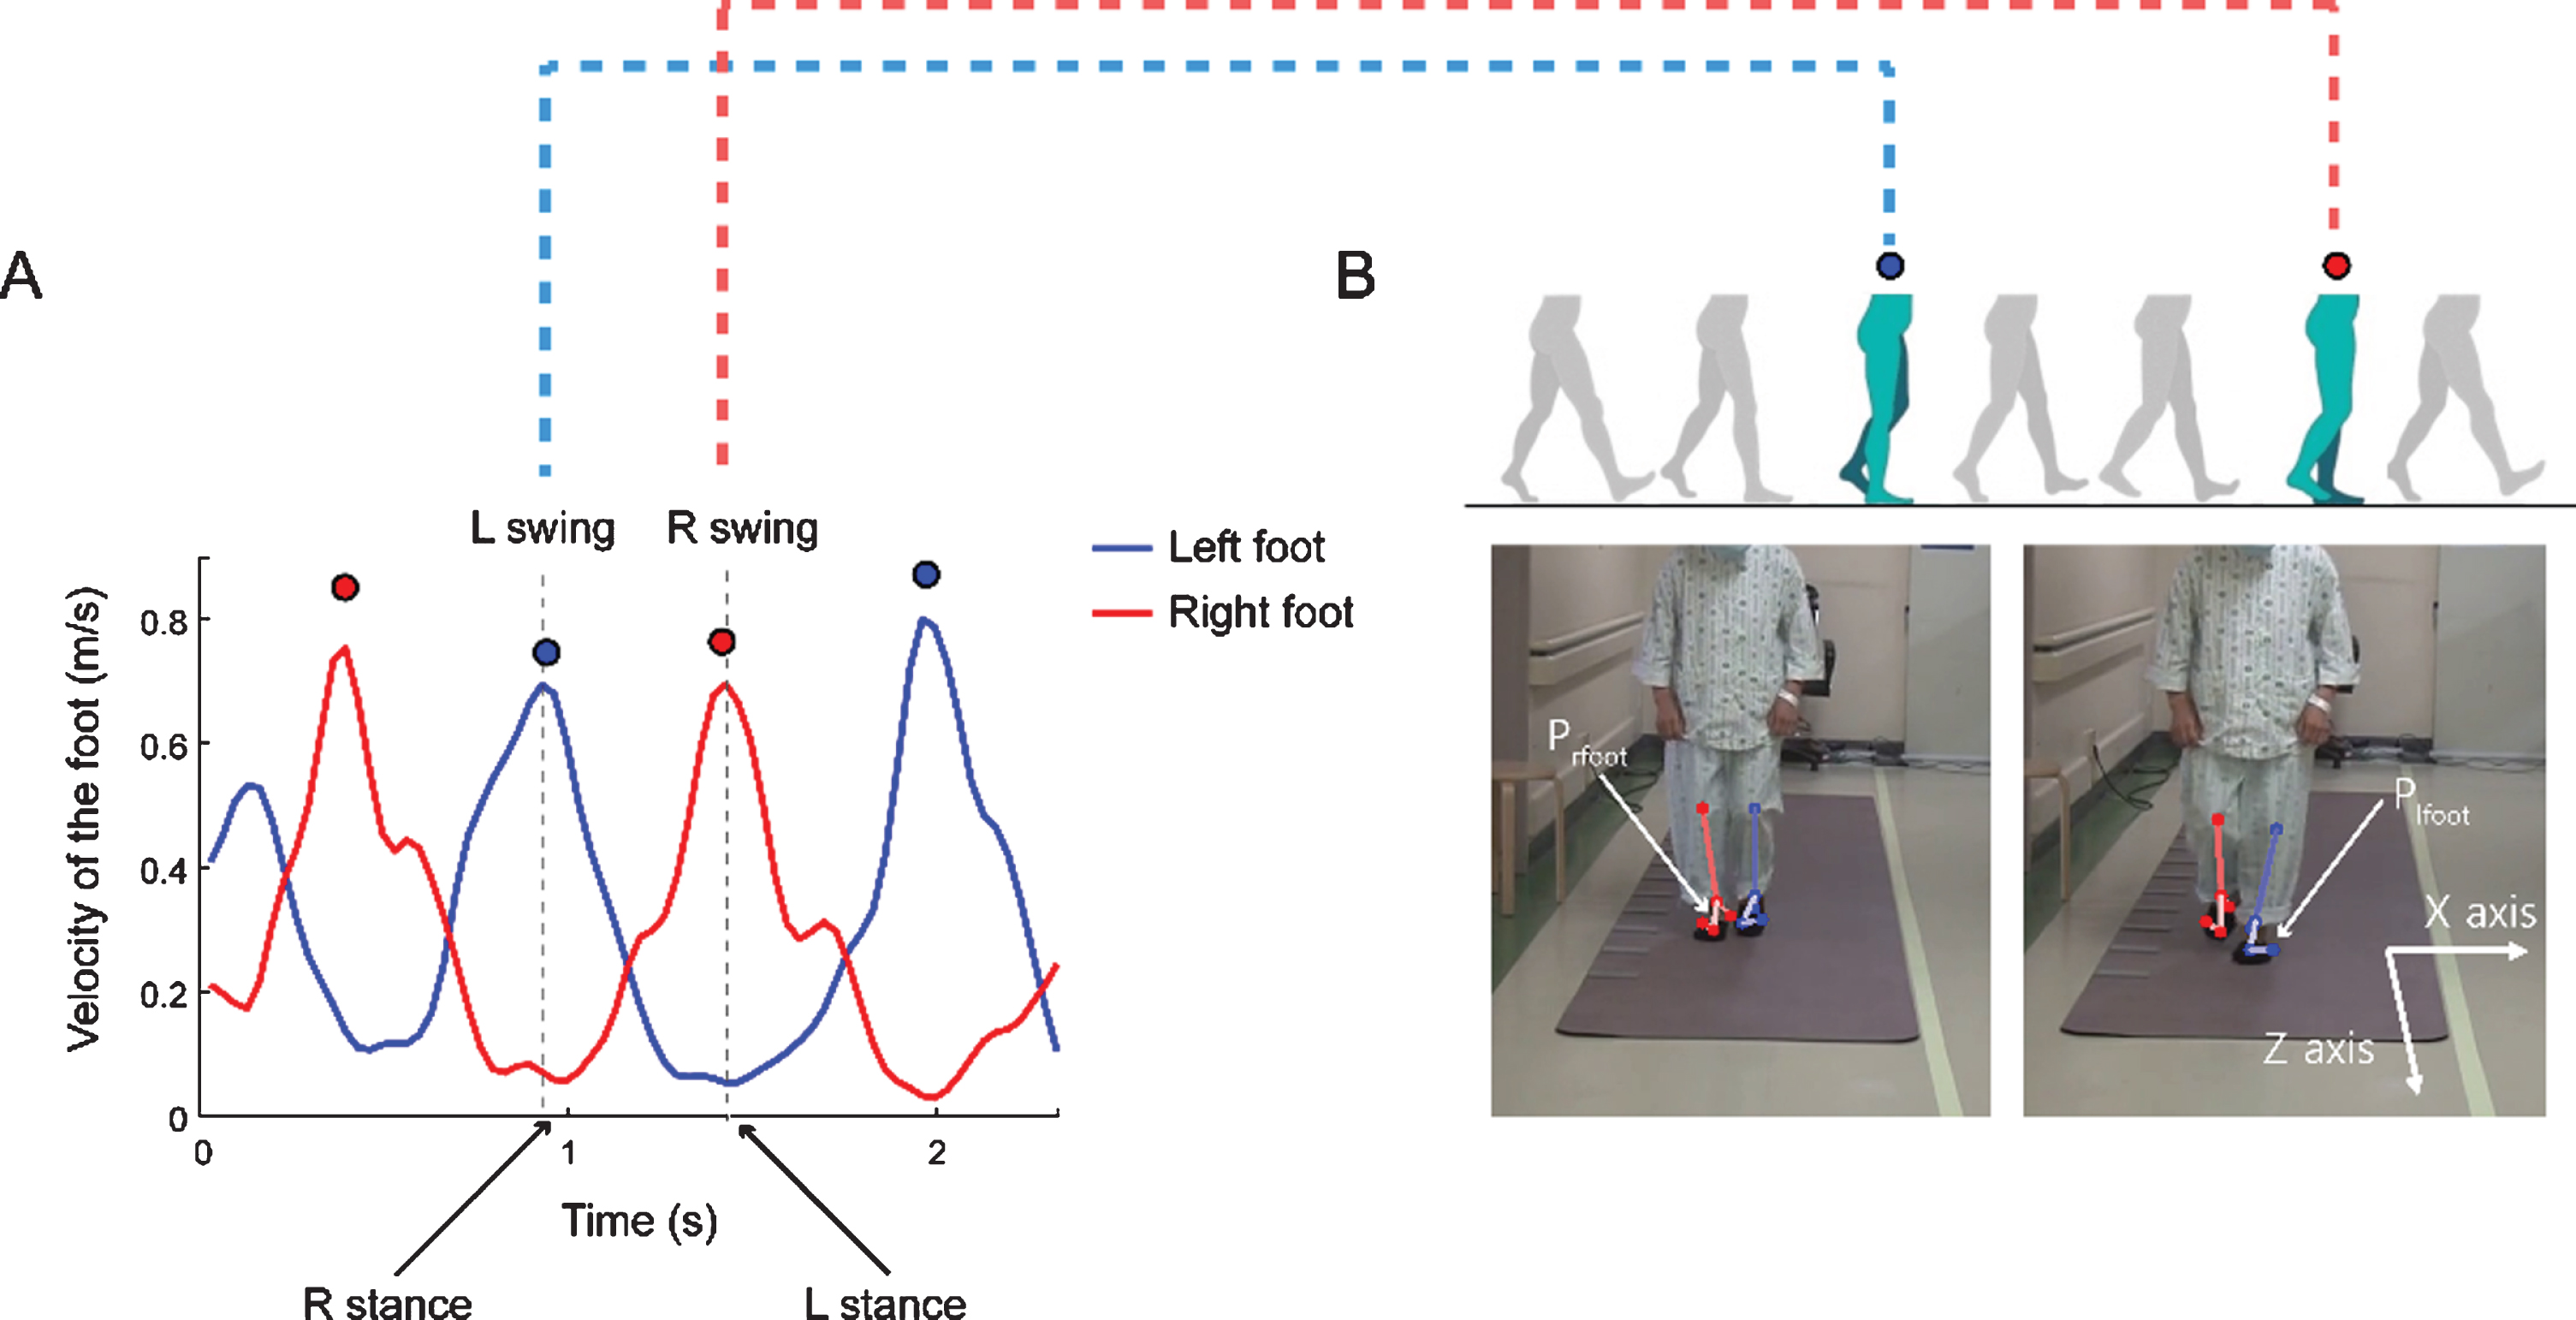
Calculation of the depth of each step during the TUG. A, B) From the velocity trace from both feet during the TUG, we found the local peak from both trajectories. A) Example velocity traces for both feet during walking forward (walking toward the camera). Red dots and blue dots indicate the local peaks of the right and the left heel velocity values, respectively. B) The video frame corresponds with the marked dots in panel A. Prfoot and Plfoot denote the position of the right and left feet, respectively. We defined the depth of each foot during the stance phase (fixed position on the ground) at the time of the swing phase of the other foot (local peak velocity).
Consecutively, we retrospectively collected videos of the TUG task in PD patients who were admitted to our movement center for pre-operative evaluation of deep brain stimulation (DBS), between February 2016 and January 2018. All the enrolled patients were clinically diagnosed with PD according to the UK brain bank criteria [29] and were followed-up for more than five years. Baseline characteristics are summarized in Table 1. The TUG was done as part of a quantitative evaluation of motor symptoms along with the evaluation of UPDRS parts I∼IV and freezing of gait questionnaire (FOG-Q). The videos of the TUG task were recorded with the same protocol of the above validation experiment but some videos did not meet the required criteria. Thus, after reviewing all the videos recorded during the inclusion period, we included the videos according to the following exclusion criteria: 1) Those who were not able to walk unassisted in medication off state; 2) Videos recorded with zooming-in or camera moved during the TUG; 3) Videos with the part of the body getting out of the frame during the TUG; 4) The videos with a nearby person covering the target; 5) Videos with missing reference background point. In the archived videos, the patients were evaluated in both medication on and off state during the admission. We video-recorded the patients in the early morning (7-8 AM) with medication withheld at least 12 hours overnight (medication off state). After the medication off evaluation, we video-recorded the patients at the time of maximal improvement of the clinical symptom after first-morning medication (medication on state).
Reliability of gait analysis between Gaitrite and video-based tracking
*Mean and the standard deviation from the GAITRite (pressure sensor) gait analysis except for the number of steps required for turning. The number of steps required for turning was manually counted. Unit is centimeter, centimeter/second and steps/min for step length, velocity and cadence, respectively. Absolute bias is presented as centimeter, centimeter/second and steps/min in step length, velocity and cadence, respectively. Walking forward and walking back represent walking toward and away from the camera, respectively. The cut-off between short and long steps was defined as the mean step length of all participants (56.85 cm) in the validation experiment. ICC, Intraclass correlation coefficient.
Standard protocol approvals, registrations, and patient consents
All the recorded videos were archived in the video-database in the Movement Disorder center in SNUH. Access to the videos was strictly restricted to the authorized investigators only (JHS, RY and CYL). The derived gait parameters and clinical parameters were anonymized and then analyzed. All the prospectively enrolled participants gave written informed consent. When we used the previously archived videos of PD patients, we used videos of the patients who gave written informed consent to use the videos for academic purposes. The Institutional Review Board of Seoul National University Hospital approved this study (1908–175–1059).
3D Pose estimation from 2D video
We used a real-time framework (OpenPose [24]) for 2D joint detection, which uses part affinity fields to detect each body point. A total of 25 points (i.e., bilateral eye, ear, nose, shoulder, elbow, wrist, hip, knee, ankle, heel, big toe, and little toe) were automatically labeled in every frame of the video. After extracting the 2D joint positions (x, y coordinates of the 2D-frame) from the input video data, we estimated the 3D foot positions (x, y and depth, Fig. 1) using a perspective-n-point (PNP) algorithm from an open-source (OpenCV) platform, to get a projection matrix. The user needs to provide eight background reference point pairs of 2D points, p
image
and 3D points, p
world
.
The above equation represents the perspective projection model. s is the scale factor, R and T are the 3D rotation and translation of the camera (extrinsic parameters), respectively. K is the camera intrinsic parameter matrix, where f x and f y are the scaled focal lengths, and u0 and v0 is the image center. We assume the camera view is fixed and used 1610, 1530 for f x and f y (in pixel units), which were chosen empirically, half the width and the height of the image for u0 and v0. Given eight-point pairs and camera intrinsic parameters, the PNP algorithm calculates the extrinsic camera parameters. Inference time depended on the image size and the number of people that existed in an image. For example, in the case of a 1920x1080 image when only one person is detected, it takes an average of 1.38 seconds per 1 second-length video.
Following the pose-estimation, we excluded the videos with the poor performance of pose-estimation which is erroneously tracked joint positions during the gait. In the prospective validation experiment, 8 videos (6 walking forward and 2 walking back) were excluded from the total of 62 videos (walking forward and walking back videos) from 31 prospectively enrolled participants (16 PD and 15 healthy controls), due to the poor performance of the pose-estimation. There were 7 cases of ankle occlusion by the clothes (hospital gowns or long skirts) during walking and 1 case of the low contrast of the foot from the floor (n = 1) (Supplementary Figure 1). In the retrospective analysis of archived videos, from a total of 104 videos (med on and med off) of 52 PD patients, 7 patients were excluded as they were unable to walk in the medication off state. Among 90 videos from 45 PD patients, a total of 39 videos were excluded due to the target going out of the frame (n = 26), videos zoomed in during the recording (n = 2) and ankle occlusion by the caregiver (n = 1) (Supplementary Figure 1).
Gait parameter calculation
We classified the TUG into three phases: walking forward, turning, and walking back. Walking forward and walking back represent walking to and away from the camera, respectively. We detected sit-to-stand and stand-to-sit phases using 2D hip, knee, and ankle positions. When the length of each thigh (length between the hip and knee) is shorter than the length of each lower leg (length between the knee and ankle), the patient was identified as sitting. To detect turning, we used the distance between both 2D shoulder positions (ds). In the middle of turning, as the body rotates, both shoulders overlap in the video frame, such that ds is reduced. Assuming that this happens at a time (t), for the two intervals [t - 3 seconds: t], [t: t + 3 seconds], we defined the start and end of the turning phase with the local maximal point of ds. For validation of the number of steps required for turning, the movement disorder specialist (CYL) who is blinded from clinical information and video-based analysis, manually counted the number of steps required for turning from reviewing the videos.
The algorithm successfully tracked 25 joints of the patients during the TUG (Fig. 1, Supplementary Video 1). The 2D coordinates of the foot (ankle toe and heel) were transformed into 3D coordinates (x, y, and z [depth], see Method, Fig. 1) and gait parameters (step length, gait velocity, step cadence and step length variability) were derived. To detect the stance phase of the foot, we used velocity information of the foot. Empirically, we used the toe and heel positions to track steps in walking forward, the heel position in walking back. The velocity of the corresponding joints in 2D was filtered with a 2.2 Hz second-order Butterworth filter to reduce noise. At the time of peak velocity of one foot which indicates the foot is in the middle of a swing, the other foot is considered to be in a stance phase (Fig. 2). We found the peak points of the step velocity and saved the corresponding time information. We defined step length as the difference between the 3D positions (depth) of the left and right foot in the adjacent peak points (Fig. 2). Cadence was defined by the number of local peaks divided by the total step time. Gait speed is calculated as the total step length divided by the time spent in the corresponding phase of the TUG. Step length variability was calculated as the coefficient of variation for step length ([standard deviation of step lengths/mean step length] ×100). Video data often included other people such as medical staff or caregivers for the protection of patients during the TUG. When there was more than one individual in the video, we selected the person closest to the centerline point among feature points given by the user.
Statistical analysis
The intra-class correlation coefficient (ICC) was used to analyze the reliability between video-based gait analysis and ground truth data (GAITRite). We used the two-way mixed-effects model with a relationship defined as consistency [30]. For correlation of gait parameters and clinical variables, Spearman’s correlation analysis and multiple linear regression analysis with age and sex as cofactors were performed. Gait parameters between medication on and off-state were compared with paired t-test. All statistical tests were performed using Matlab 2020a (Mathworks). 3D Pose Estimation from 2D video frames was done with a custom-written code in Python (ver 3.6). The algorithm was run on an Intel Core i9-9900k CPU (3.60GHz×16).
Data availability
The code and the additional data supporting the findings of this study will be available on reasonable requests to the corresponding author.
RESULTS
Validation of video-based analysis of the gait
For the prospective validation experiment, we calculated the ICC to validate video-based tracking compared to the pressure-sensitive walkway (GAITRite). As the length of the GAITRite pressure mat was shorter (5 m) than the length of the TUG (7 m), only a portion of steps from the entire TUG were analyzed. For step length, the mean step length from each trial (walking forward or walking back) was validated between video-based tracking and the GAITRite. The ICC for mean step length was 0.927 with a mean bias (cm)±standard deviation of –0.97±4.53 and 5.09±4.53 for bias and absolute bias, respectively (Table 1). The performance of video-tracking was excellent (ICC > 0.9) regardless of the gait directions (forward/back) or step length (long/short) (Table 1). The long and short steps were classified based on the mean step length (56.85 cm) of the total participants. The velocity and the step cadence from video-tracking were in good to excellent agreement with the GAITRite regardless of the step length or gait direction (ICC > 0.9). We further showed the bias and standard deviation with the Bland-Altman plot (Fig. 3). The step length variability from video-tracking was in the moderate agreement (ICC = 0.62) with the GAITRite. The mean bias (standard deviation) was –9.04 (7.65) and 9.04 (7.65) for signed and absolute bias, respectively suggesting that the bias is higher with video-tracking (Fig. 3). Overall, the video-tracking successfully derived gait parameters which are in excellent agreement with the conventional sensor-based measure. The number of steps required for turning from video-based tracking was validated with manually counted steps for turning (see method) and the performance was good to excellent (ICC = 0.90, Table 1).
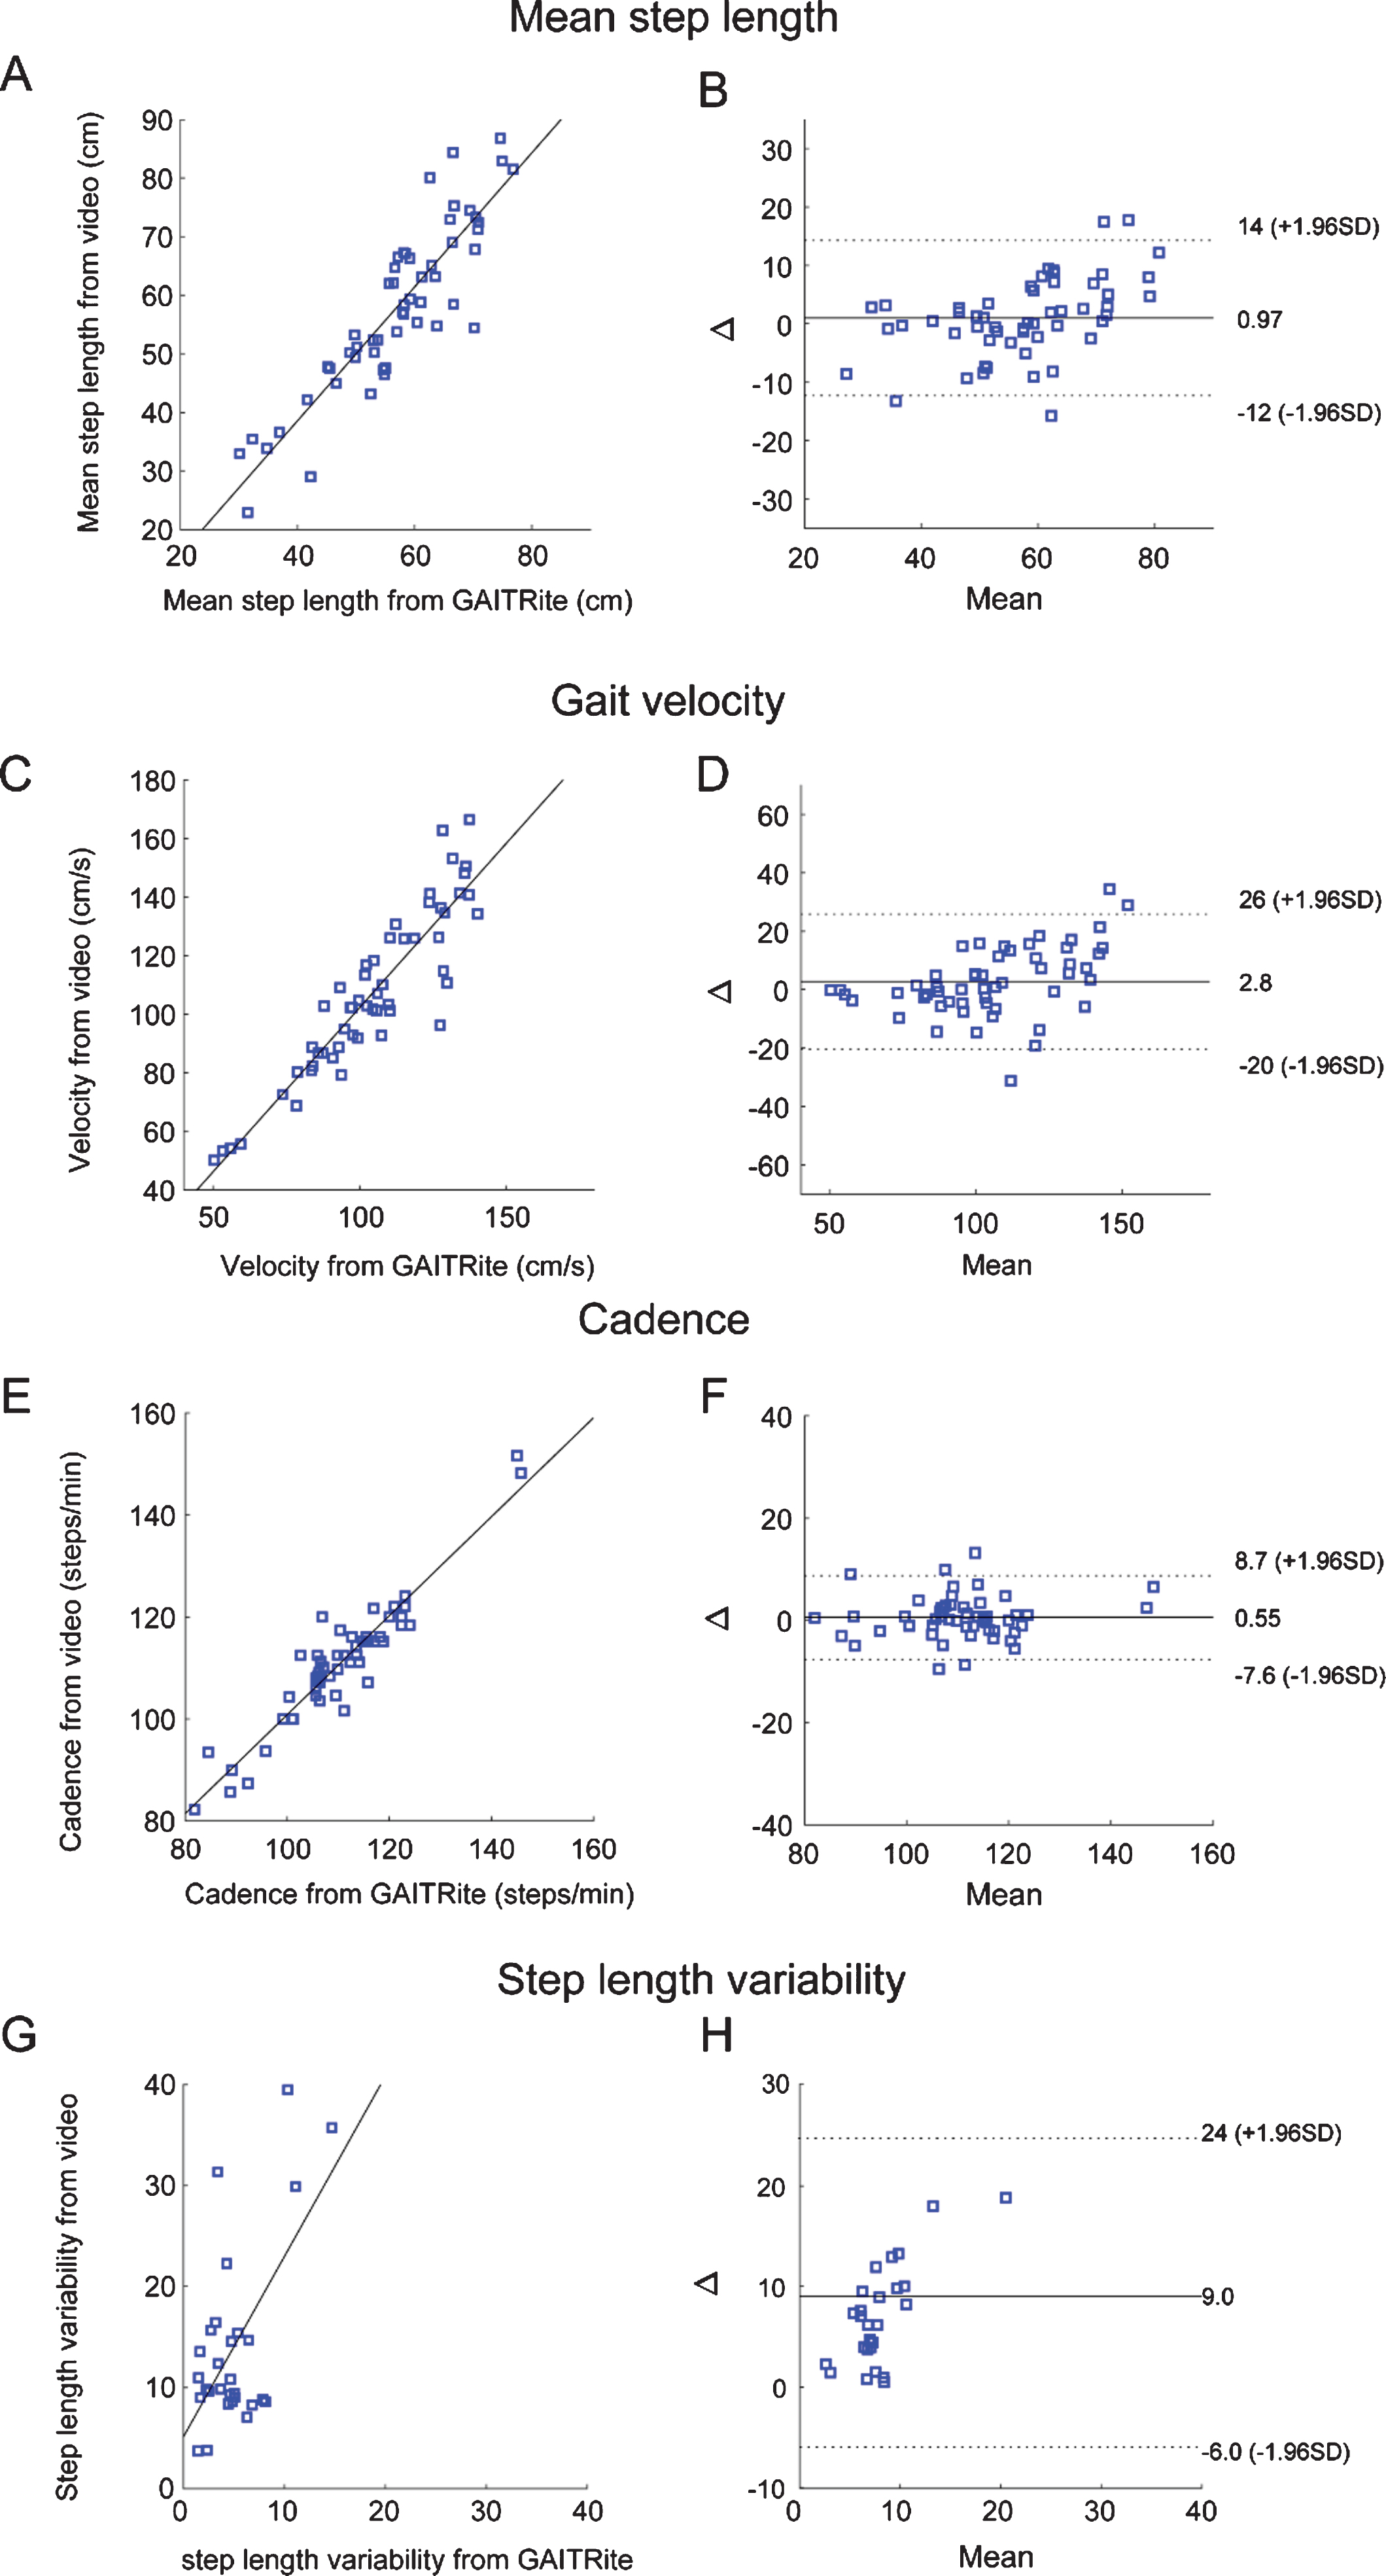
Bland-Altman plot of mean step length, interpeak interval, cadence and step length variability. A) Scatter plot showing mean step length (cm) measured from GAITRite and video-based tracking. B) X axis in the figure denotes mean value of the two measurements (GAITRite vs video-based measure) and y axis in the figure (Δ) is difference between two measurements of mean step length. mean (plain line) and 2 standard deviation of the bias (dotted line) are denoted as horizontal line. C-F) Scatter plot and bland altman plots for gait velocity (C, D), candence (E, F) and step length variability (G-H). cm, centimeter; s, second; SD, standard deviation.
Application of video-based algorithm to retrospectively collected videos of the PD patients
For the retrospective analysis, a total of 61 videos from 32 PD patients were included (Table 2). Baseline demographics and clinical parameters are summarized in Table 2.
Clinical characteristics of PD patients in the study
All scores are shown as the mean±standard or n values (percentage) PD, Parkinson’s disease; M, male; F, female; HY, Hoehn and Yahr; UPDRS, Unified Parkinson Disease Rating Scale.
We analyzed the correlation of the gait parameters with clinically measured parameters. Step length and gait velocity were significantly correlated with FOG-Q, UPDRS part III gait subscore, UPDRS part III total scores, HY stage and postural instability (Fig. 4). Step cadence were not correlated with FOG-Q (R = 0.15, p = 0.24), UPDRS part III total score (R = 0.17, p = 0.19), HY stage (R = 0.17, p = 0.21) and postural instability R = 0.14, p = 0.28) but was correlated with UPDRS part III gait subscore (R = 0.29, p = 0.022). Step length variability was correlated with UPDRS part III gait subscore (R = 0.26, p = 0.049), UPDRS part III total score (R = 0.27 p = 0.039) and postural instability (R = 0.35, p = 0.0068) but not with FOG-Q (R = 0.071, p = 0.59) and HY stage (R = 0.23, p = 0.082). The number of steps and time required for turning was significantly correlated with the FOG-Q, UPDRS part III gait subscore, UPDRS part III total scores, HY stage and postural instability (Fig. 4). All the significant correlations remained after adjusting for age and sex except for the correlation between the number of steps for turning and the FOG-Q score (Supplementary Table 2).
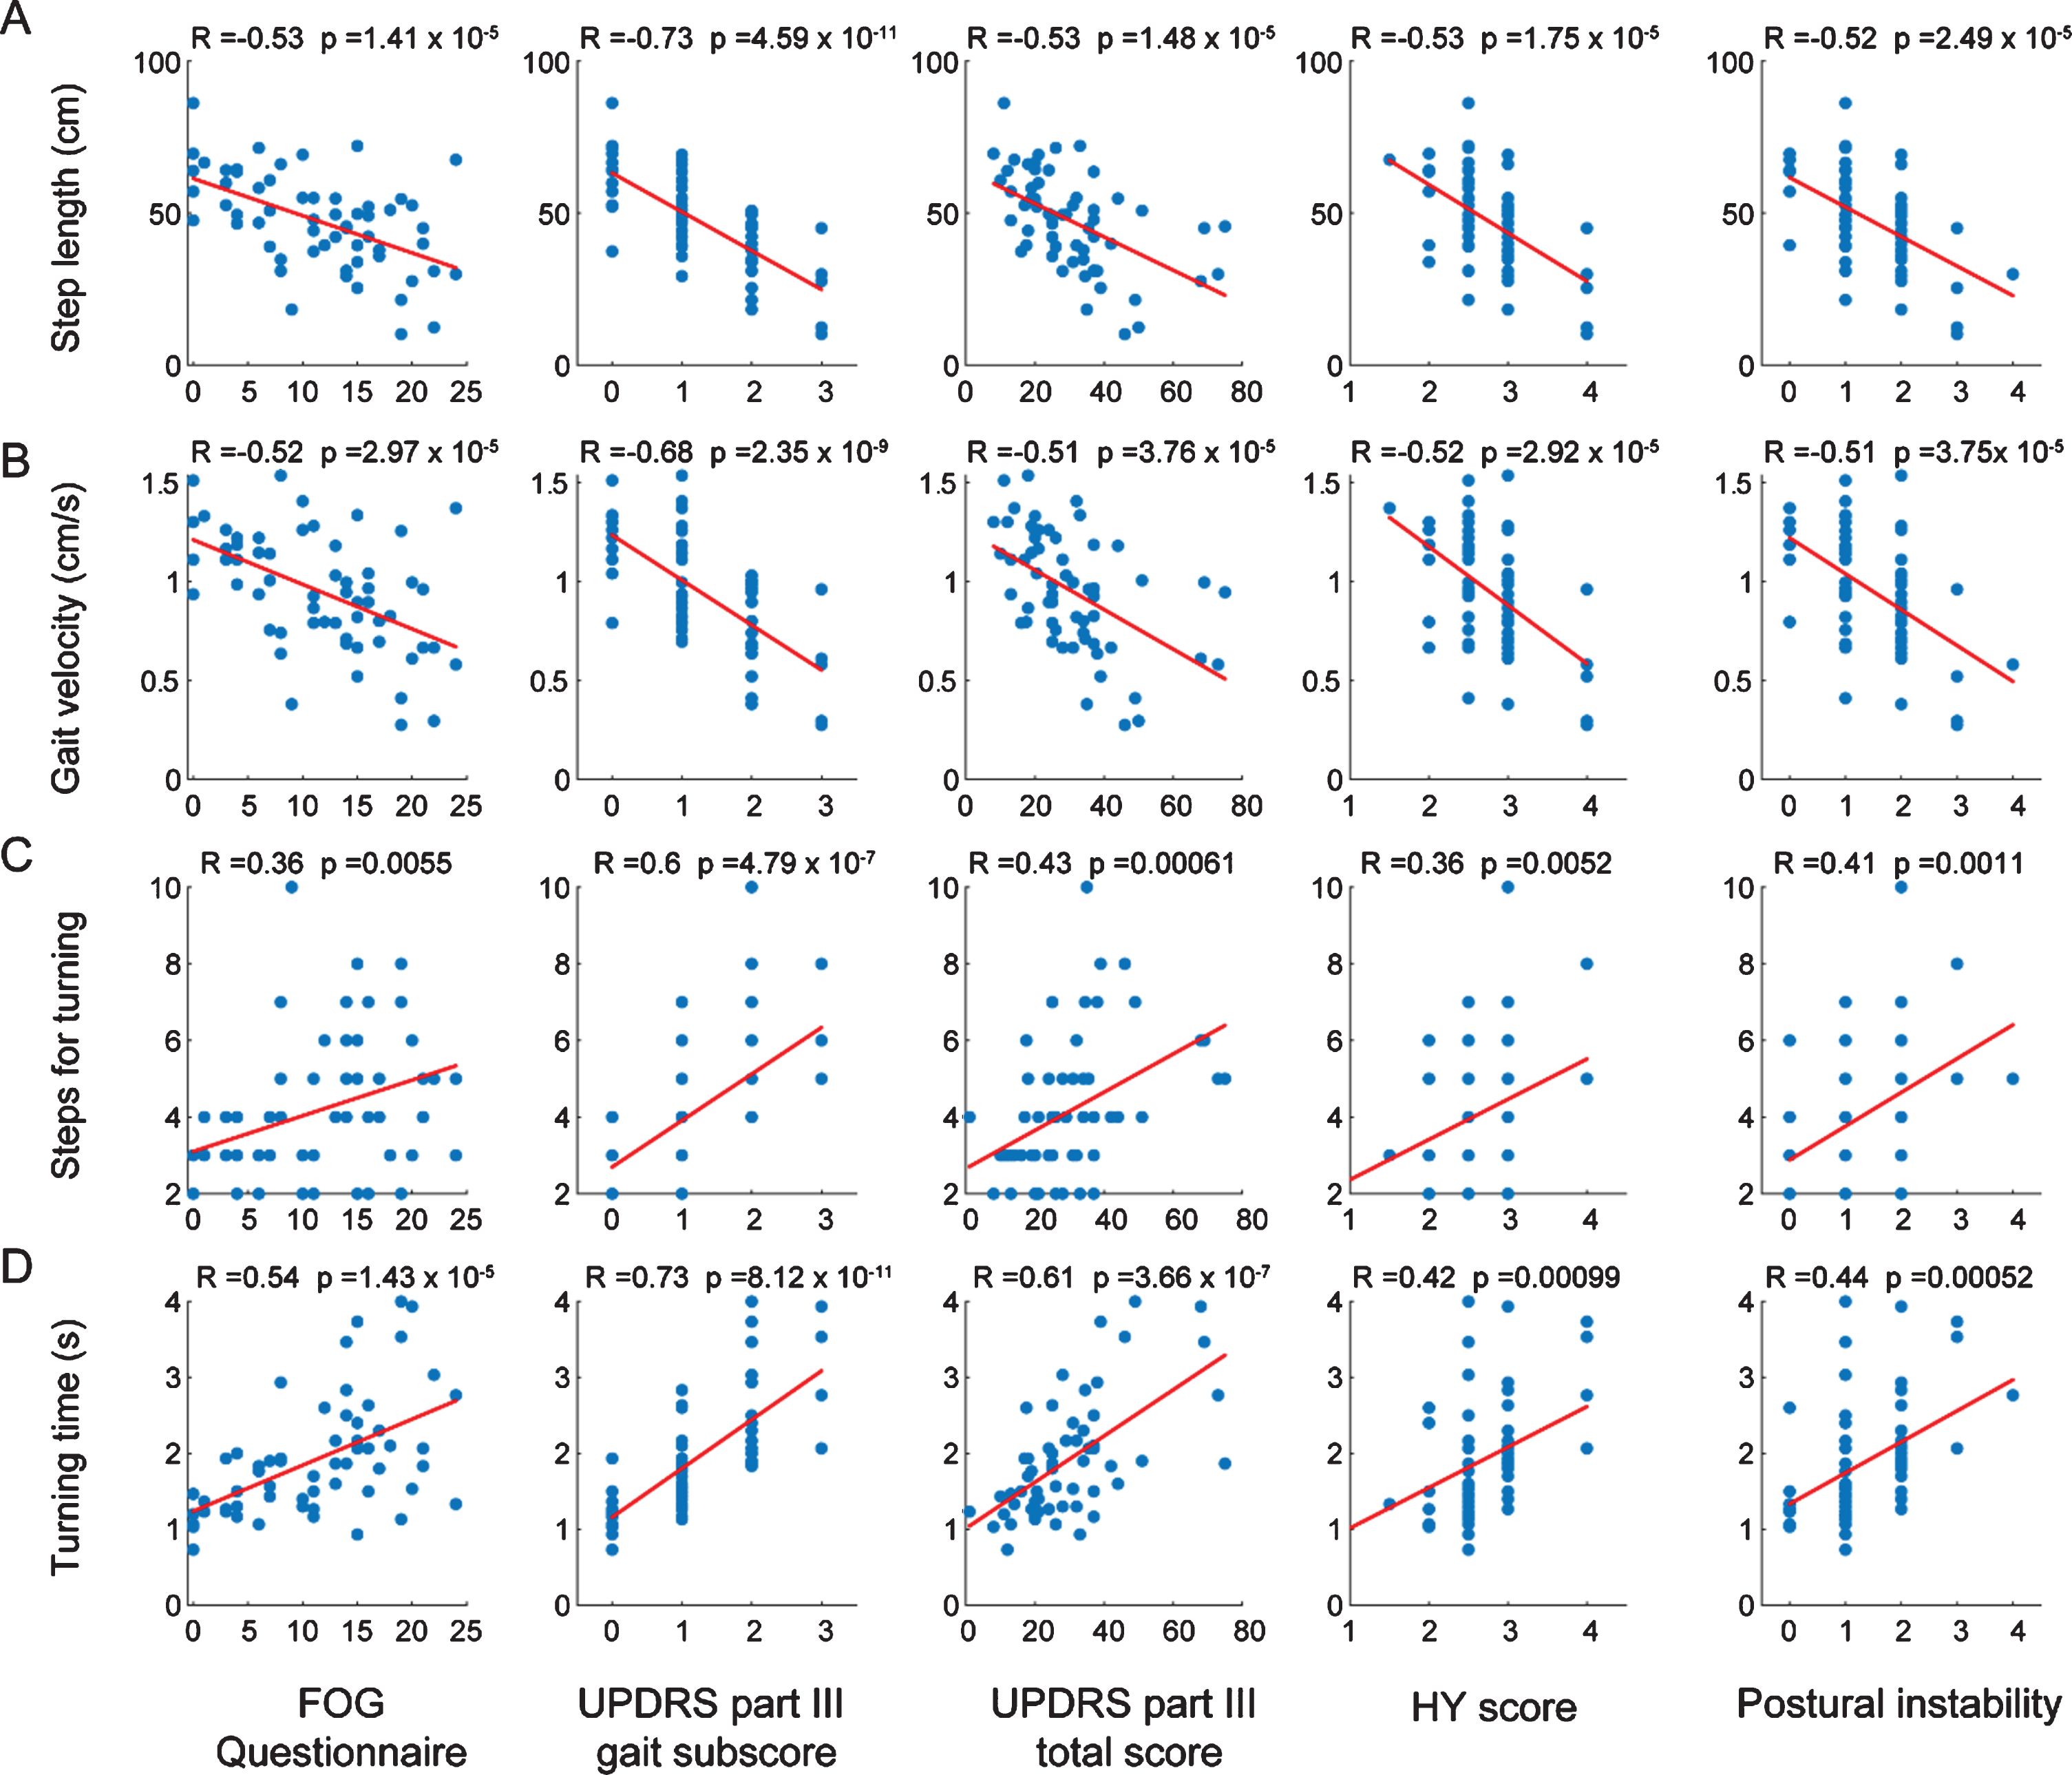
Correlation of gait parameters from video-tracking with Freezing of gait questionnaire (FOG-Q) and UPDRS motor scores. Correlation with FOG-Q, UPDRS part III gait subscore, UPDRS part III total score, HY score and Postural instability with mean step length (A), gait velocity (B), number of steps required for turning (C) and turning time (D). The Rho (R) and p-values were calculated by Spearman’s correlation analysis.
Next, we compared gait parameters between medication on and medication off state in PD patients. The step length and velocity were significantly increased in medication on state and the number of steps for turning and turning time significantly decreased in medication on state (Fig. 5). However, step cadence and step length variability were not changed with antiparkinsonian medication (Fig. 5).
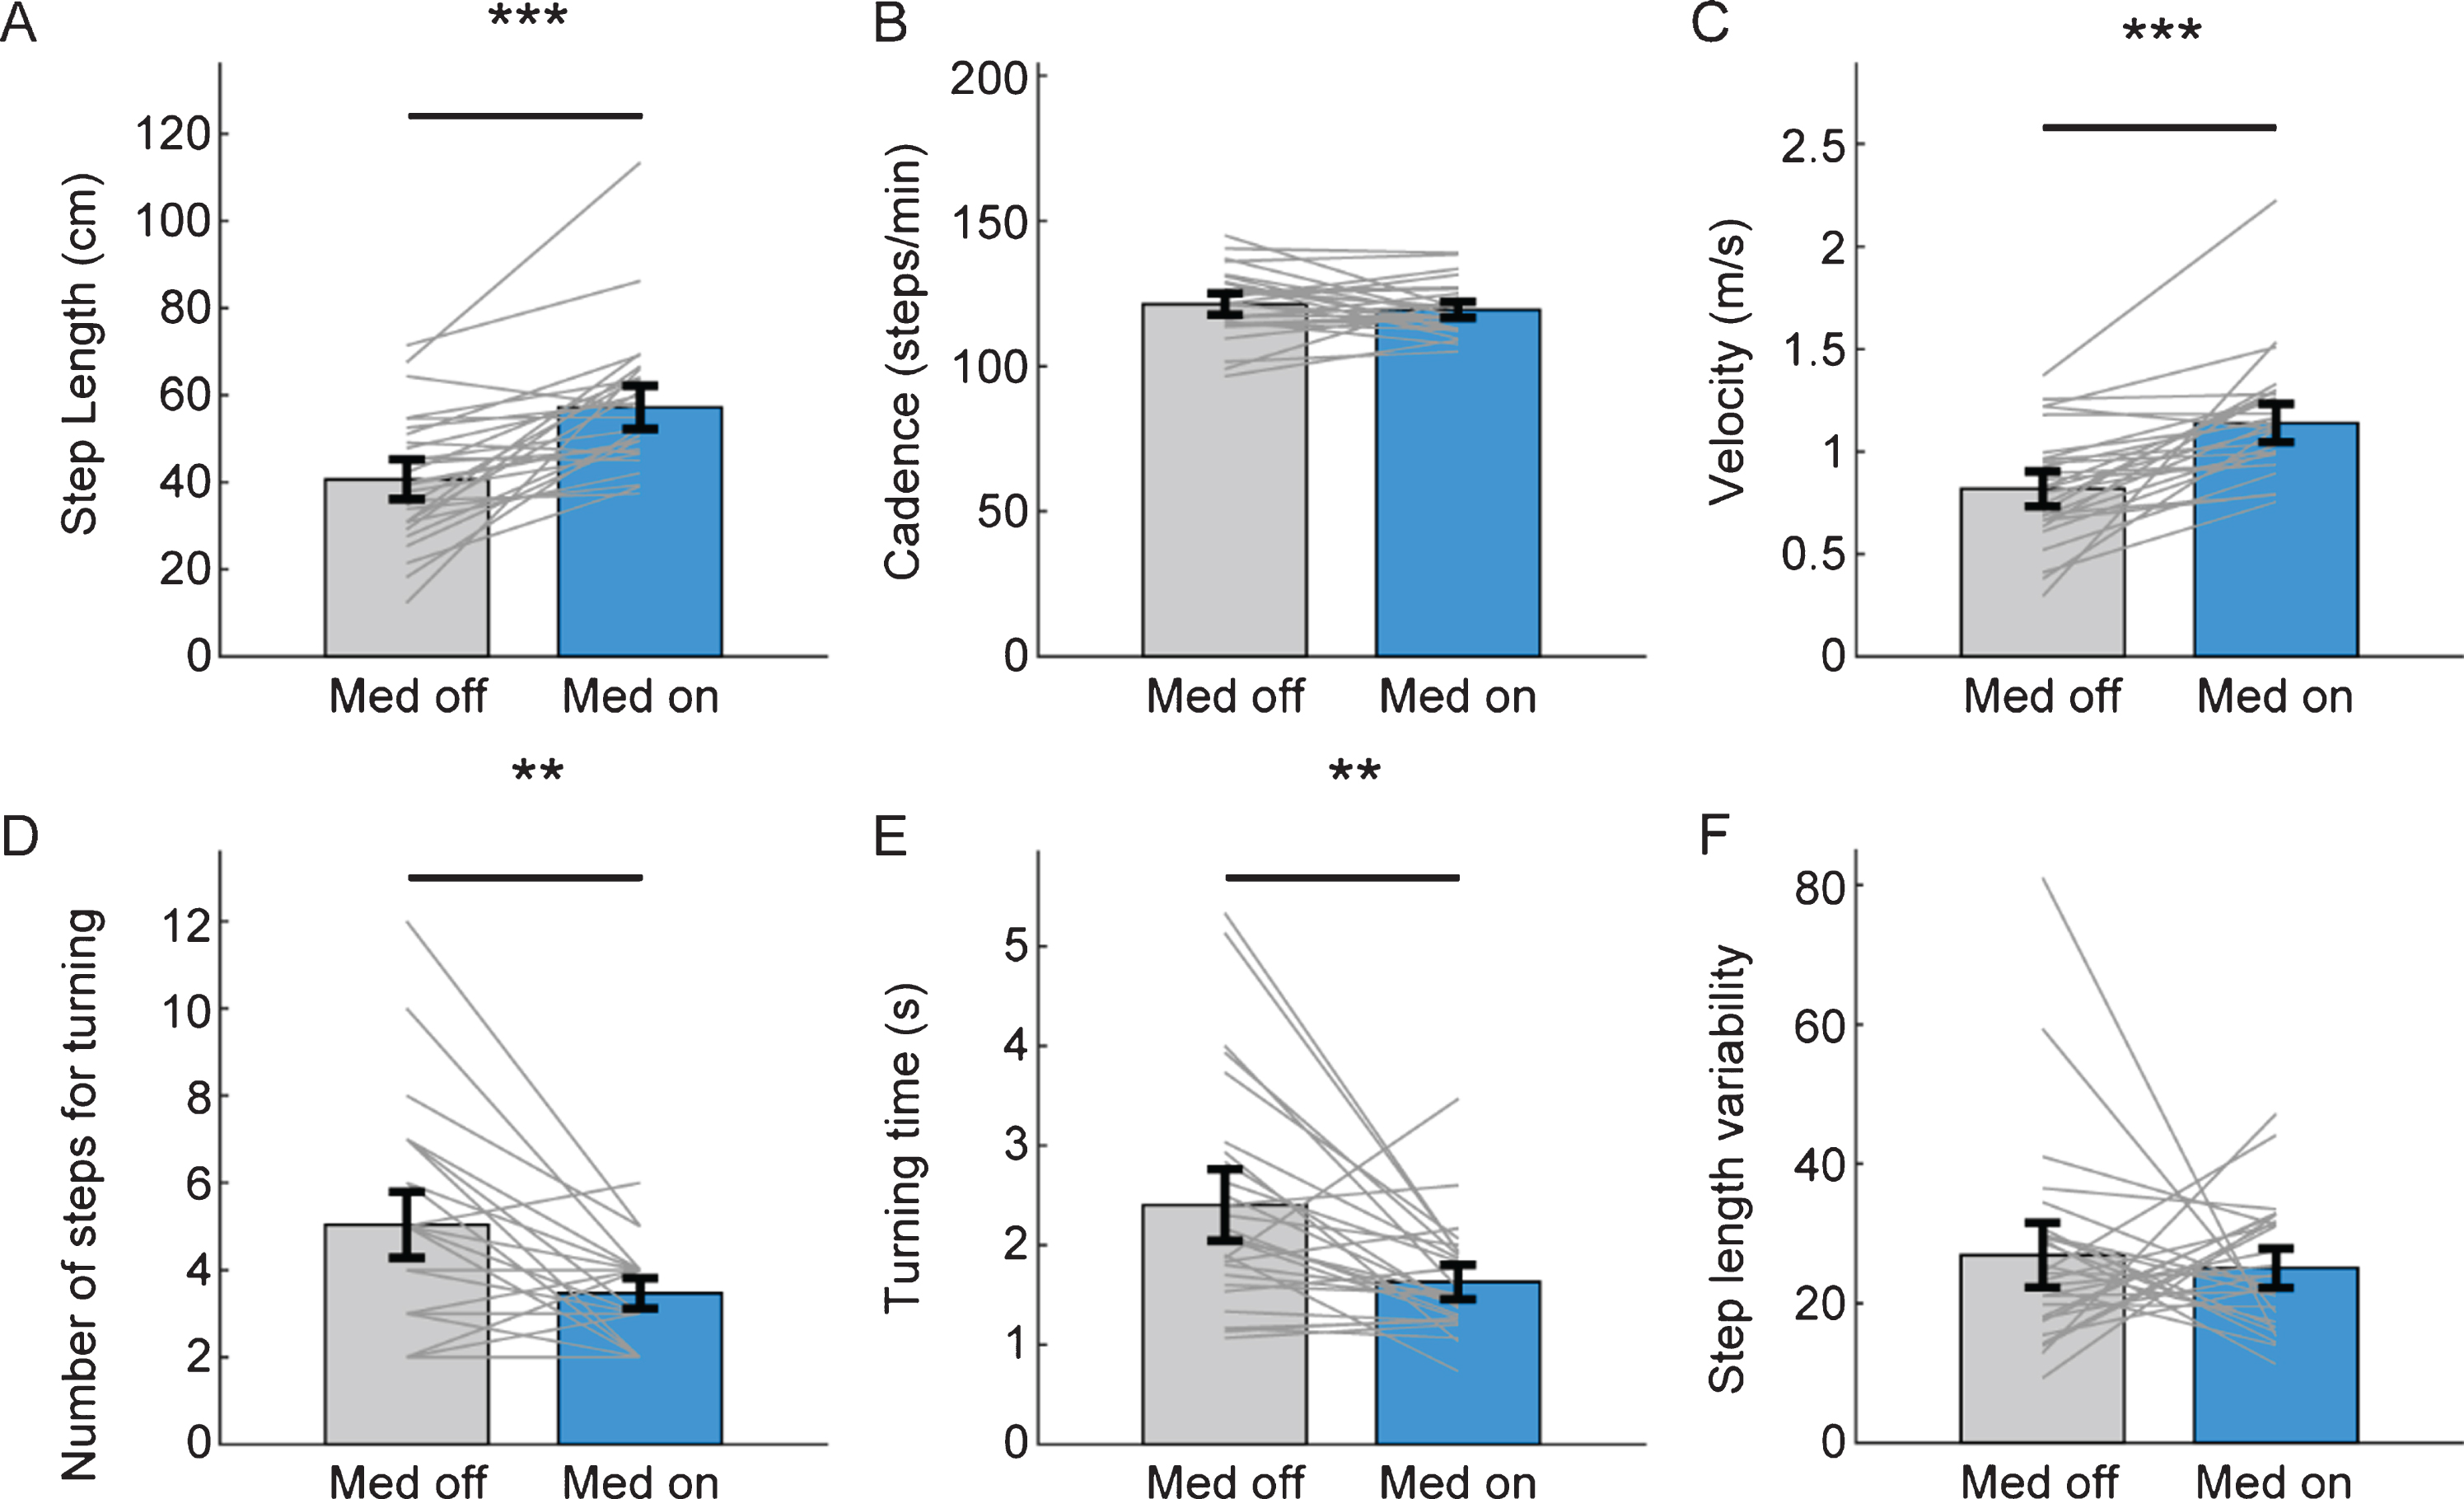
Improvement of gait parameters from video-tracking with antiparkinsonian medication. Comparison of mean step length (A), cadence (B), gait velocity (C), number of steps (D) and the time (E) required for turning, step length variability (F) between medication off (gray bar) and medication on state (sky blue bar). The grey line denotes individual data of PD patients. Black error bar denotes standard error mean. (***p < 0.001, **p < 0.01 from paired t- test).
DISCUSSION
In this study, we showed that the video-based gait analysis can reliably measure gait parameters with 2D videos of PD patients. This study quantitatively analyzed the gait of PD patients with a “marker-less” and “automated” algorithm using 2D video. Quantitative gait analysis using accessible and cost-effective 2D videos has the potential to be widely used in daily practice as an objective measurement in research and clinical practice.
Validation with the conventional sensor-based method
For validation, we compared the gait parameters evaluated by the pressure-sensitive walkway (GAITRite) with the parameters assessed by video-based analysis. Step length, gait velocity and cadence estimation with video-based tracking showed excellent reliability (ICC > 0.9). Of note is that the steps from both walking directions (forward/back) were reliably estimated in our experimental design. This is in contrast to the initial expectation because the foot was presented differently in the videos of walking forward and walking back. The toes are more visible compared to the heel in walking forward videos. In walking back, the heel is more easily visualized in contrast to the toes which are visually occluded by the heel. We used both toe and heel to estimate steps in walking forward and used heel in back walking which resulted in an excellent performance in both conditions.
The performance of estimating step length variability calculated from video-tracking was in moderate agreement with GAITRite but was lower than performance in mean step length. The step length variability was overall higher in video-tracking compared to GAITRite (Fig. 3). Thus, the high variability of the step length suggests relatively low accuracy and high variability of estimating each step length contrasts to the excellent performance in estimation of average gait parameters (average step length, gait velocity or cadence). To overcome this issue, the performance of the pose-estimation algorithm has to be improved with the lower noise level and higher stability of joint tracking.
Gait analysis with front-view videos
The current algorithm is optimized in gait videos recorded in frontal view (patients walking toward and away from the camera). Estimation of the step length might be more feasible in the perpendicular plane as the step length might be more directly measured. However, many of the gait videos are being recorded in a hallway for the patients to grab the bar or lean on the wall in case of unsteadiness. Furthermore, the view of the frontal plane of the hallway has reference points (horizontal and vertical lines on the floor, wall and ceiling) which was used in this study. Therefore, customization of the 3D reference according to each experimental setting would be possible. Future studies will be focused on validating gait analysis in diverse video angles including frontal, perpendicular and diagonal view.
Evaluation of turning in TUG with video-based analysis
The TUG evaluates functional mobility (including gait and balance) as it is composed of the sit-to-stand, gait, turn, gait, and stand-to-sit tasks [31]. The algorithm used in this study can capture an individual’s 2D joint positions. We estimated the time and steps required for turning (using the distance between 2D shoulder positions). Turning, especially, is a distinct motor sequence that requires attention, balance and limb coordination [5, 32]. Therefore, turning is the phase when most falls occur in PD patients [33]. The GAITRite used in this study is widely available in movement disorder centers around the world, but cannot evaluate turning during the gait. Time and steps required for turning which was previously evaluated with 3D motion capture methods [34] or using IMUs [35] were correlated with postural instability and fall prediction. In this study, we also validated that the video-based analysis could reliably calculate the steps required for turning and also showed the parameters for turning correlate with postural instability.
Correlation with clinical parameters
The gait parameters (step length, gait velocity and cadence) derived from video-based tracking showed a significant correlation with the FOG-Q, UPDRS part III scores and HY score. Of note, there was a large variation of parameters within the same UPDRS and a range of the parameters were overlapped between adjacent FOG-Q and UPDRS scores (Fig. 4). This implies that there is a continuous spectrum of gait parameters in PD patients which cannot be sufficiently captured by the UPDRS rating. In this regard, the quantitative analyzed gait parameters with video-based tracking might detect minor gait disturbance in prodromal PD patients or early PD patients, which are difficult to detect with visual assessment. There was a significant correlation of gait parameters (step length, step length variability, gait velocity, steps and time required for turning) with postural instability which is closely related to the imbalance and falls. The gait parameters derived from the video tracking successfully reflected significant improvement by medication except for step cadence and step length variability which corresponds with previous sensor-based studies [36–38]. These results show that the gait evaluation with video-based tracking can be used for early detection of the gait disturbance, monitor clinical progression and response to therapeutic intervention.
Privacy issue in the video-based analysis
The videos used in this study contains the facial area that may result in privacy issue. In this study, the videos with pose-estimation have markers and lines connecting the nose, eyes and ears which occludes the facial area (Figs. 1 and 2) Also, the access to the raw videos was strictly restricted to the authorized researchers only and all processed data was anonymized (see Method). However, to expand the use of the algorithm to the general population, anonymization of the videos might be required. Mosaic or the blurring of the facial area of the raw videos might be one of the options as the current algorithm does not use the position of nose, eyes or ears in gait analysis. More detailed protocols and methods during the process should be discussed in the future.
Limitations
There are several limitations in the study which should be improved to be translated to clinical practice. First, the current algorithm has not been validated for gait videos recorded in different settings. Further validation experiments in different environments should be conducted in the future. Also, our algorithm has not been validated in different neurological conditions that affect gait which should be conducted in the future. Second, the performance of the pose-estimation was poor in a few participants, especially in cases with joint occlusion and low contrast with the background. We could not re-evaluate the patients with the corrected environment. However, if a real-time evaluation is possible in the future, we would detect the error of the pose-estimation at the time of evaluation which can be corrected immediately. Third, only videos recorded in a fixed position without zooming in were analyzed in this study. Our goal is to design an application that can analyze gait anytime anywhere. Videos are usually recorded in a hand-held position in daily life. Thus, in the future, an algorithm that can calibrate the movement of the camera during recording would enable more wide application. Lastly, the subset of movements that are part of the TUG task including sitting down, standing up and turning behavior was not validated with objective methods. Thus, future validation studies using a motion capture system would further add value to the current algorithm.
Footnotes
ACKNOWLEDGMENTS
This study was supported by grant No. (30-2019-0150) from the SNUH Research fund, Institute of Information & communications Technology Planning & Evaluation (IITP) grant funded by the Korean government (MSIT) (No.2017-0-00878, (SW StarLab) Human motion simulation based on deep learning).
CONFLICT OF INTEREST
All authors declare no relevant conflicts of interest in this study.