
Abstract
Background:
Sudomotor dysfunction is common in patients with multiple system atrophy (MSA). Postganglionic sudomotor dysfunction in MSA, which can be assessed using quantitative sudomotor axon reflex testing (QSART), results from the degeneration of preganglionic sympathetic neurons and direct loss of postganglionic fibers.
Objective:
We investigate whether abnormal QSART responses in patients with MSA are associated with disease severity.
Methods:
In this retrospective study, patients with probable MSA who underwent both 18F-fluorodeoxyglucose positron emission tomography/computed tomography (18F-FDG-PET/CT) and autonomic function tests were included. Autonomic function test results were integrated divided into three sub-scores, including sudomotor, cardiovagal, and adrenergic sub-scores. The sudomotor sub-score represented postganglionic sudomotor function. Unified Multiple System Atrophy Rating Scale (UMSARS) Part I, Part II, and sum of Part I and II scores (Part I + II) to reflect disease severity and 18F-FDG-PET/CT results were collected.
Results:
Of 74 patients with MSA, 62.2%demonstrated abnormal QSART results. The UMSARS Part I + II score was significantly higher in the abnormal QSART group than in the normal QSART group (p = 0.037). In the regression analysis, both UMSARS Part I (β= 1.185, p = 0.013) and Part II (β= 1.266, p = 0.021) scores were significantly associated with the sudomotor sub-score. On 18F-FDG-PET/CT, the abnormal QSART group exhibited more severely decreased metabolic activity in the cerebellum and basal ganglia in patients with MSA-P and MSA-C, respectively. The sudomotor sub-score was significantly associated with regional metabolism in these areas.
Conclusion:
Patients with MSA and postganglionic sudomotor dysfunction may have worse disease severity and greater neuropathological burden than those without.
INTRODUCTION
Multiple system atrophy (MSA) is a neurodegenerative disease clinically characterized by autonomic dysfunction along with cerebellar syndrome or parkinsonism that responds poorly to levodopa [1]. Sudomotor dysfunction has been recognized as one of the features of autonomic failure observed in patients with MSA. Previous studies have shown that more than 90%of patients with MSA have abnormal sweating [2, 3]. The thermoregulatory pathway consists of preganglionic and postganglionic sympathetic sudomotor axons. It has been traditionally thought that sudomotor dysfunction in MSA mainly results from a preganglionic lesion [4]. The degeneration of preganglionic sympathetic neurons located in the intermediolateral cell column has been considered a neural correlate of sympathetic autonomic dysfunction in MSA [5]. Postganglionic sudomotor dysfunction in patients with MSA was understood as a result of secondary trans-synaptic cell death following preganglionic denervation during disease progression [6]. However, a recent study provided evidence of direct postganglionic sudomotor involvement in patients with MSA by demonstrating α-syn-uclein deposition in the dermal nerves of patients with MSA [7].
The location of lesions relevant to abnormal sweating can be identified based on thermoregulatory sweat testing (TST) and quantitative sudomotor axon reflex testing (QSART). TST evaluates the entire preganglionic and postganglionic axon, whereas QSART as-sesses the postganglionic sudomotor function. Thus, the location of the lesion can be assumed to be preganglionic in patients with an abnormal TST and normal QSART response. In contrast, an abnormal QSART implies postganglionic sudomotor dysfunction.
In this study, we hypothesized that the presence of postganglionic sudomotor dysfunction, represented by an abnormal QSART response, would indicate a greater neurodegenerative burden in patients with early stage MSA. To test this hypothesis, we investigated whether patients with MSA with abnormal QSART responses had more severe disease than those with a normal QSART response. Disease severity was evaluated using the Unified Multiple System Atrophy Rating Scale (UMSARS) score and brain regional hypometabolism on 18F-fluorodeoxyglucose posi-tron emission tomography/computed tomography (18F-FDG-PET/CT) scans.
MATERIALS AND METHODS
Patient enrollment
We retrospectively reviewed the medical records of patients with MSA who visited the Department of Neurology, Severance Hospital, South Korea between January 2015 and December 2018. The dia-gnosis of MSA was made by movement disorder specialists based on the diagnostic criteria for MSA [8]. The patients were selected based on the following inclusion criteria: 1) probable MSA; 2) early stage MSA with UMSARS Part IV score≤3; 3) brain magnetic resonance imaging (MRI), 18F-FDG-PET/CT, and a comprehensive autonomic function test conducted at the time of diagnosis (i.e., within 2 months of the diagnosis of MSA); and 4) supportive findings from brain MRI and 18F-FDG-PET/CT scans (i.e., cerebellar atrophy on brain MRI; decreased glucose metabolism in the basal ganglia and/or cerebellum on 18F-FDG-PET/CT). The exclusion criteria included 1) evidence of atypical parkinsonism other than MSA; 2) severe white matter hyperintensities or cerebrovascular lesions on brain MRI; 3) mutations in the spinocerebellar ataxia type 1, 2, 3, 6, 7, 8, or 17 gene; 4) other major neurological disorders (e.g., stroke or brain surgery); 5) comorbidities that can cause autonomic neuropathy, including diabetes mellitus, spinal cord lesions, chemotherapy, and connective tissue disease; and 6) comorbidities that can affect the results of autonomic function tests including chronic pulmonary disease and arrhythmia. Of the included patients, we further selected a sub-group of patients whose UMSARS score was assessed within 3 months of the autonomic function test to evaluate the association between UMSARS score and autonomic dysfunction. This study was approved by the Severance Hospital Institutional Review Board (Approval No. 4-2019-0211). The need for informed consent was waived because of the retrospective nature of the study.
Data collection
Demographic and clinical data of the patients (age, sex, age at onset, MSA subtype, disease severity, and autonomic function test) were recorded by reviewing medical records. Patients with MSA were categorized into the parkinsonian subtype (MSA-P) or cerebellar subtype (MSA-C) depending on their predominant symptoms [1]. Disease severity was assessed using the UMSARS score at initial assessment. UMSARS consists of four subscales: UMSARS Part I (historical review), UMSARS Part II (motor examination scale), UMSARS Part III (autonomic examination), and UMSARS Part IV (global disability scale). Of these, Part I, Part II, and the sum of Parts I and II (Part I + II) scores were used to assess disease severity. In addition, we further subdivided UMSARS Part I into motor sub-scores and autonomic sub-scores. The UMSARS Part I motor sub-score consists of eight items (items 1 to 8) associated with motor functions, and the UMSARS Part I autonomic sub-score consists of four items (items 9 to 12) regarding autonomic dysfunction.
Autonomic function test
Autonomic testing was conducted in a standardized fashion to assess the following autonomic domains: sympathetic sudomotor function, cardiovagal function, and cardiovascular adrenergic function. The sudomotor function was evaluated using QSART. During QSART, the sweat response was triggered by iontophoresis of acetylcholine at four sites, including the forearm, proximal leg, distal leg, and foot, and the volume of sweat was recorded at each site. The proportion of sites with an abnormal sweat response was calculated by dividing the number of sites with a decreased sweat response by the total number of sites evaluated. Cardiovagal function was evaluated based on heart rate variation during deep breathing and the Valsalva ratio. Heart rate variation during deep breathing reflects parasympathetic cardiovagal function with lower heart rate variation indicating worse cardiovagal function. Changes in heart rate generated by deep breathing were measured, and the final result was calculated by averaging five responses. The Valsalva ratio is also an index of parasympathetic function, with a lower ratio indicating worse cardiovagal function. The Valsalva ratio was calculated by dividing the maximum heart rate by the minimum heart rate during the Valsalva maneuver. The adrenergic function was evaluated by the phase II and phase IV responses during the Valsalva maneuver and the result of the head-up tilt test. Absent or insufficient late phase II or phase IV responses and/or the presence of orthostatic hypotension provoked by the head-up tilt test was indicative of adrenergic dysfunction. Based on these results, the Composite Autonomic Severity Score (CASS) was generated, which is a widely used and validated scoring system to quantify autonomic dysfunction [9]. The total CASS ranges from 0 to 10 with a higher CASS indicating more severe autonomic failure. The total CASS consists of three sub-scores that represent each domain: CASS sudomotor ranging from 0 to 3, CASS cardiovagal from 0 to 3, and CASS adrenergic from 0 to 4. Additionally, patients with MSA were classified into two groups according to their QSART response: normal QSART (CASS sudomotor sub-score of 0; n = 28) and abnormal QSART (CASS sudomotor sub-score of 1 to 3; n = 46).
18F-FDG PET/CT acquisition
18F-FDG PET/CT scans were acquired using a Discovery 600 scanner (General Electric Healthcare, Milwaukee, WI, USA). After the patients had fasted for at least 6 hours (blood glucose concentration < 140 mg/dL), they were intravenously injected with 4.1 MBq of 18F-FDG per kilogram body weight. Forty minutes after the injection, PET images were acquired for 15 min and then reconstructed using an ordered subset expectation maximization algorithm with four iterations and 32 subsets. For attenuation correction, CT scans were performed with 0.5 s/rotation, 120 kVp, 200 mA, 3.75 mm slice thickness, 10 mm of collimation, and 9.375 mm of table feed per rotation.
Quantitative analyses of 18F-FDG PET/CT images
18F-FDG PET/CT images were co-registered to the participant’s corresponding T1 image using SPM12. To perform a voxel-wise analysis, the individual 18F-FDG image was warped to the MNI152 templ-ate using normalization parameters defined from the MRI procedure. Subsequently, the normalized PET/CT images were smoothed using an 8 mm full width at half maximum Gaussian kernel. To avoid some dilution effects when pooling patients with MSA with left- and right-dominant putaminal hyp-ometabolism, the more affected putamen was always placed on the right side by left-right flipping of the FDG PET images. Finally, a voxel-wise multiple linear regression analysis including age, sex, and disease duration as covariates was performed to determine the differences in metabolic activity between the two groups according to the QSART response. The statistical threshold was set to p < 0.001 at voxel level. Furthermore, correlation analyses between the CASS and regional glucose metabolism were performed, controlling for the effects of age, sex, and disease duration.
Statistical analysis
The clinical data are expressed as mean±standard deviation for continuous variables or numbers (percentages) for categorical variables. The chi-square test or Fisher’s exact test were used to compare categorical variables, and the t-test was used to compare continuous variables between groups. Multivariate linear regression analyses were performed to assess the association between UMSARS scores and autonomic dysfunction severity (CASS sub-scores) adjusting for age, disease duration, and MSA subtype as covariates. All p-values were two-sided, and a p-value <0.05 was considered statistically significant. R software (version 4.0.3, R Foundation for Statistical Computing, Vienna, Austria) was used for statistical analysis.
RESULTS
Baseline demographics and clinical features of study participants
A total of 74 patients with MSA (36 MSA-P and 38 MSA-C) met the inclusion and exclusion criteria. The clinical features and results of the autonomic function test are demonstrated in Table 1. The mean age of the patients was 59.84±7.67 years and mean disease duration (i.e., duration of parkinsonian or cerebellar symptoms) at the time of autonomic function test was 18.18±11.41 months. UMSARS was evaluated within 3 months of the autonomic function test in 57 patients, and the mean UMSARS Part II score of patients with MSA-P 18.12±6.77) was higher than that of patients with MSA-C (13.69±4.80; p = 0.005). The frequency of patients with abnormal results or sub-results (either sudomotor, cardiovagal, or adrenergic) in the autonomic function tests did not significantly differ between patients with MSA-P and those with MSA-C. QSART was abnormal in 25 (69.4%) patients with MSA-P and 21 (55.3%) patients with MSA-C (p = 0.238).
Clinical features and results of the autonomic function test in patients with multiple system atrophy
MSA, multiple system atrophy; MSA-P, MSA with predominant parkinsonism; MSA-C, MSA with predominant cerebellar ataxia; AFT, autonomic function test; UMSARS, Unified Multiple System Atrophy Rating Scale aUMSARS was assessed in 25 patients with MSA-P and 32 patients with MSA-C.
Comparison of clinical features and autonomic function between patients with abnormal and normal QSART responses
We compared the clinical features and results of the autonomic function test between 46 patients with an abnormal QSART response (abnormal QSART group) and 28 patients with a normal QSART res-ponse (normal QSART group; Table 2). There was no significant difference in terms of MSA subtype, age of onset, sex, or disease duration. The USMARS Part I and Part II scores tended to be higher in the abnormal QSART group (Part I, 15.06±5.34; Part II, 16.82±6.81) than in the normal QSART group (Part I, 12.43±4.82, p = 0.064; Part II, 13.87±4.49, p = 0.073). Additionally, the UMSARS Part I + II score was significantly higher in the abnormal QSART group (31.88±11.55) than in the normal QSART group (26.30±8.14, p = 0.037). As expected, the abnormal QSART group had a higher CASS sudomotor sub-score than that of the normal QSART group (p < 0.001), while there was no significant difference in CASS cardiovagal or adrenergic sub-scores between the groups (p = 0.950 and 0.975, respectively).
Comparison of clinical features between the patients with abnormal and normal QSART
QSART, quantitative sudomotor axon reflex testing; MSA, multiple system atrophy; MSA-P, MSA with predominant parkinsonism; MSA-C, MSA with predominant cerebellar ataxia; AFT, autonomic function test; UMSARS, Unified Multiple System Atrophy Rating Scale; CASS, Composite Autonomic Severity Score *UMSARS score was measured in 57 (34 abnormal QSART and 23 normal QSART) patients.
Association between CASS score and UMSARS score
Of the 57 patients (25 with MSA-P and 32 with MSA-C) who were initially assessed using the UMSARS and autonomic function test within 3 months, we analyzed the association between each CASS sub-score and UMSARS score (Table 3). Regression models using the UMSARS Part I score as a dependent variable showed that the UMSARS Part I score was significantly associated with the CASS sudomotor sub-score (β= 1.185, p = 0.013), CASS adrenergic sub-score (β= 1.107, p = 0.027), and CASS total score (β=0.835, p = 0.002), but not with the CASS cardiovagal sub-score (β=0.916, p = 0.220). When the UMSARS Part I motor sub-score and autonomic sub-score were separately ana-lyzed, the association was only significant for the autonomic sub-score, but not for the motor sub-score (Supplementary Table 1). Regression models using the UMSARS Part II score as a dependent variable revealed that the UMSARS Part II score was not significantly associated with CASS sub-scores, except for the CASS sudomotor sub-score (β= 1.266, p = 0.021). The UMSARS Part I + II score was significantly associated with the CASS sudomotor sub-score (β= 2.450, p = 0.009), CASS adrenergic sub-score (β= 2.067, p = 0.036), and CASS total score (β= 1.618, p = 0.002), but not with the CASS cardiovagal sub-score (β=1.586, p = 0.281).
Association between UMSARS total score and CASS sub-scores after adjusting for age, duration of MSA, and MSA subtype
MSA, multiple system atrophy; UMSARS, Unified Multiple System Atrophy Rating Scale; AFT, autonomic function test; MSA-P, MSA with predominant parkinsonism; MSA-C, MSA with predominant cerebellar ataxia; CASS, Composite Autonomic Severity Score.
Comparison of brain regional glucose metabolism between patients with abnormal and normal QSART responses
Compared to that of the normal QSART group (n = 28), the abnormal QSART group (n = 46) exhibited more severely decreased metabolic activity (i.e., FDG uptake) in the midbrain and less affected putamen and thalamus (Fig. 1A). Since patterns of brain regional glucose hypometabolism might differ between MSA motor subtypes, we additionally compared the patterns of regional cerebral metabolism in MSA-P and MSA-C. In patients with MSA-P, the abnormal QSART sub-group (n = 25) exhibited lower glucose metabolism in the cerebellum than the normal QSART sub-group (n = 11; Fig. 1B). In patients with MSA-C, the abnormal QSART sub-group (n = 21) demonstrated had lower metabolic activity in the bilateral basal ganglia compared to that in the normal QSART sub-group (n = 17; Fig. 1C).
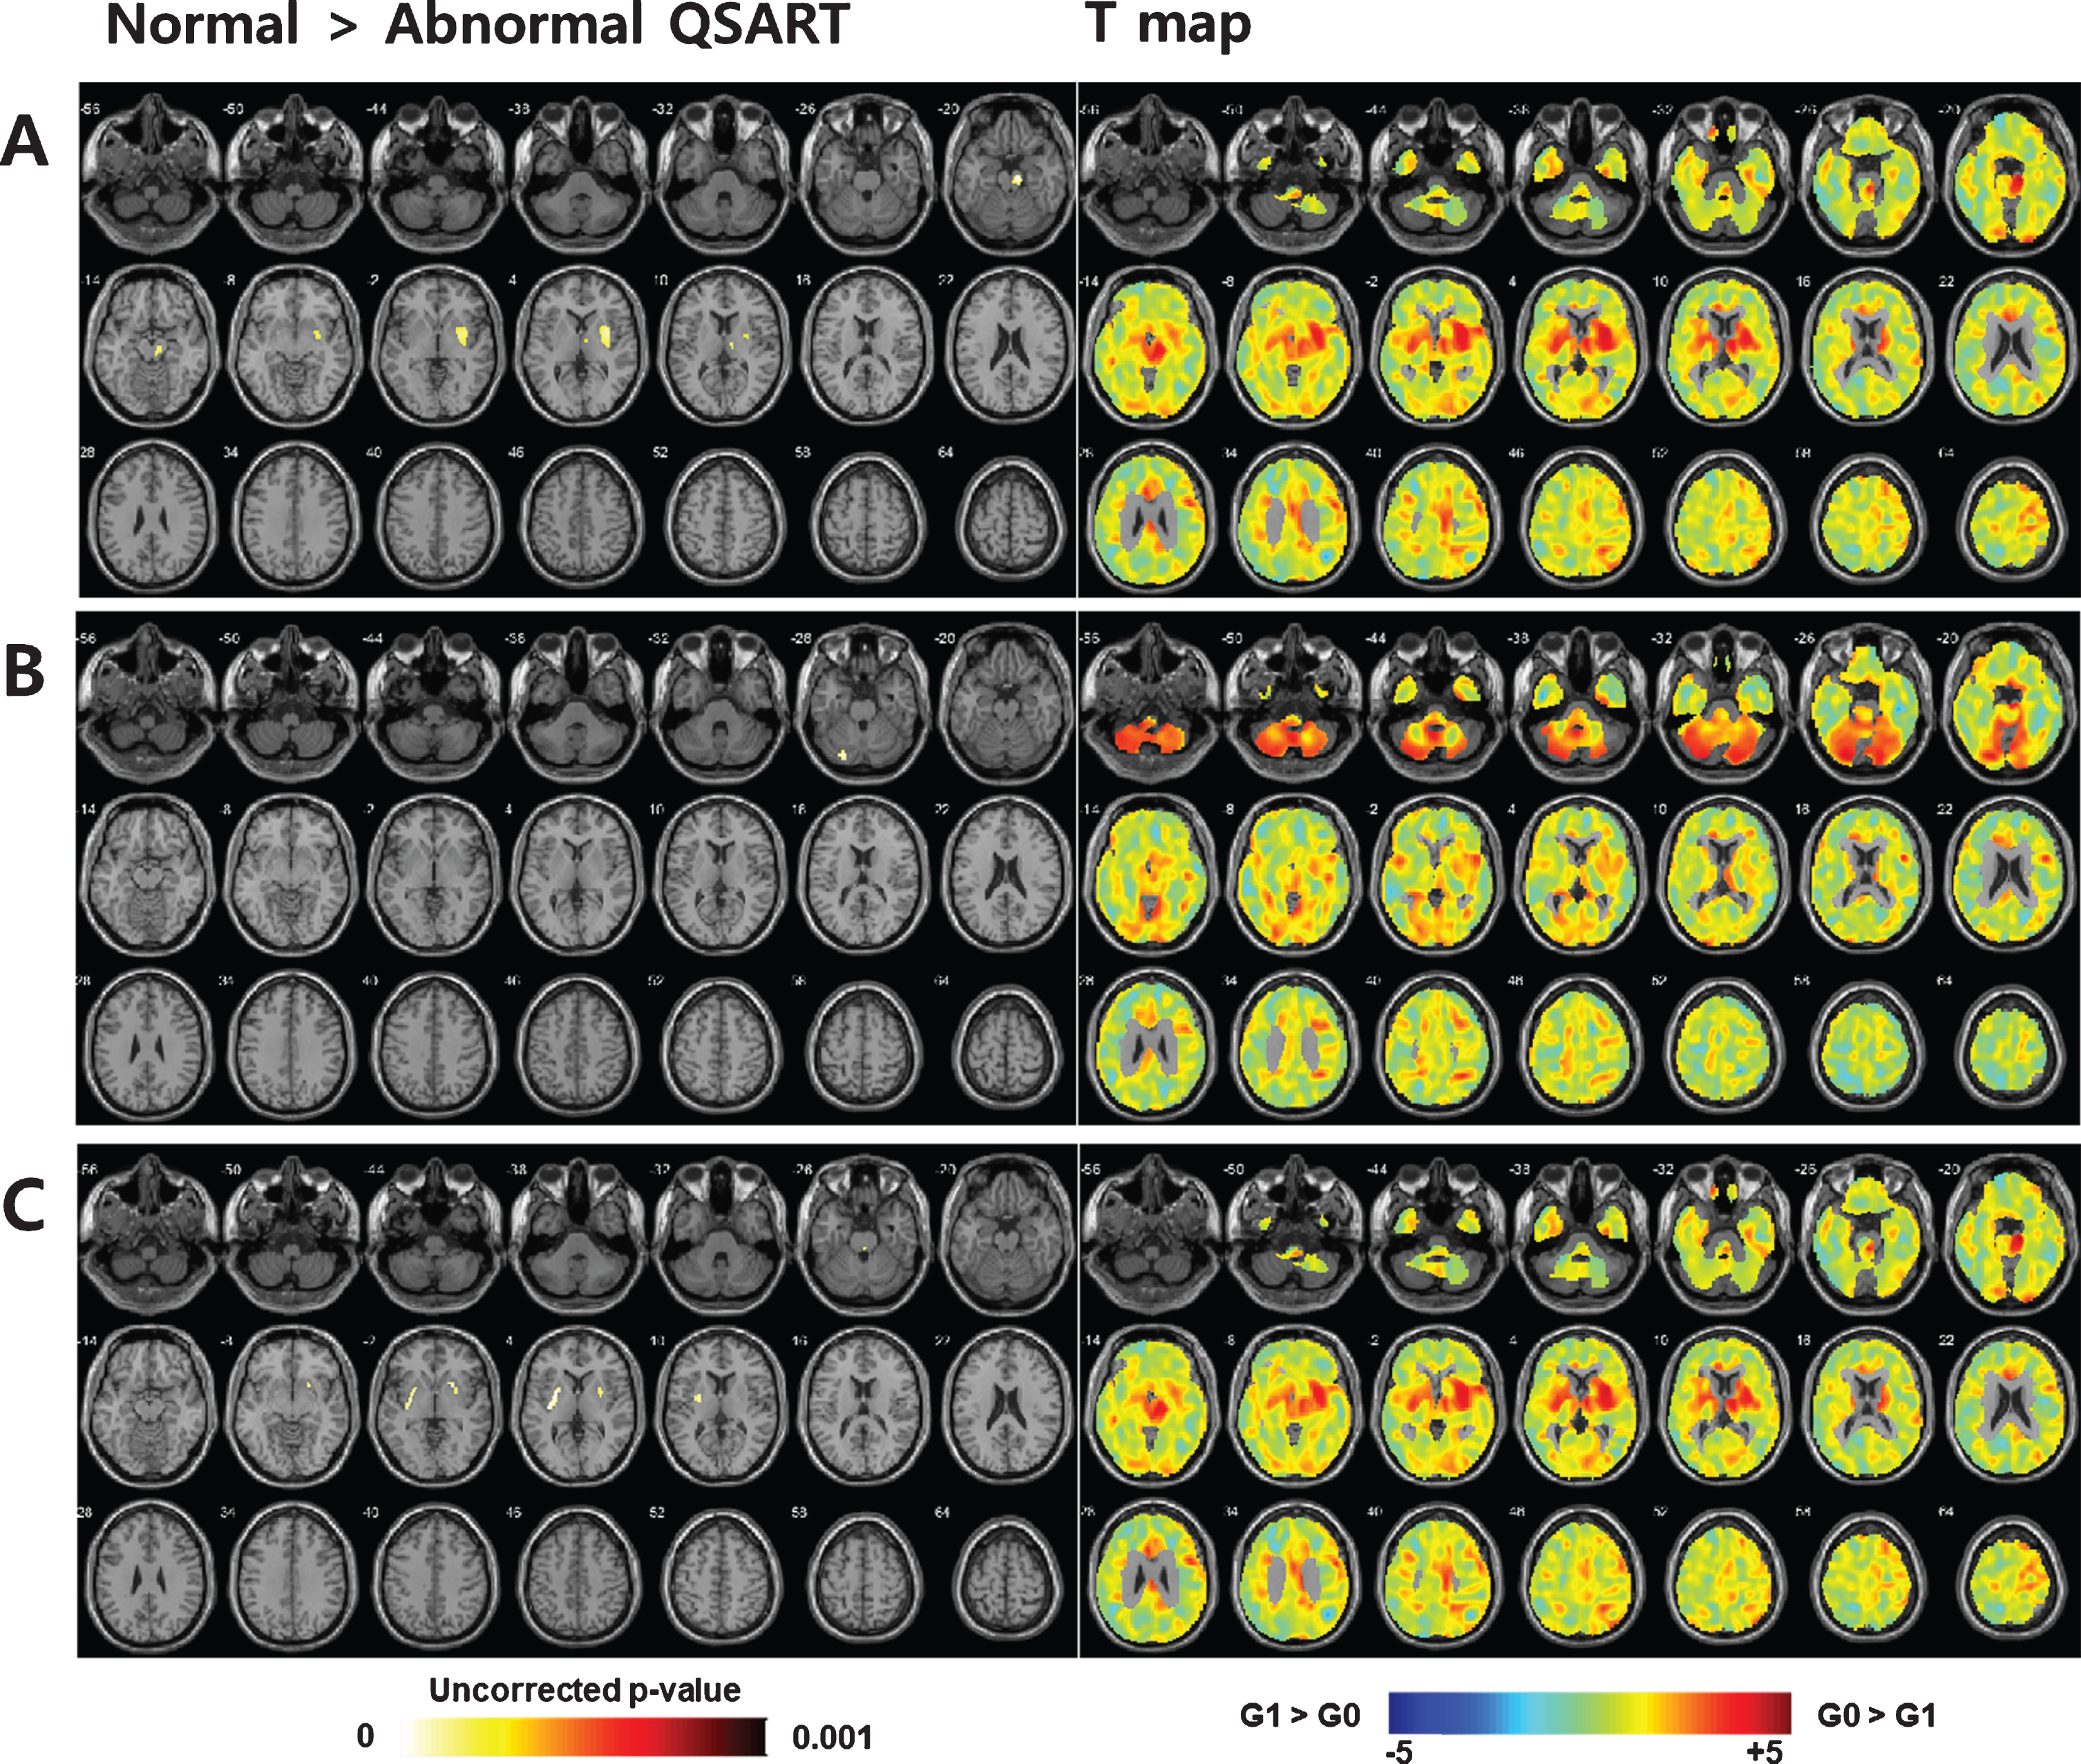
Statistical parametric mapping analysis using 18F-fluorodeoxyglucose positron emission tomography/computed tomography comparing glucose metabolism between patients with normal (normal QSART group; n = 28) and abnormal (abnormal QSART group; n = 46) postganglionic sudomotor function, while placing the more affected putamen on the right side. Overall, the abnormal QSART group shows significant glucose hypometabolism in the midbrain and less affected putamen and thalamus (A). In patients with MSA-P, the abnormal QSART sub-group (n = 25) shows reduced glucose metabolism in the cerebellum compared to the normal QSART sub-group (n = 11) (B). In patients with MSA-C, the abnormal QSART sub-group (n = 21) demonstrates significant glucose hypometabolism in the bilateral basal ganglia compared to the normal QSART sub-group (n = 17) (C). G0, normal QSART group; G1, abnormal QSART group. QSART, quantitative sudomotor axon reflex testing; MSA, multiple system atrophy; MSA-P, MSA with predominant parkinsonism; MSA-C, MSA with predominant cerebellar ataxia.
Association between CASS sudomotor sub-score and brain regional metabolic activity
In correlation analysis, the CASS sudomotor sub-score was negatively correlated with regional metabolic activity in the midbrain, pons, and less affected putamen in patients with MSA (Fig. 2A). In patients with MSA-P, the CASS sudomotor sub-score had a significant negative correlation with regional glucose metabolism in the cerebellum (Fig. 2B). In patients with MSA-C, the CASS sudomotor sub-score showed a negative correlation with regional glucose metabolism in the bilateral basal ganglia (Fig. 2C).
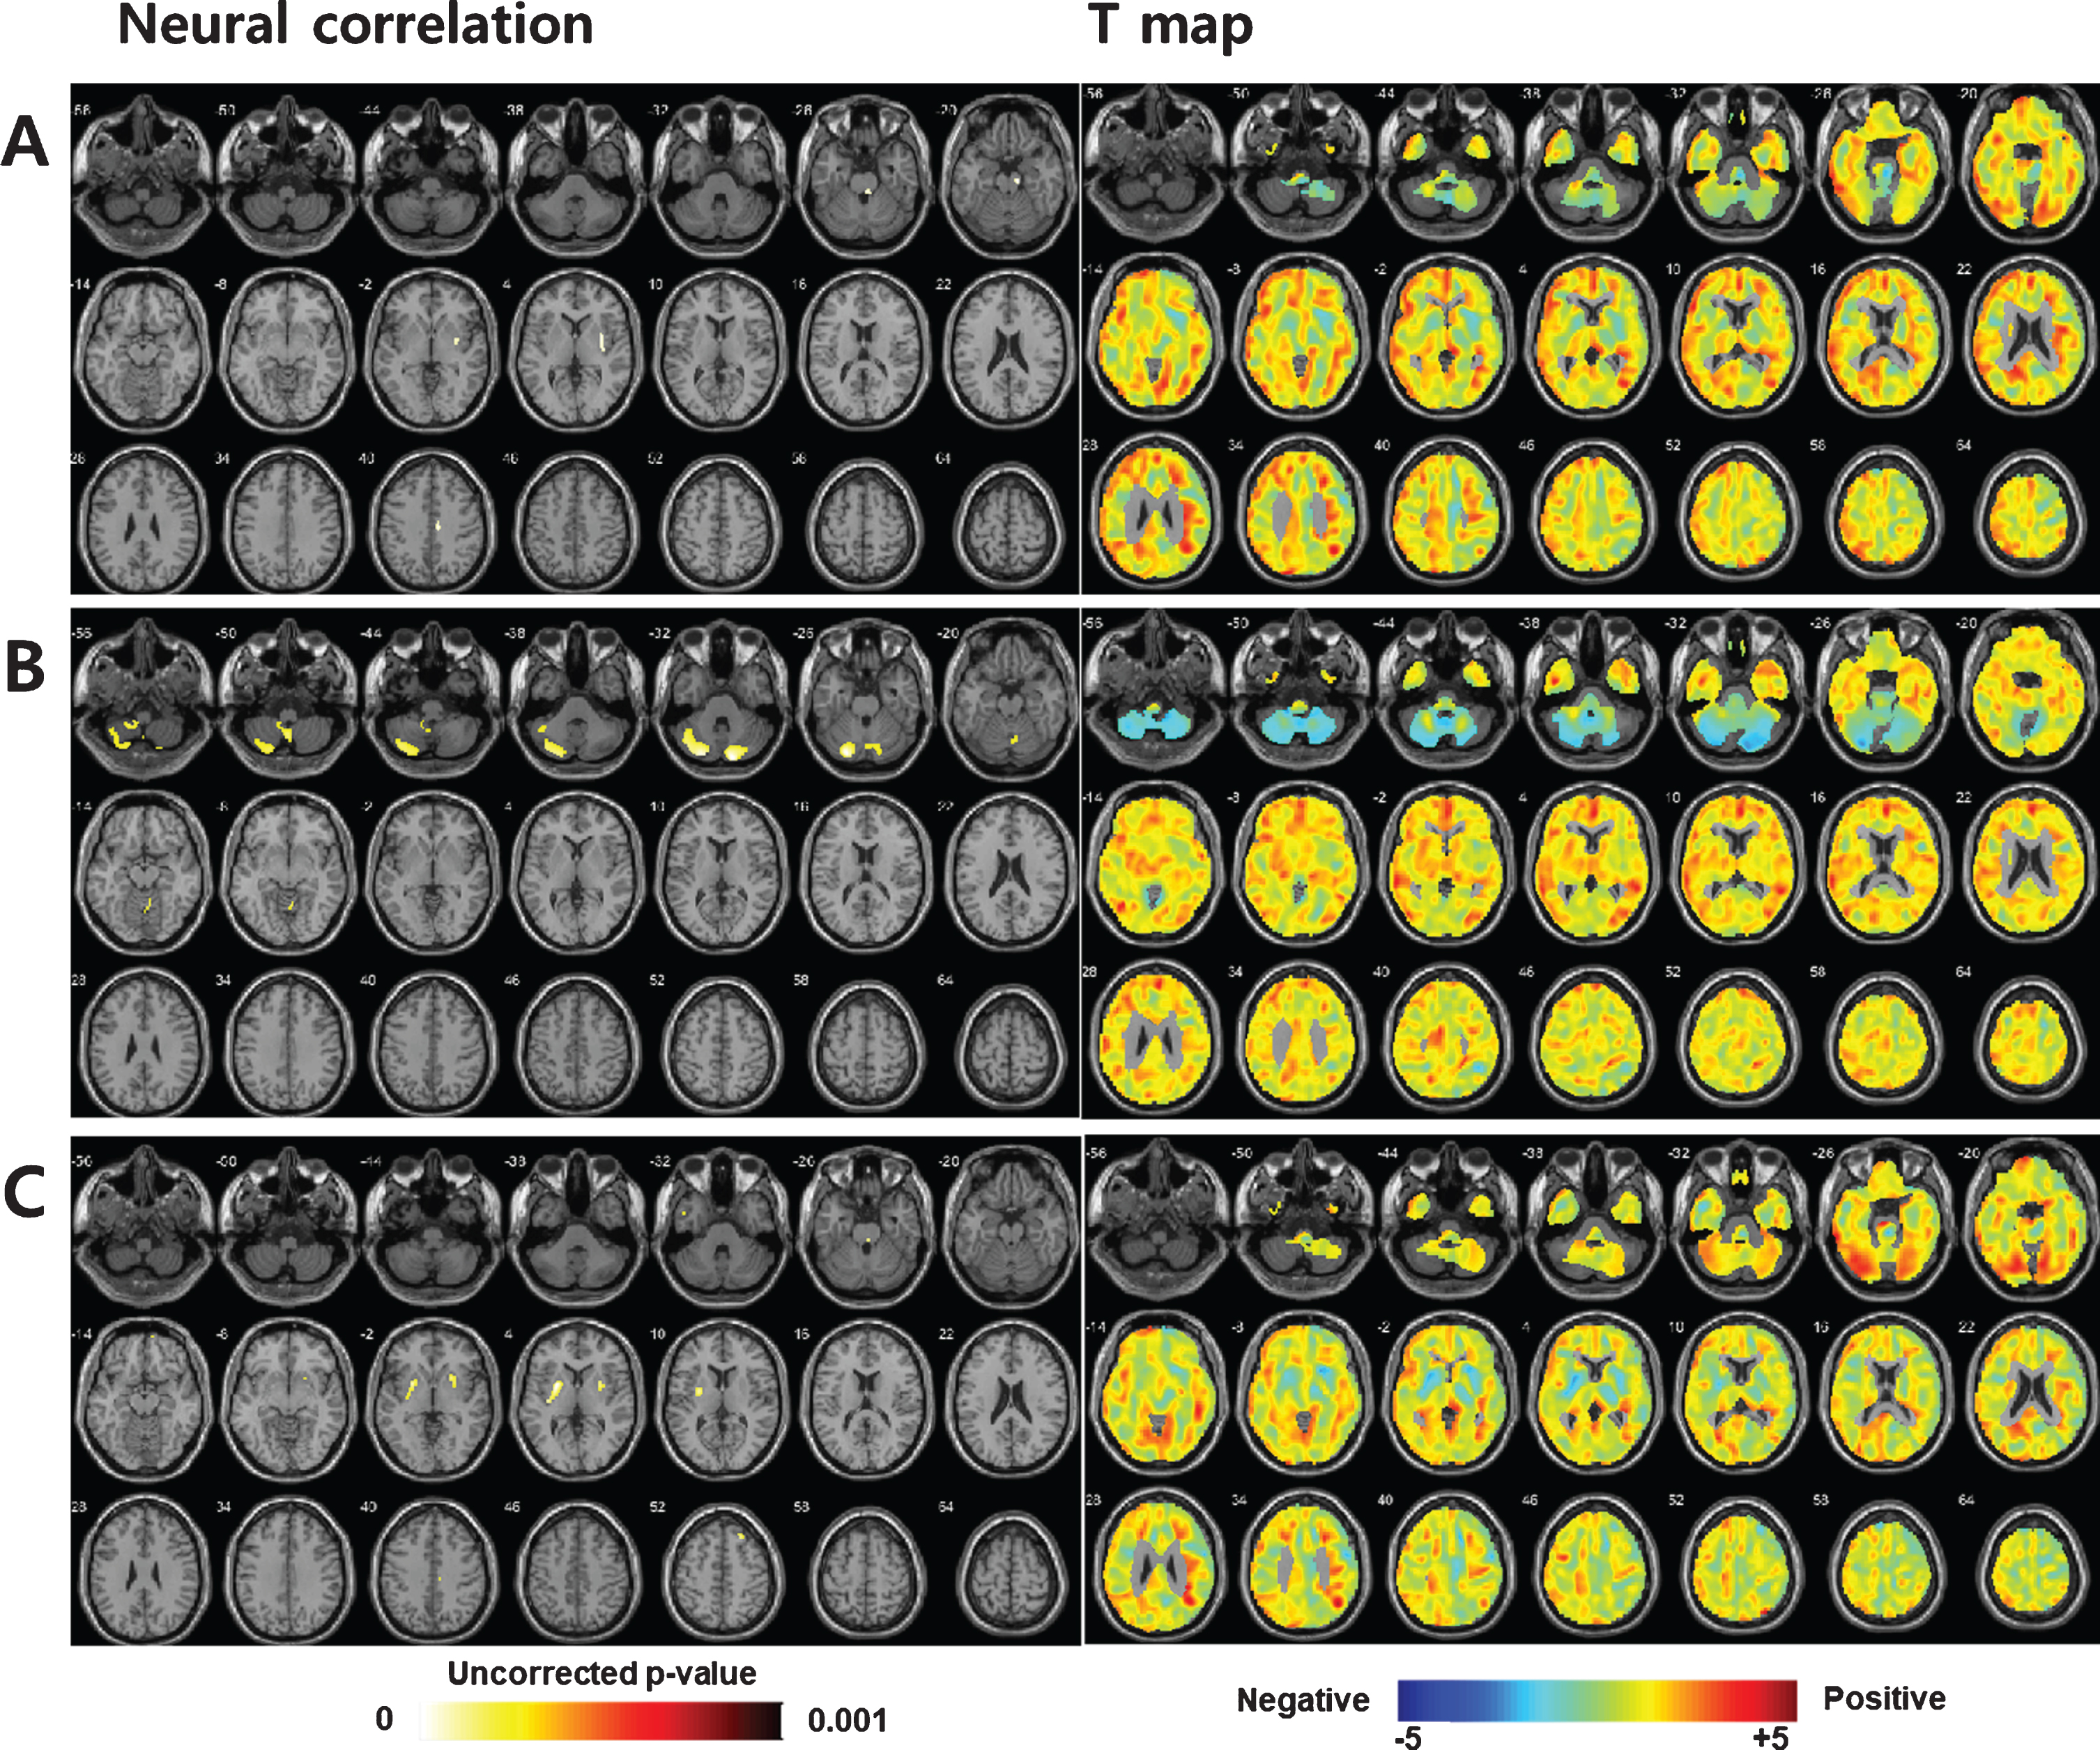
Neural correlation of postganglionic sudomotor dysfunction in patients with MSA. Overall, the CASS sudomotor score demonstrated a significant negative correlation with regional glucose metabolism in the midbrain, pons, and less affected putamen (A). In patients with MSA-P, the CASS sudomotor sub-score demonstrated a significant negative correlation with glucose metabolism in the cerebellum (B). In patients with MSA-C, the CASS sudomotor sub-score showed a significant negative correlation with glucose metabolism in the basal ganglia (C). MSA, multiple system atrophy; MSA-P, MSA with predominant parkinsonism; MSA-C, MSA with predominant cerebellar ataxia; CASS, Composite Autonomic Severity Score.
DISCUSSION
The present study investigated whether the presence of postganglionic sudomotor dysfunction would indicate a greater neurodegenerative load in patients with early stage MSA by performing quantitative analyses of FDG PET data. Approximately 60%of patients with MSA had postsynaptic sudomotor dysfunction. The degree of postganglionic sudomotor dysfunction was significantly associated with the UMSARS Part I and Part II scores. In 18F-FDG-PET analysis, patients with MSA with postganglionic sudomotor dysfunction showed more severely reduced glucose metabolism in MSA-prone regions than those without. These findings suggest that patients with MSA and postganglionic sudomotor dysfunction may have worse disease severity and greater neuropathological burden than those without postganglionic sudomotor dysfunction.
QSART has a distinct clinical implication in contrast to other autonomic function tests, including the Valsalva maneuver, deep breathing test, or tilt table test. Other autonomic function tests mainly evaluate the function of the autonomic circuit, which consists of the brainstem, intermediolateral column of the spinal cord, heart, and lung connected via glossopharyngeal and vagus nerves. Thus, the results of these autonomic function tests are directly influenced by pathologic changes in the brainstem and spinal cord [10, 11]. In fact, previous pathologic studies demonstrated that the depletion of preganglionic sympathetic neurons located in the intermediolateral column or loss of catecholaminergic neurons in the ventrolateral medulla is associated with orthostatic hypotension in patients with MSA [5, 12]. In contrast, QSART mainly assesses the integrity of postsynaptic sudomotor fibers and is not directly affected by the pathologic process in the brainstem and spinal cord [13]. Thus, approximately 40%of patients with MSA demonstrate a normal QSART response consistently in the current and previous studies, although actual sudomotor dysfunction is observed in nearly all patients [3].
Postganglionic sudomotor dysfunction in patients with MSA is being increasingly recognized. Although MSA is generally regarded as a disease that mainly affects preganglionic structures, postganglionic involvement of the autonomic nervous system has not been shown to be uncommon. Up to 30%of patients with MSA demonstrated abnormal uptake in myocardial 123I-metaiodobenzylguanidine-single photon emission computed tomography [14]. In addition to studies that utilized autonomic function tests to demonstrate postsynaptic sudomotor dysfunction in MSA, the results of skin biopsies have consistently demonstrated postganglionic autonomic system involvement. Provitera et al. [15] showed that the sudomotor nerve density is lower in patients with MSA than in healthy individuals. Donadio et al. [16] also demonstrated morphological changes in adrenergic and cholinergic fibers in the dermal tissue of patients with MSA with long disease duration. The pathogenesis of postsynaptic sudomotor dysfunction in patients with MSA is considered multifactorial. It can be secondarily caused by trans-synaptic changes following preganglionic sympathetic cell depletion as the disease progresses [6]. Alternatively, it can be caused by the direct loss of postsynaptic sudomotor fibers even in early stages. In a recent study that performed a skin biopsy in patients with MSA, deposition of alpha-synuclein was observed in the cutaneous nerve fibers of patients with MSA [7]. Since patients enrolled in the current study were at an early stage of MSA, direct postganglionic involvement might account for a substantial proportion of cases with postsynaptic sudomotor dysfunction. In other words, the presence of postsynaptic sudomotor dysfunction might be an indicator of additional disease burden in patients with early stage MSA, as it reflects the pathological process occurring in both pre- and postganglionic sudomotor nerves.
An additional disease burden in patients with MSA with postganglionic sudomotor dysfunction was observed in the form of severe motor dysfunction as well as a decrease in brain metabolic activity. Contrary to the CASS adrenergic sub-score, which was only associated with the autonomic sub-score of UMSARS Part I, the CASS sudomotor sub-score was additionally associated with motor disability as assessed by the UMSARS Part II score. Moreover, the CASS sudomotor sub-score was significantly correlated with hypometabolism of the cerebellum and basal ganglia in patients with MSA-P and MSA-C, respectively. These results support our hypothesis that postganglionic sudomotor dysfunction in patients with MSA reflects the additional pathological burden in central structures and severe motor disability in patients with MSA. Meanwhile, postganglionic sudomotor dysfunction does not appear to predict disease severity in Parkinson’s disease (PD). Previous studies have demonstrated that nigral degeneration was unrelated to either cardiac sympathetic denervation [17] or sudomotor dysfunction assessed using QSART in patients with PD [18]. A recent cross-sectional study showed that cardiovagal function correlated with the progression of motor function, whereas sudomotor function was not associated with advanced stage or severe motor symptoms [19]. The reason underlying the difference in the clinical relevance of postganglionic autonomic system involvement between MSA and PD is probably that postganglionic involvement of the autonomic nervous system predominates in PD, whereas preganglionic structures are mainly affected in MSA [14]. Further studies are needed to clarify whether neurodegenerative processes that take place in both postganglionic sudomotor nerves and central structures are facilitated by shared pathological loops or develop in parallel in patients with MSA.
Our study has some limitations. Not all patients were uniformly assessed using autonomic function tests, 18F-FDG-PET, and UMSARS during the study period due to its retrospective nature and the possibility of selection bias exist. In particular, UMSARS was not evaluated within 3 months of the autonomic function test in 17 (23.0%) patients with MSA, which may be a source of biased interpretation of results. However, we could obtain similar results when we additionally performed subgroup analyses for brain regional metabolic activity in 57 patients with MSA who were initially assessed by the UMSARS. Another limitation is that postganglionic sudomotor dysfunction was assumed based on the results of QSART but was not histologically confirmed. However, the correlation between sudomotor nerve fiber density and functional sudomotor impairment was demonstrated in a previous study [15, 20]. Additionally, study participants did not perform TST, which is required to accurately localize the lesion related to sudomotor dysfunction (i.e., either preganglionic or postganglionic, or both preganglionic and postganglionic). Finally, greater hypometabolism on FDG PET may not be specific for postganglionic sudomotor pathology and a longitudinal study with a larger sample would be needed to draw a firm conclusion.
In conclusion, unlike other autonomic subdomains, postganglionic sudomotor dysfunction was associated with motor dysfunction in patients with MSA. Patients with postganglionic sudomotor dysfunction were likely to have more severe motor dysfunction and more severely reduced glucose metabolism in MSA-prone regions than in those without. Postganglionic sudomotor dysfunction might be an indicator of neuropathological burden in patients with MSA.
Footnotes
ACKNOWLEDGMENTS
This research was supported by a grant funded by the Korean Society of Pain and Autonomic Disorders
CONFLICT OF INTEREST
None of the authors has any conflict of interest to disclose.
ETHICS APPROVAL
The study including human participants was approved by the Severance Hospital Institutional Review Board (Approval No. 4-2019-0211) and has therefore been performed in accordance with the Declaration of Helsinki. Institutional ethical approval for retrospective analysis of human data was obtained and informed consent was waived.