
Abstract
Background:
Parkinson’s disease (PD) is the most frequent movement disorder. Patients access YouTube, one of the largest video databases in the world, to retrieve health-related information increasingly often.
Objective:
We aimed to identify high-quality publishers, so-called “channels” that can be recommended to patients. We hypothesized that the number of views and the number of uploaded videos were indicators for the quality of the information given by a video on PD.
Methods:
YouTube was searched for 8 combinations of search terms that included “Parkinson” in German. For each term, the first 100 search results were analyzed for source, date of upload, number of views, numbers of likes and dislikes, and comments. The view ratio (views / day) and the likes ratio (likes * 100 / [likes + dislikes]) were determined to calculate the video popularity index (VPI). The global quality score (GQS) and title - content consistency index (TCCI) were assessed in a subset of videos.
Results:
Of 800 search results, 251 videos met the inclusion criteria. The number of views or the publisher category were not indicative of higher quality video content. The number of videos uploaded by a channel was the best indicator for the quality of video content.
Conclusion:
The quality of YouTube videos relevant for PD patients is increased in channels with a high number of videos on the topic. We identified three German channels that can be recommended to PD patients who prefer video over written content.
Keywords
INTRODUCTION
Parkinson’s disease (PD) is the most frequent movement disorder and severely affects the patients’ quality of life [1]. Worldwide, 6.1 million individuals had PD (year 2016) [2], with a prevalence in Germany of 800 in 100,000 inhabitants resulting in more than half a million patients and a multitude of affected families [3]. PD is a chronic progressive disorder: drugs to treat symptoms are available but treatments to stop disease progression are lacking. This results in a high demand for adequate information on disease, treatment and occupational therapy for patients, their care givers, and their relatives. Shared decision making increases both the patients’ satisfaction with their therapy and the quality of life [4, 5]. The desire for quality information is even higher in times of the pandemic, when patients suffering from chronic disorders try to avoid visits to their physicians or to enter a hospital [6]. YouTube is one of the biggest video databases in the world and one of the most popular websites on the Internet [7]. It has become a resource for sharing people’s experiences on healthcare issues and it is an important source when seeking health related information [8, 9]. At least one third of older adults have used the Internet to access health related information [10]. It is increasingly consulted by patients with chronic disorders for many reasons: The need for a second opinion, the search for support, and a wish to increase personal knowledge about the disease [11]. While an English study showed that written content on websites for patients with PD seems to be too difficult to understand [12], videos might be an accessible, effective, and informative educative tool that helps to improve the quality of life of PD patients [11]. Physical activity is necessary for PD patients and should be conducted on a daily basis. In this context, videos have potential advantages over written information, as they may contain easy-to-follow instructions, which can be imitated by the patients. Nevertheless, the available videos are of varying reliability and lack content quality control or even institutional oversight by experts [13]. The aim of this study was to systematically summarize available German videos about PD on YouTube and to analyze the video metrics. We hypothesized that 1) the number of views and 2) the number of uploaded videos by an individual channel were indicators for the quality of the information given by a video and that 3) the SARS-CoV-2 pandemic led to an increase in uploaded video content.
MATERIALS AND METHODS
Ethics
The Institutional Review Board of the Faculty of Medicine of Rheinisch-Westfälische Technische Hochschule Aachen (reference number EK 368-19) has approved the study. It was performed in accordance with the ethical standards of the 1975 Declaration of Helsinki and its later amendments.
Inclusion of videos
Data was obtained from publicly available YouTube videos. To process search requests automatically, the YouTube API (application programming interface) v3 was accessed using a custom designed Python program. The search parameters “region Co-de” and “relevance Language” were set to “de” (i.e., German). For each search request, the first 100 results were exported to a table for manual analysis. In addition to the title of each result, the meta inf-ormation (title, source, date of upload, number of views, likes, dislikes, and comments) was parsed into the table. When entering a search keyword, the YouTube algorithm proposes additional search suggestions. We entered “Parkinson” and separately sel-ected 6 additional search suggestions relevant to the patients’ daily life. This resulted in the 7 in-dividual search requests (German search term in brackets): Parkinson (“Parkinson”), Parkinson symptoms (“Parkinson Symptome”), Parkinson exercises (“Parkinson Übungen”), Parkinson’s disease (“Parkinson Krankheit”), Parkinson explanation (“Parkinson Erklärung”), Parkinson gait (“Parkinson Gangbild”), and Parkinson end stage (“Parkinson Endstadium”). Furthermore, we searched for Parkinson experiences (“Parkinson Erfahrungen”). The search was performed on 12 October 2020. Videos published later were not included. All 8 search terms were entered in German, and only videos in German language were considered in the manual analysis (even though the search parameters were set to German, several non-German search results were returned). The exact function of the YouTube search algorithm is a company secret and not disclosed to the public. Thus, none of the search keywords may be part of the results and videos unrelated to this study are retrieved (e.g., videos about multiple sclerosis or cancer). These videos were manually excluded (Fig. 1). The channel (upload source) was categorized into 12 entities (physician, health information portal, specialist society/university, hospitals, other practitioners, health insurances, support groups, news agency/TV, commercial providers, other commercial providers, patients, other non-commercial providers). The category “other practitioners” included professional practitioners who were not physicians, such as physiotherapists. “Commercial providers” were selling a product or a drug. “Other commercial providers” represented channel sources that were not selling a product but had commercial interests (e.g., services).
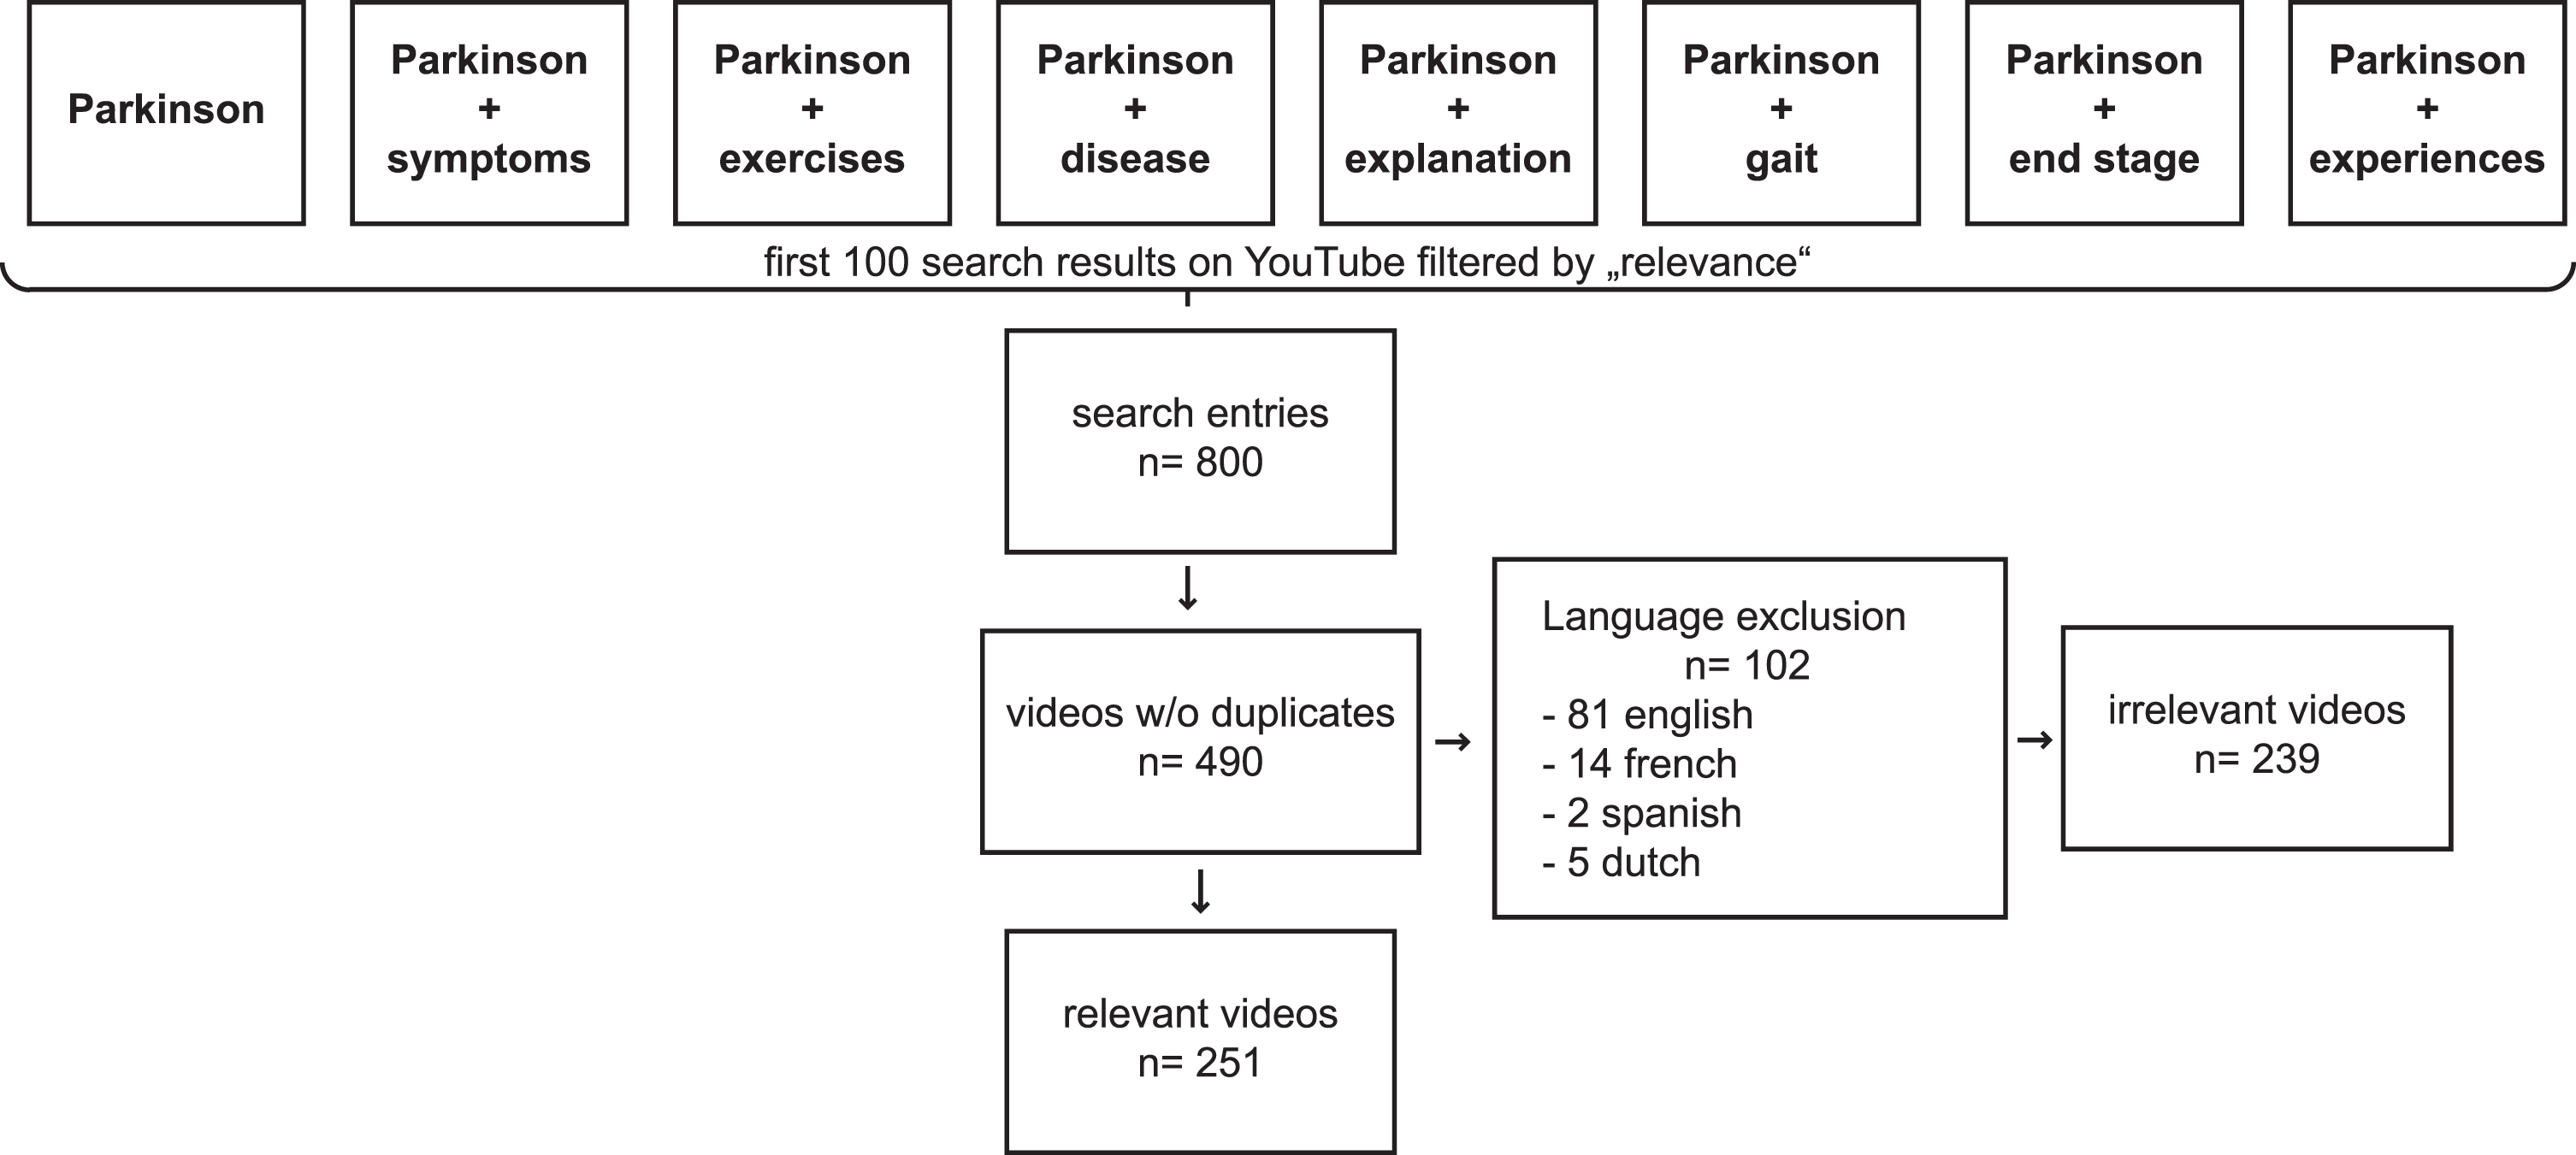
Search strategy and inclusion criteria. The first 100 results of 8 different search requests entered the study. Duplicates and non-German videos were deleted. The relevance of the videos was checked by reviewing the video title. 251 videos entered the study.
Indices for video evaluation
The ratio of views (number of views / days) and the ratio of likes (likes * 100 / [likes + dislikes]) were determined to calculate the Video Popularity Index (VPI) as described by Erdem et al. [14]. The VPI was calculated according to the following formula: [ratio of likes * ratio of views] / 100 [14]. The Global Quality Score (GQS) consists of five statements to evaluate overall quality, information content, flow of information, and usefulness to patients (from 1: poor quality to 5: excellent quality) [15–17]. The title –content consistency index (TCCI) is based on a 5-point Likert scale ranging from 1 (poor consistency) to 5 (high consistency), which aims to identify if there is a gap between title and content [17]. A neurologist with special training in movement disorders scored the videos.
Effects of the SARS-CoV-2 pandemic
We assessed whether the SARS-CoV-2 pandemic had an effect on the number of uploaded videos. 15 March 2020 was set as the start of the pandemic in Germany. This date corresponds to the decision for the lockdown by the national authorities. The number of uploaded videos from 15 March to 12 October (date of data acquisition) were extrapolated to a 12-month period to calculate the estimated increase in video upload for 2020. This number was compared to the average increase of the previous 5 years. Additionally, we analyzed Google Trends for Google and YouTube searches in the timeframe between 13 October 2019 and 12 October 2020 for the search terms defined above and for physiotherapy (“Physiotherapie”) alone worldwide, and for Germany (Supplementary Figure 1).
Data analysis
Manual curation of each video was compiled in a database (Microsoft Excel version 16.42 [Microsoft, Redmond, WA, USA]). All computations were performed using MATLAB R2019b, The MathWorks, Natick, MA, USA. Statistical analyses were performed using SPSS 26.0, IBM, Armonk, NY, USA and Prism 8, GraphPad, San Diego, CA, USA. Des-criptive statistics were applied. Normal distribution of data was tested by the Kolmogorov-Smirnov and Shapiro-Wilk tests. As it was impossible to transform the non-normal data using neither ×2, 1/x, root nor ln, a non-parametrical test (Kruskal-Wallis-Test) was applied to determine differences between groups. Post-hoc analyses used Dunn’s multiple comparison test to correct the p-value for multiple testing. Significance was defined as p < 0.05.
RESULTS
We deleted duplicates (n = 310) from the 800 search results and excluded all videos in languages other than German (n = 102). Out of 490 videos screened, a total of 251 videos matched our inclusion criteria as described in the methods-section. The total duration of the included video material was 2,966 minutes (min), which amounts to approximately 48 h uploaded by 134 different channels. The median duration of a single video was 5 min (interquartile range (IQR) 3.0–11.7 min). The number of cumulative views of all videos amounted to 2.6 million, the median of the number of views was 1,966 views. The number of new videos increased exponentially (Fig. 2). 78% of the analyzed videos were from Germany (n = 196), 8% from Austria (n = 21), and 5% from Switzerland (n = 13). One video was from Luxembourg, 4 from Spain, and 1 from USA. In 15 vid-eos, the country of origin could not be determined. Video metrics and publisher category per country are given in Supplementary Tables 2and 3. We calculated the number of videos per 100,000 inhabitants to compare the proportion of videos per country (Supplementary Table 4). Germany and Austria were represented with 0.09 videos/100,000 inhabitants. Switzerland and Luxembourg appeared with 0.06 videos per 100,000 inhabitants.
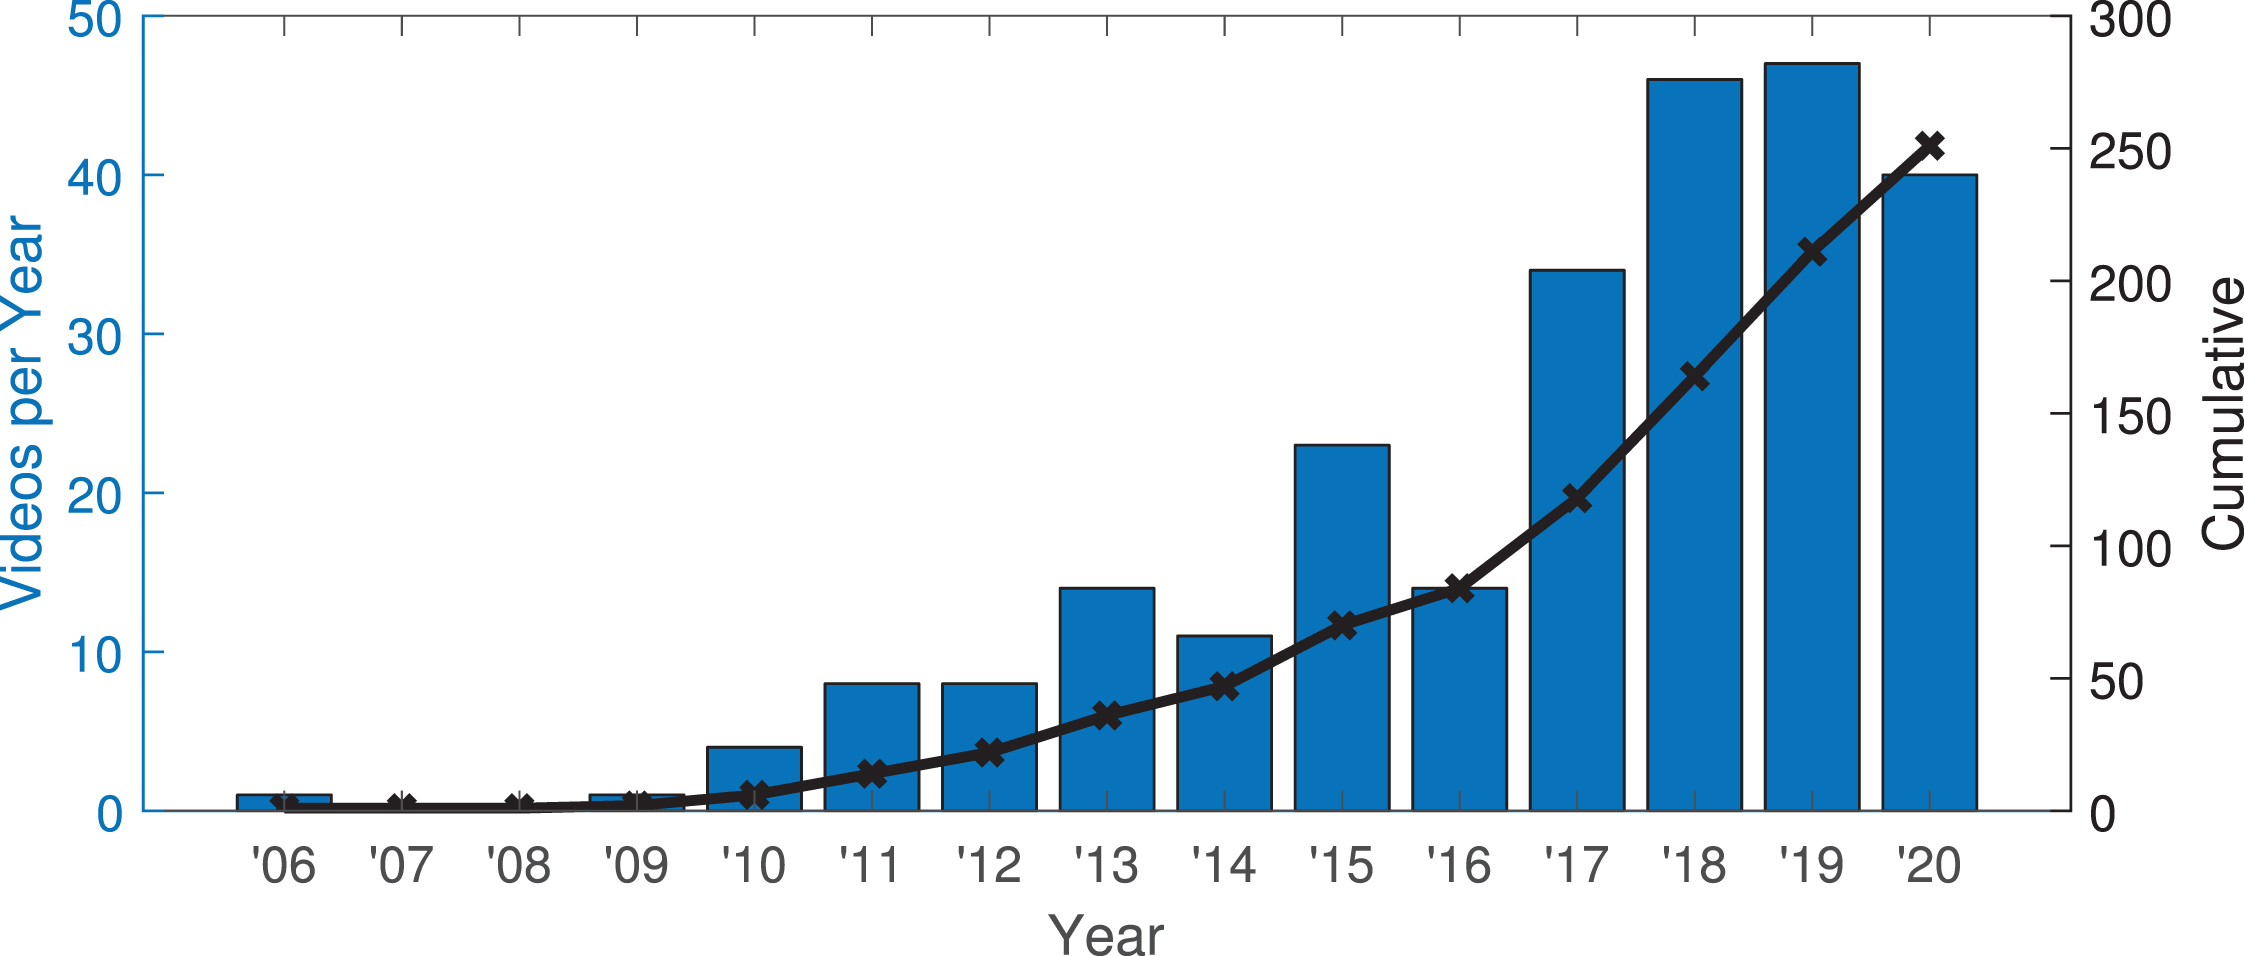
The number of videos increased annually. The number of videos published each year increased indicating a growing supply and demand of video-based health information.
Publishers and video duration
A detailed analysis of all videos subdivided by the publisher category is given in Table 1. 57 videos were uploaded by news agencies or TV channels, 124 videos came from health professionals (other practitioners, hospitals, support groups, physicians, health insurances, health information portals), and 34 videos were generated by commercial providers. Physicians, hospitals, and specialist societies exceeded the median duration of 314 seconds per video by almost the double length (643, 649, and 518 seconds, respectively) but still gained a high median number of views (physicians 15,292 views, specialist society 3154 views, hospital 2966 views).
Descriptive statistics for type of publisher category
Video popularity
While physicians and health information portals were expected to gain a high VPI due to their high number of views, patient videos ranked within the three highest VPI publisher category. Videos published by commercial providers (pharma and therapy devices) tended to be low in number (n = 18), were relatively short (median 127 seconds), had a small number of viewers (median 554 views), and did not engage people to leave a comment, to like, or to dislike the video (lowest ranking of VPI = 0.73).
Uploads per channel
The number of videos uploaded per channel was analyzed (Fig. 3). Most channels had released 1 to 3 videos (123 channels, 92%). Three channels had published 10 and more videos. These three channels were owned by a physiotherapist with a special interest in PD treatment, a support group, and a patient curating video content (Table 2). These three channels (“PD Channels”) alone published 50 videos (or nearly 20% of all videos) that entered the analysis. In addition, the PD channels had published several more videos than did not enter the analysis (Table 2). Manual analysis of those videos revealed that several would have matched our inclusion criteria. We evaluated 10 videos ranked by highest views (Supplementary Table 1) for overall quality using the GQS and TCCI instrument and compared them both to the 10 videos with the highest number of views and to the videos published by a physician (n = 8). Videos of the group “PD Channels” ranked significantly higher on the GQS than the other groups (p = 0.008). The TCCI of the “PD Channels” was significantly higher compared to the group of videos with the highest views (p = 0.0037), but not when compared to the videos published by a physician (Fig. 4).
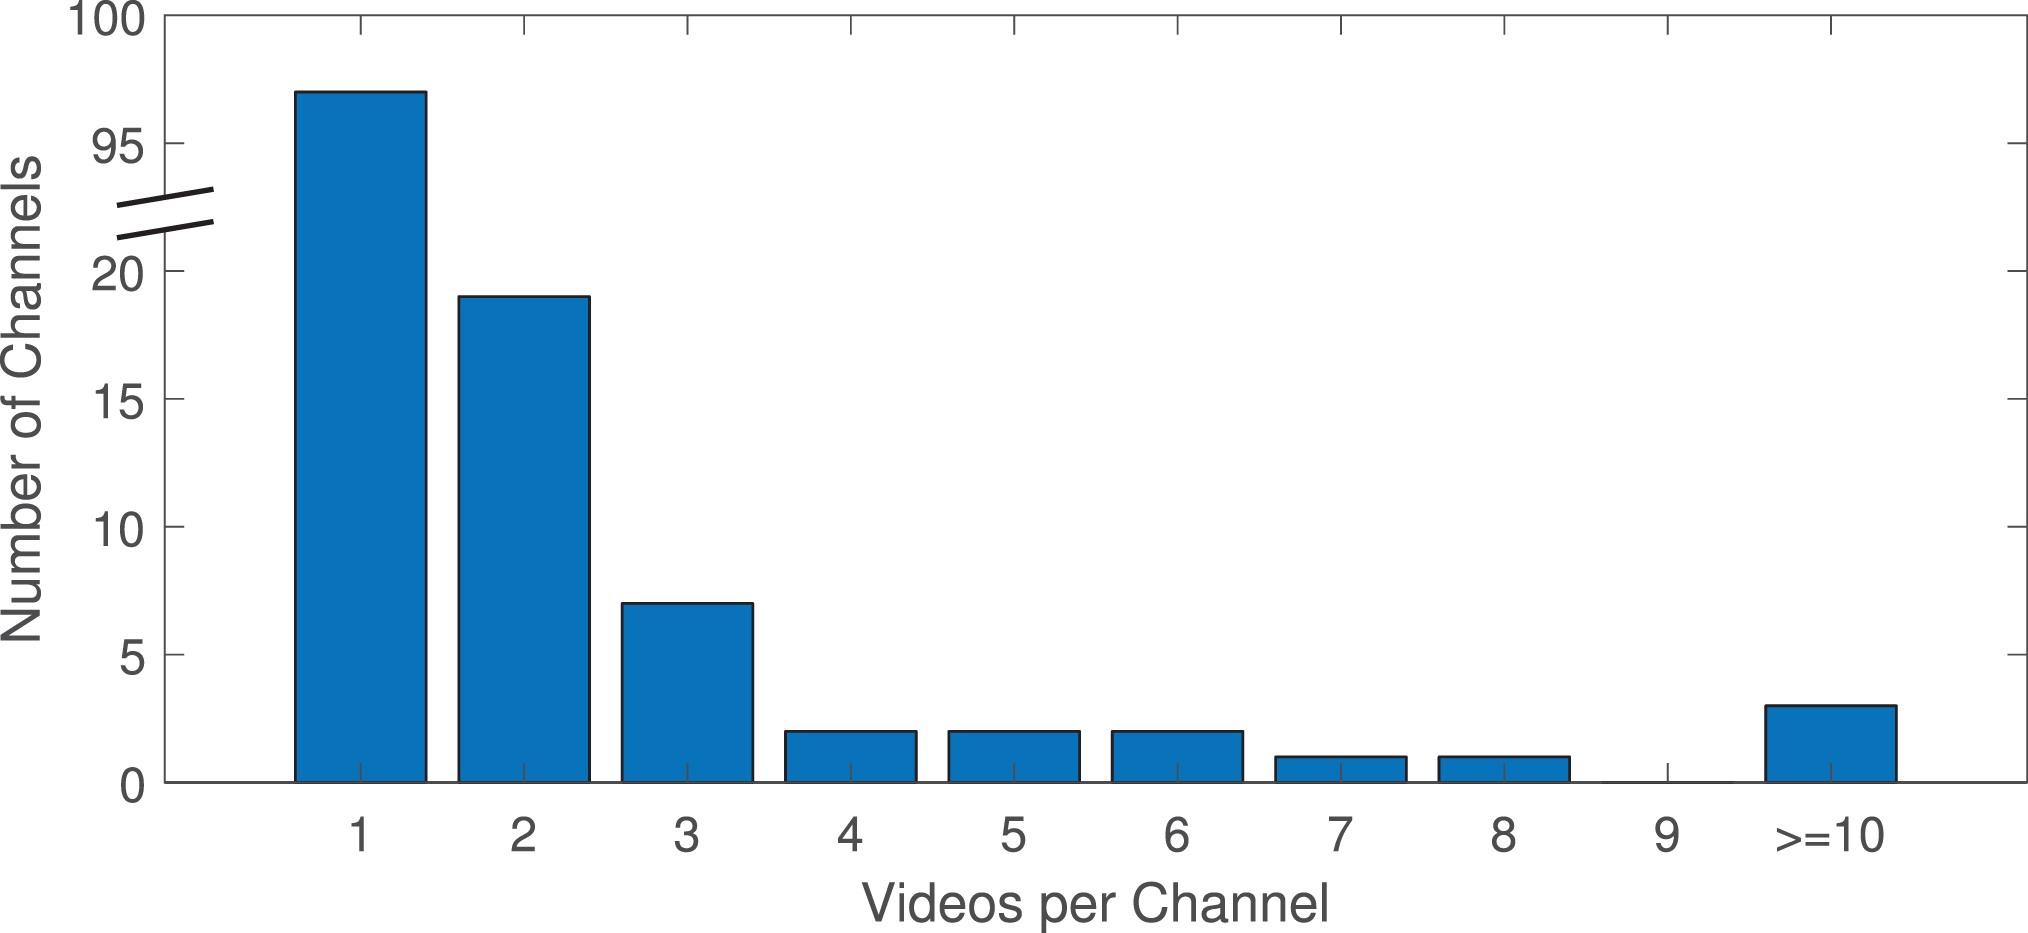
Number of videos per channel. While most individual publishers uploaded only one video that met the inclusion criteria, we found that publishers with 8 or more videos published videos with higher quality for patients as assessed by the global quality index.
Channels focused on Parkinson’s disease
*Assessed on 10 January 2021, rounded.°Automated subtitles available in many languages.
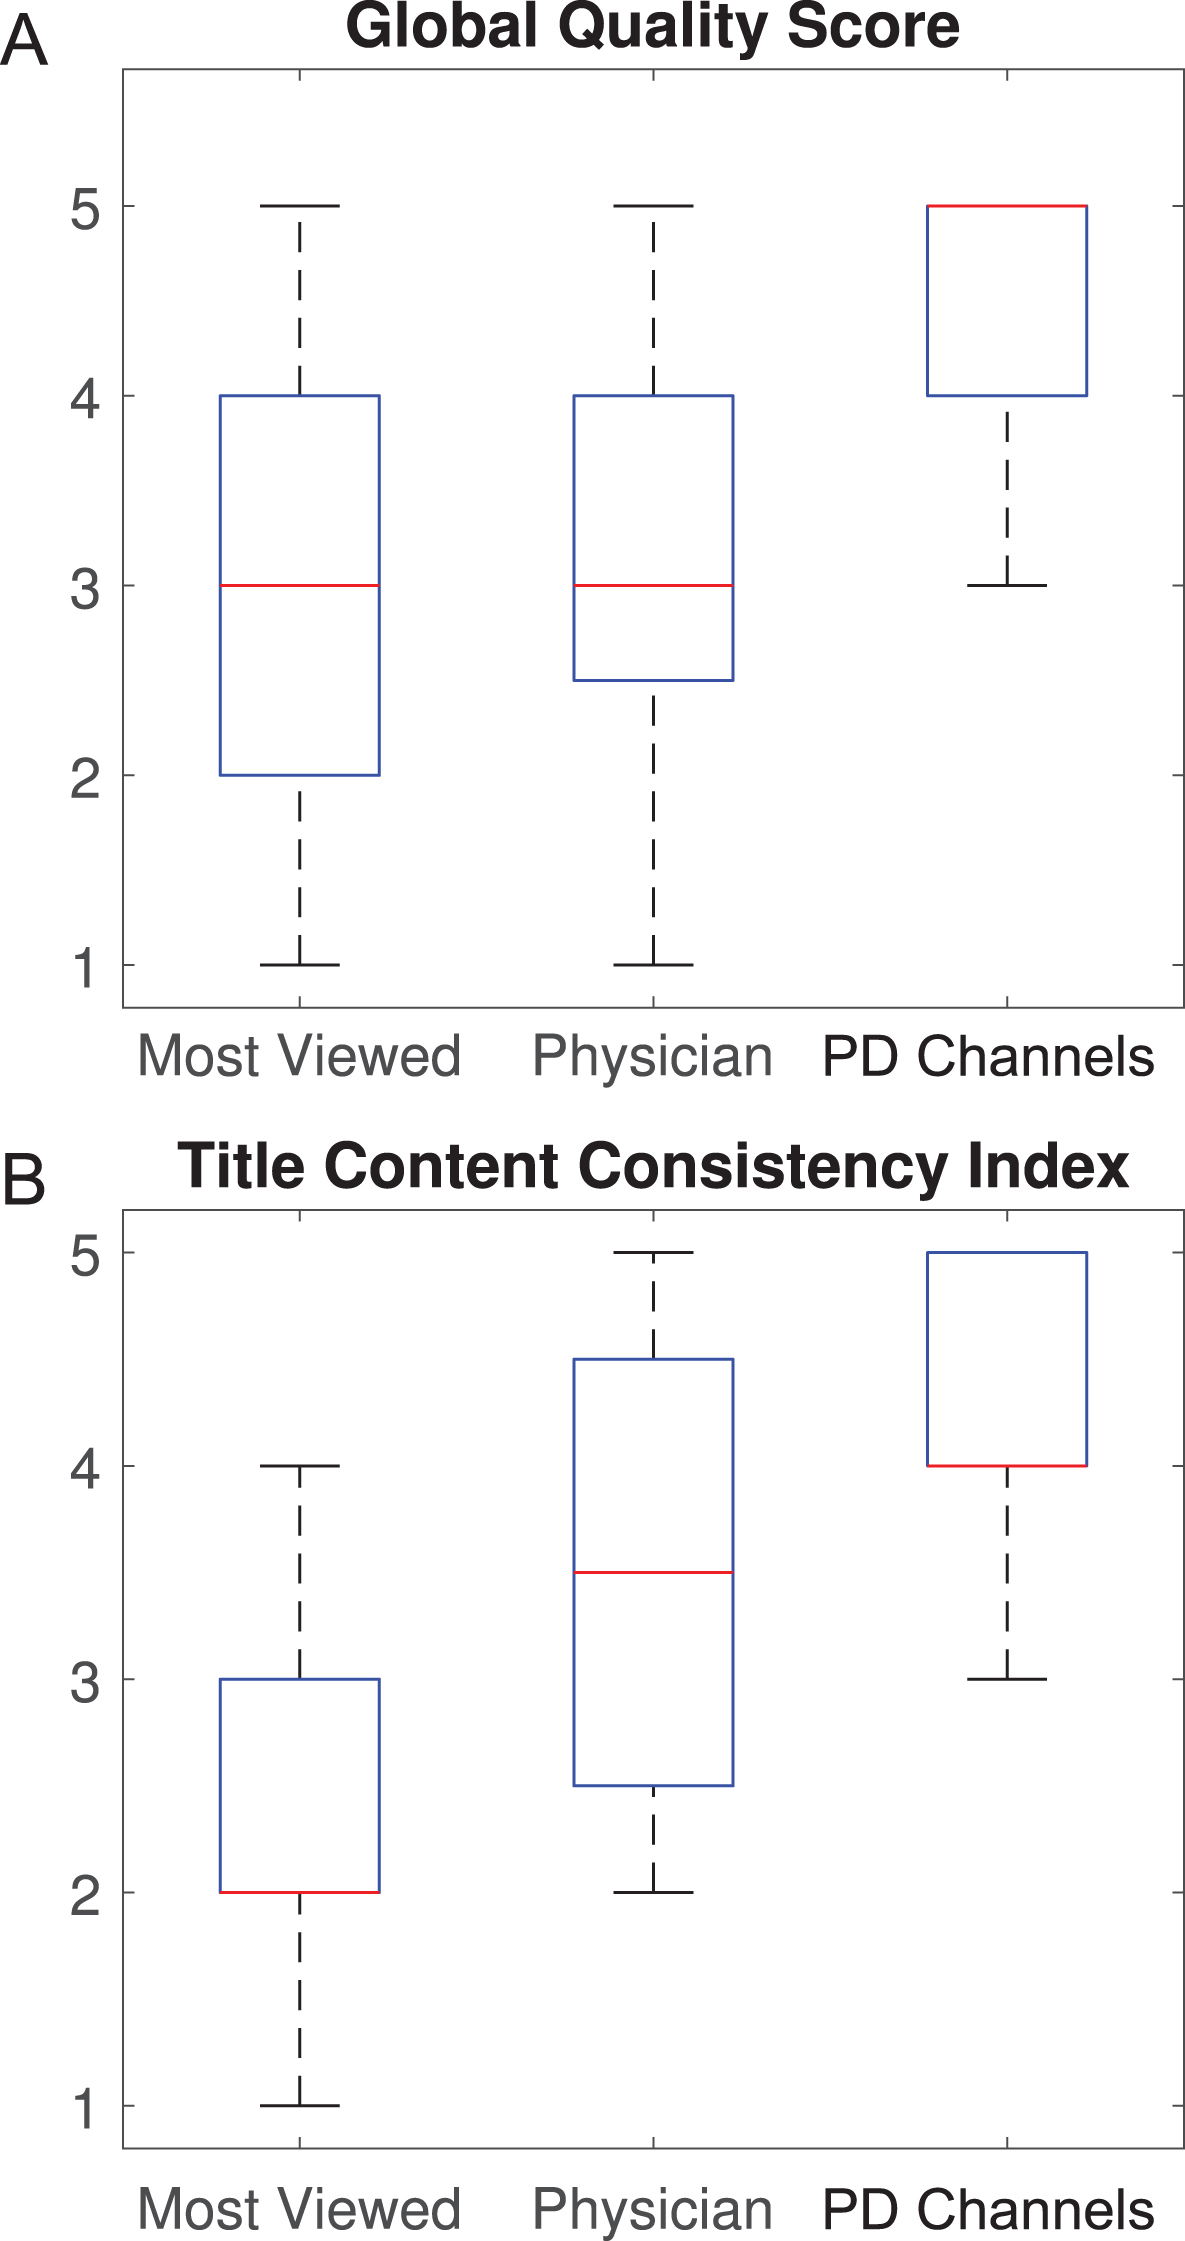
GQS and TCCI of video comparison. Box plots of GQS and TCCI of 3 video groups: the first group consists of the first 10 videos with most views within the study. The second group are the videos published by a physician. The last group are the first 10 most viewed videos from the “PD Channels”.
Effects of the SARS-CoV-2 pandemic
The SARS-CoV-2 pandemic did not result in an increase of uploaded video material. After the start of the lockdown in Germany on 15 March 2020 to the inquiry of this search, 35 videos were uploaded. Projected to a one-year period, this would correspond to 55.4 videos, 8.4 videos more than in 2019. The mean annual increase in the last 5 years was 7.4 videos per year with a positive gradient. Thus, the observed increase in uploads did not exceed the expected increase given the 5-year timeframe. Google Trends did not reveal an increase in search requests for Google and YouTube for the search terms defined above in the time frame analyzed.
We designed a flyer containing the links to the “PD Channels”, which is available at (https://www.neurologie.uni-kiel.de/de/neuromechanik-neurorehabilitation/fuer-patienten/flyer-youtube-parkinson.pdf). Patients can download the file or physicians can use this flyer while counseling PD patients and their relatives.
DISCUSSION
The present study tested the hypothesis that the number of views and the number of uploaded videos were indicators for the quality of the information given in a video dealing with PD on YouTube and whether the SARS-CoV-2 pandemic increased the number of videos. The findings indicate that 1) YouTube videos on PD were a relevant source of information for patients and relatives, 2) physicians, hospitals, and specialist societies had significantly longer videos, 3) channels with most videos uploaded covered issues that were most relevant to the daily life of PD patients, and 4) we could not detect an effect of the SARS-CoV-2 pandemic on the number of uploaded videos during the period of inves-tigation.
YouTube is a relevant source of PD information
With 251 identified relevant videos within the study, amounting to approximately 48 h of video content with more than 2.6 million views, YouTube is a relevant source of health information in the daily life of PD patients, their relatives and care givers [9, 18]. The number of videos increased annually, underlining a growing supply and demand of video-based health information for PD. The majority of videos were from Germany, but also videos from Austria, Switzerland, and Luxembourg were part of our analysis. We calculated the number of videos per 100,000 inhabitants, which revealed that all countries were represented equally in relation to their population.
Identifying useful videos is challenging
As the quality of information varies greatly on YouTube [17, 18], identifying high-quality, trustworthy, and sensitive videos on PD among mediocre and misleading content with the YouTube search- and recommendation-algorithm can be challenging. First, our searches overlapped to large proportions. Second, the search produced a high number of irrelevant results: After deleting duplicates, nearly half of the videos were not relevant to the topic or not German. Third, we identified videos in PD Channels which could have met our inclusion criteria but were not returned by the YouTube search algorithm (Table 2, discrepancy between “Videos Analyzed” and “Total Videos”)—making it difficult to find information relevant for PD patients on standard user YouTube searches. Nevertheless, viewers stick to content of a priori trustworthy publishers: Our data showed that physicians, hospitals, and specialist societies had longer videos, more views, and a higher VPI, which is in line with the findings of Tripathi et al. [13]. They analyzed the reliability of YouTube videos about deep brain stimulation and found that longer videos tended to be of higher quality than shorter videos as measured with the DISCERN instrument. In the study of Al-Busaidi et al. [18], who analyzed 100 English videos on PD, different sources (academic videos, news agencies, personal videos) did not differ in views. While Al-Busaidi et al. categorized the source of the video into 3 groups, in this study 12 categories were available. This might have revealed differences to a better extent and might explain these seemingly contrasting results. Finally, the available scales to evaluate and categorize the video material differ in many aspects. An overview is given in Table 3. Some scales were validated (DISCERN [19], PEMAT-A/V [20]), but are relatively complex to use. Less complex scales are 5-point Likert-like scales consisting of 5 statements (e.g., GQS, TCCI) and are used frequently in research about video content [15–17, 21], although no formal validation studies exist. The available video material varies broadly in length, information content, topic, intention and many other aspects. It might be very difficult, if not impossible, to find a validated scale covering all different aspects of such videos fairly with low inter-rater variability. Nevertheless, further studies should be conducted by multiple raters from different professions to quantify the inter-rater variability. Involving patients into the rating process may further enhance the usefulness to other patients.
Scales for video ratings
Channel content
In our study, channels with 10 or more uploaded videos covered issues that were most relevant to PD patients’ daily life. The video quality as assessed by the GQS instrument was highest in this group. This is in line with the findings by Welbourne and Grant [22]. If a channel uploads a higher number of videos, this seemed to indicate a special dedication and expertise to the topic, and the communicator continuity increased the number of video views [22]. Of course, these findings might tempt content creators to upload inferior material to have more videos on their channels to gain a “trustworthy” image and potentially earn more money. Therefore, regular structured searches and updates should be conducted. The “PD Channels” (Table 2) identified can be recommended to information seeking patients and their relatives from a neurologist’s perspective. These channels may serve as an addition to a group of recommendable websites which were reviewed by Schlenstedt et al. [23].
The SARS-CoV-2 pandemic had no effect on the number of uploaded videos
We hypothesized that quality health information is even more important during the pandemic of SARS-CoV-2 [17, 25]. YouTube videos were relevant sources of information during pandemics like Ebola [24] or SARS-CoV-2 [17]. In our analysis, we neither saw a relevant change in uploaded videos related to PD, at least not in our time period of investigation, nor could we detect an increase in search requests. We can only speculate about the reasons for this counterintuitive finding: Patients might watch videos about SARS-CoV-2 pandemic not directly covering PD, which seem to cover their immediate need of information or patients might get sufficient information talking to their doctors or from not-search-engine based media (newspapers, television).
Findings specific to Germany
The present study assessed the YouTube videos available on PD to the German-speaking community that amounts to over 95 million native speakers. Al-Busaidi et al. conducted a study on the English videos on PD [18]. They identified 100 videos which were assessed for video characteristics including total views, duration, ratings, and the source of videos. Furthermore, they classified the videos into 5 usefulness categories [18]. 19% of videos were classified as “somewhat useful” or “very useful”. This corresponds to the percentage of recommendable videos in our study, which accounted for 20% of all videos screened. Compared to their English counterparts, German videos gained less views than those analyzed in [18]. When the views were adjusted to the number of speakers (German or English) and corrected for the years YouTube existed by the time the analyses were done, no fundamental differences could be detected (Supplementary Table 5). We agree with Al-Busaidi et al. that healthcare providers should direct PD patients and their families to the resources that provide reliable and accurate information [18].
Strength and weaknesses
The main strength of the present study is the large number of videos screened. It is the first study to address YouTube videos on PD in German. The cross-sectional scientific analysis of YouTube video content and video metrics (views, likes, dislikes) underlies several limitations [17]. The VPI can only be calculated if the sum of likes and dislikes is not zero. This was not the case in 4 videos in the group “hospitals” and 2 videos in the group “specialist societies”. Furthermore, channels can be set up to not show these numbers publicly, impeding the calculation of the VPI. Longitudinal changes in video metrics and search terms could not be analyzed.
Outlook
The number of patients retrieving health-related information from online videos is ever increasing. At the same time, universal indicators, rules, or algorithms to identify useful content in general will probably not be available in the foreseeable future. As a consequence, health experts should produce high quality content and, equally important, should promote their videos adequately in social media to reach those seeking information. This may also imply a better understanding of the interaction of the user and the search engine that uses a proprietary algorithms. Additionally, annual or biannual structured searches by a multi-professional team consisting of, for example, physicians, therapists, and patients should be conducted to generate and update lists of content that may be recommended to patients.
CONCLUSIONS
The main finding was that the quality was incre-ased in channels with a high number of videos on the topic. Patients should therefore stick to channels that present a high number of videos and have spe-cialized in the field. The recommended channels identified in this study are available here (https://www.neurologie.uni-kiel.de/de/neuromechanik-neurorehabilitation/fuer-patienten/flyer-youtube-parkinson.pdf).
CONFLICT OF INTEREST
The authors have no conflict of interest to report.