
Abstract
Background:
A companion paper (Crowley et al., 2020) reports on the neuroimaging and neuropsychological profiles of statistically determined idiopathic non-dementia Parkinson’s disease (PD).
Objective:
The current investigation sought to further examine subtle behavioral clock drawing differences within the same PD cohort by comparing 1) PD to non-PD peers on digitally acquired clock drawing latency and graphomotor metrics, and 2) PD memory, executive, and cognitively well phenotypes on the same variables.
Methods:
230 matched participants (115 PD, 115 non-PD) completed neuropsychological tests and dCDT. Statistically-derived PD cognitive phenotypes characterized PD participants as PD low executive (PDExe; n = 25), PD low memory (PDMem; n = 34), PD cognitively well (PDWell; n = 56). Using a Bayesian framework and based on apriori hypotheses, we compared groups on: total completion time (TCT), pre-first hand latency (PFHL), post-clock face latency (PCFL), total clock face area (TCFA), and total number of pen strokes.
Results:
Fewer strokes and slower performance to command were associated with higher odds of PD diagnosis, while a larger clock face in the copy condition was associated with lower odds of PD diagnosis. Within PD cognitive phenotypes, slower performance (TCT, PCFL) and smaller clock face to command were associated with higher odds of being PDExe than PDWell, whereas larger clock faces associated with higher odds of being PDMem than PDWell. Longer disease duration, more pen strokes (command) and smaller clocks (command) associated with higher odds of being PDExe than PDWell.
Conclusion:
Digitally-acquired clock drawing profiles differ between PD and non-PD peers, and distinguish PD cognitive phenotypes.
INTRODUCTION
Clock drawing to command and copy conditions is part of the neuropsychological protocol established by the MDS Task Force to monitor individuals with Parkinson’s disease (PD) with mild cognitive impairment [1] or dementia [2]. Research shows that the command clock drawing condition is a highly multidimensional task requiring semantic knowledge, comprehension, visuoattention, and executive control, while the copy condition is sensitive to dominant executive and visuospatial deficits [3], deficits often seen in PD cognitive profiles [4, 5]. Parkinson’s disease dementia (PDD) clock profiles typically include poor command and copy performance, which is attributed to marked executive functioning deficits and associated impairments in frontal systems [3, 6]. Behaviorally, individuals with PD can show planning errors on clock drawing [7]; it is also reported that individuals with PDD take longer total time to complete digital clock drawing relative to non-demented idiopathic PD participants [8]. Such findings correspond to the dominant view that PD involves insidious slowing of processing speed coupled with working memory, inhibition, and planning difficulties [2–4].
Although clock drawing is involved in PD cognitive monitoring and has been studied in older adults with PDD, we know of no research reporting on digitally acquired clock drawing characteristics to command and copy for non-demented individuals with PD. On traditional pen and paper visual scale measurements, non-demented individuals with idiopathic PD perform similarly to cognitively well peers in the command condition [3, 7], with potential minute deficits in the spatial organization of numbers inside the clock face [9, 10]. In idiopathic PD, however, there is known frontal/executive dysfunction attributed to frontostriatal circuitry [11–14]. Research on cognitively well and individuals with mild cognitive impairment suggests processing speed and working memory contribute to the time it takes to draw the face of a clock, with also inhibitory function necessary for planning number placement [11, 15]. Time metrics for clock drawing may therefore be useful to assess clock drawing in PD. Graphomotor elements such as clock face area may also be beneficial; i.e., smaller clock drawings along with micrographia are often observed in individuals with subcortical diseases such as PD [16, 17]. Thus, more fine-grained behavioral measurements of clock drawing production acquired by digital technology assessment may provide insight into cognitive profiles of idiopathic PD.
There is also reason to examine if cognitive profiles within idiopathic PD may differ on clock drawing profiles. Idiopathic PD is increasingly recognized as being heterogeneous in nature [18–21], and studies suggest idiopathic PD can present with executive and/or memory deficits prior to the development of dementia [19, 22]. Hypothetically, individuals with PD with more pronounced executive weaknesses may display more effortful transitions between clock drawing components, thus producing longer latencies resulting in longer total completion time. Given the planning and organizational component involved in clock drawing, smaller clocks may be produced by those with predominant executive weaknesses. As for PD cognitive profiles characterized primarily by memory weaknesses, these individuals may present with relatively intact clock drawings based on relatively spared executive functions [23].
The current investigation has two primary aims: 1) to compare clock drawing features between non-demented individuals with idiopathic PD and a heal-thy control group, and 2) examine clock drawing features across PD cognitive phenotypes via a de-tailed process approach. For aim 1, we used propensity score-matching to alleviate sample selection bias and identity the most compatible participants for comparison with the PD group [24]. For aim 2, methods for identification of cognitive phenotypes in PD include a priori categorization based on cognitive performance weaknesses relative to normative samples, followed by data-driven approaches using cluster analysis to identify PD cognitive phenotypes [22]. All group comparisons were conducted using sophisticated Bayesian analyses to closely link theory to data in a coherent manner and to ensure statistical integrity.
METHODS
Participant data were acquired as part of a retrospective investigation from two separate federally funded investigations of neuroanatomical and cognitive profiles in idiopathic PD. The studies were approved by the University of Florida’s institutional review board (IRB) and written informed consent was obtained from all participants. Both investigations were conducted in accordance with the Declaration of Helsinki. The current study’s participant sample is well characterized from a cognitive, vascular biomarker, and structural neuroimaging standpoint and are reported in companion paper [22].
Inclusion criteria for all participants were as follows: age ≥60, minimum of a 5th-grade reading level, right-handedness, absence of dementia based on scores from two screening measures (Telephone Interview of Cognitive Status; TICS [25]) score > 34, Dementia Rating Scale-2 (DRS-2 [26]) raw score > 130, and English as first language. PD participants were diagnosed by a movement disorder neurologist using the UK Parkinson’s Disease Society Brain Bank Clinical Diagnostic criteria and scores of 1–3 on the Hoehn and Yahr Scale [27]. Exclusion criteria consisted of the presence of atypical Parkinsonism and supranuclear palsy, secondary parkinsonism and parkinsonism due to stroke, history of deep brain stimulation, and major psychiatric disorders. Additional exclusion criteria comprised of neurological signs of upper motor neuron disease, cerebellar dysfunction, significant orthostatic hypertension (for the non-PD peer group only), exposure to toxins or neuroleptics, or encephalitis. Participants with hearing difficulties were excluded due to interference with standardized test administration. Since the original investigation included an MRI component, participants with claustrophobia, non-surgical body metal, and/or a pacemaker device were also excluded. Participants were not excluded from participating if reporting mild depression or anxiety, as many patients with PD report such symptoms.
Control participants were recruited from the UF Age Network Registry, family members of PD participants, community fliers, mail-outs, and free community memory screenings. Study participants were predominantly Caucasian, well educated, and lived in northern Florida.
Neuropsychological protocol
Participants were assessed in a private room, and all PD participants were “on” medication during testing. The comprehensive assessment targeted processing speed, working memory, inhibitory function, language, visuospatial function, declarative memory, reasoning, and fine motor function. Seven neuropsychology outcome variables of interest were a priori selected for cluster analysis: executive function [Wechsler Adult Intelligence Scale-III Digit Symbol (total score) and Letter Number Sequencing (total score); Trail Making Test Part B (total time in seconds); Stroop Color-Word Test (total correct in 45 seconds) and declarative memory [Wechsler Memory Scale-III (WMS-III) Logical Memory Total Recall, Hopkins Verbal Learning Test, Revised (HVLT-R) delay free recall, HVLT-R recognition discriminability]. Measures of reasoning [Wechsler Abbreviated Scale of Intelligence Matrix Reasoning (total score)] and learning/memory (Philadelphia Repeatable Verbal Learning Test; delay score controlling for initial recall) provided external cluster analysis validation. Additional language (Animal Fluency, Boston Naming Test, total scores) and visuospatial function (Judgement of Line Orientation, total correct) measures are reported for comparison. For missing values on the Stroop Color-Word test due to color blindness, regression imputation was used to replace the missing variable. For more detailed information on neuropsychological tests aforementioned, please see [28]. Neuropsychology outcome variables were standardized using published population-based normative references.
Digital clock drawing assessment
The Clock Drawing Test consists of two conditions: command and copy. In the command condition, participants are instructed to ‘draw the face of a clock, put in all the numbers, and set the hands to ten after eleven.’ In the copy condition participants are instructed to ‘copy this picture exactly the way it is drawn here’ while pointing to the model of a clock set to the time noted in the command condition. Both command and copy conditions were considered for the present study.
Clock data were acquired from commercially available digital pen technology (Anoto Inc.), which works as an ordinary ballpoint pen while capturing pen position 75 times per second [29]. In-house Massachusetts Institute of Technology (MIT) software classifies each pen stroke as a component of clock drawing (e.g., clock face, clock hand, digit, etc.) with up to 84% accuracy [29]. All strokes are time-stamped allowing the examiner to run a video recording of the drawing to assist in enhancing classification accuracy. Latencies between each stroke and measurements size can then be extracted and used as variables of interest. The spatial resolution of the software enables the drawing to be enlarged up to 100 times, making phenomena fractions of a millimeter in size visible to raters. Trained raters with high reliability (93–99% accuracy) deconstructed and manually corrected each drawing to ensure appropriate scoring. Test administrators completed individual and group level training to ensure protocol adherence.
Three dCDT latencies and two graphomotor variables of interest were chosen for the current project based on their theoretical relevance in various cognitive PD profiles. Variables of interest included: Total Completion Time (TCT), Post-Clock Face Latency (PCFL), Pre-First Hand Latency (PFHL), Total Clock Face Area (TCFA), and total number of pen strokes used to complete the drawing.
TCT. Total time taken, in seconds, to complete all elements of clock drawing, from the first pen-paper contact until completion of the final pen stroke.
PCFL. The time taken, in seconds, between completion of the final stroke of the clock face (i.e., the circle containing the clock elements) and the subsequent stroke. This period requires shifting mental set from creating the clock face to adding other components of the clock. Therefore, the latency in this period is believed to measure shifting/switching ability, and planning construction of the remaining components. Collectively, these kinds of cognitive processes are described as executive functions.
PFHL. The time taken, in seconds, between completion of the stroke prior to construction of the first hand and the initial stroke of the first hand. At this point in clock construction, examinees typically have already laid out the numbers and/or center dot and begin to draw one of the clock hands to denote the time “ten after eleven.” For rapid and accurate production of this stroke, the participant must comprehend the syntactic proposition “ten after eleven”. Longer time to set this first hand may suggest processing speed difficulties and subtle working memory deficits [15].
TCFA. The area formula, A = πr2, is applied to each examinee’s clock face, where r represents the average of the horizontal and vertical radii of the clock face in millimeters. Prior to construction of the clock face, examinees often describe considering the appropriate size of the clock face given the internal components (i.e., the numbers and hands), suggesting that the size of the clock face may capture aspects of executive functioning such as planning.
Total number of strokes. The total number of pen strokes used to complete the clock drawing from the first pen-paper contact until completion of the final pen stroke.
In addition to scoring clock drawing behavior through digital technology, command and copy clocks were scored using a conventional visual-based, 0 through 3 scoring system as part of the stan-dard administration and scoring of the Montreal Cognitive Assessment (MoCA) [30], a screening tool designed for the rapid assessment of mild cognitive dysfunction and is commonly administered at in-patient units and neurology settings. Within the MoCA, clock drawing is scored from 0 to 3 (3 = best), with 1 point awarded for (1) contour, where the clock face is complete with only minor distortions (e.g., the circle is only slightly elongated or there is a small imperfection in closing the circle); (2) numbers, where all numbers are present in the correct clockwise sequence (e.g., they must be located within their respective quadrants, and no numbers can be repeated, roman numerals are acceptable, and numbers can be located outside of the clock face); and (3) hands, where both must be set to the correct time with the hour hand distinctively smaller than the minute hand, while both join near the center of the clock face. To reduce rater bias [31], the same software [29] provided MoCA clock drawing scores [29].
Defining PD cognitive phenotypes
Details of cluster analysis methods, results, and supplemental tables can be found in a companion paper [22]. Briefly, seven total neuropsychological measures (4 executive function, 3 memory) were selected based on 1) their ability to measure components of executive functioning (i.e., processing speed, working memory, set shifting, inhibition) or learning and memory, 2) evidence of such domains being affected in PD, and 3) their ability to distinguish individuals in the initial dementing process. These seven measures were first included in a principal components analysis to confirm suspected cognitive constructs with a data-driven approach, reduce noise in the executive functioning and memory constructs, and reduce the number of variables for the cluster analysis. A subsequent hierarchical cluster analysis with Ward’s method determined an optimal solution at 3 clusters. A k-means cluster analysis determined these three clusters to be: 1) 25 individuals with lower scores on executive functioning and processing speed tests (Low Executive; PDExe), 2) 34 individuals with low scores on memory tests (Low Memory; PDMem), and 3) 55 individuals with no low scores (Cognitively Well; PDWell).
Statistical methods
Analyses were conducted in the statistical programming language R (version 3.6.3; R Development Core Team, 2016) [32]. In order to compare individuals with and without idiopathic PD, participants were matched according to demographic covariates (age, years of education, sex, race, MMSE, handedness), measures of mood (BDI-II, STAI state and trait), comorbidity (Charlson Comorbidity Index), and premorbid functioning (WRAT or WTAR). We used a nonparametric approach (Chi-square) for between group MoCA score comparisons. For situations in which randomized experiments are impossible or unethical, propensity score matching offers a method to reduce bias on causal effect estimates [33]. Since missing data were extremely low for demographic covariates (< 2%), matching was conducted with the following procedures: 1) for five cases with 2-3 missing variables, data were imputed using random forests in the mice library [34], 2) optimal matching was conducted using the logit function in the Match It library [35], 3) balance was assessed by comparing the standardized difference (i.e., Cohen’s d) across five quantiles of the propensity score [36]. Regions of overlap were acceptable for 4/5 quantiles (< 0.25) and excellent for 2/5 quantiles (< 0.10). One of the five quantiles was borderline (d = 0.29). Matching was attempted using a variety of additional functions to compute the distance measure (e.g., probit, cauchit, and generalized additive models) with minimal worsening in balance. After obtaining matched PD and non-PD groups, we confirmed cognitive phenotypes by repeating the aforementioned cluster analysis. All classifications remained the same.
Inferential analyses were conducted using logistic regression in a Bayesian framework with the rstanarm library [37]. For advantages of a Bayesian approach, including superiority with smaller samples, see [38]. All Bayesian models employed Markov chain Monte Carlo simulation (MCMC) and Cauchy priors [39]. This method produces a distribution of effects, a computed probability distribution from which population values can be estimated. Models were compared with Bayes factors (BFs) derived from leave-one-out cross-validation (LOO) [40]. Bayes factors were interpreted according to Raftery [41]. Bayesian approaches have an important advantage in characterizing incremental evidence for or against a hypothesis, rather than relying on a preset decision rule (i.e., a p-value or confidence interval) [38]. Given the advantages of model-based missing data imputation with MCMC [42], and the extent of missing data for dCDT variables (≤4%), no imputed data were used in the inferential models.
The first aim’s model comparing individuals with and without PD was assessed for parsimony with projection predictive variable selection [see online supplement for description]. We employed this method due to performance advantages over other model selection and shrinkage techniques [43], and the desire to discover features with the most explanatory power to characterize our groups. Model comparison suggested very strong evidence for the superiority of a sparser model (as opposed to models with all features included) with four variables selected from the dCDT: total strokes (command con-dition), total completion time (TCT; command condition), and area (TCFA; command and copy conditions). For analyses comparing cognitive phenotypes within the PD group, we again employed projection predictive variable selection to derive parsimonious models. We included dCDT variables, age, and disease duration in the full models (see Limitations). Model comparisons suggested very strong evidence for the superiority of sparser models (see Results). Therefore, reduced models were interpreted. Evidence for model effects were primarily interpreted according to BFs [44], with secondary importance attributed to credible intervals (CIs). For discussion of the difference between Bayesian CI and frequentist confidence intervals, see [38]. All effects were standardized.
RESULTS
Demographics and clinical factors of PD and non-PD peers in the analytical sample
Demographics
PD and non-PD peers did not differ in age, years of education, number of comorbidities (Charlson Comorbidity Index), handedness score. Groups did not differed in race ratios, but differed in sex ratios such that their were females in the control group than in the PD group (χ2 = 6.89, p = 0.009).
Mood/general cognition
As expected, groups differed in MMSE score (t = 8.18, p < 0.001); non-PD > PD. Groups differed in depressive symptoms (BDI-II); (t = –6.05, p < 0.001; PD > non-PD and on state anxiety (t = –5.06, p < 0.001) and trait anxiety (t = –2.73, p = 0.007); PD > non-PD.
Age positively correlated with command TCT (spearman’s rho = 0.145, p = 0.021), command total strokes (spearman’s rho = 0.14, p = 0.028), copy total strokes (spearman’s rho = 0.17, p = 0.009) and copy PCFL (spearman’s rho = 0.14, p = 0.025). Years of education positively correlates with command TCFA (spearman’s rho = 0.13, p = 0.034). STAI state positively correlated with copy TCT (spearman’s rho = 0.17, p = 0.003) and copy PFHL (spearman’s rho = 0.15, p = 0.017). There were no correlations be-tween BDI-II and clock variables. MMSE negatively correlated with command TCT (spearman’s rho =–0.30, p < 0.001), command PFHL (spearman’s rho = –0.15, p = 0.017), copy TCT (spearman’s rho =–0.18, p = 0.004), copy PFHL (spearman’s rho = 0.19, p = 0.002), and copy TCFA (spearman’s rho = 0.13, p = 0.039). Charlston comorbidity correlated with none of the clock variables.
The original sample included 260 participants (115 PD, 145 non-PD) averaging 68.39±6.07 years of age, and who were highly educated (mean = 16.36 years, SD = 2.58). The majority identified as non-Hispanic White (n = 255, 98.08%). Of the full sample, 230 individuals were matched (Fig. 1) with the final analytical sample including 115 PD and 115 Non-PD. The combined sample was considered cognitively well on a measure of general cognition (MMSE mean = 28.74, SD = 1.16), and had few comorbid medical conditions (Charlson Comorbidity Index, raw score = 0.38, SD = 0.69). The combined sample also reported minimal depression (BDI-II mean = 6.00, SD = 5.76) and anxiety (STAI State mean = 30.15, SD = 9.25; Trait mean = 31.17, SD = 8.48). Table 1 displays demographic variables by group for the matched analytical sample.
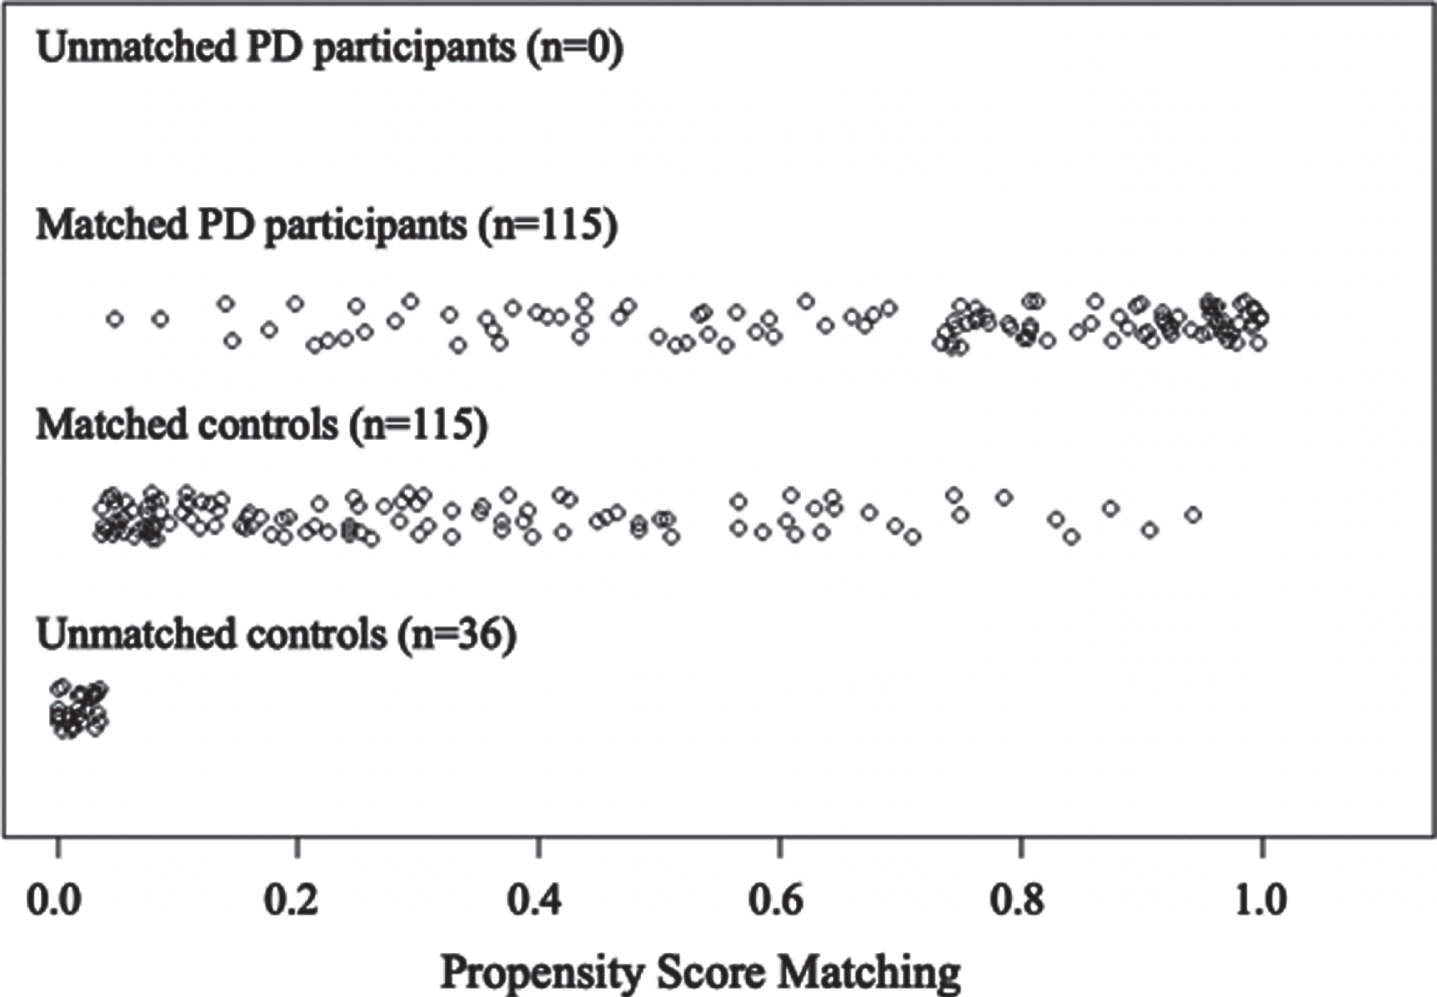
Distribution of propensity scores for matched and un-matched individuals in the PD and non-PD (control) groups.
Demographic characteristics of the matched sample
Displays mean and standard deviation in parentheses, and incidence for categorical variables. WRAT, Wide Range Achievement Test; WTAR, Wechsler Test of Adult Reading; STAI, State-Trait Anxiety Inventory; Handedness, Modification of Annette (1976) inventory with range –24 to 24 (higher positive = right-side dominance). References in manuscript.
dCDT variables distinguishing PD and matched non-pd peers
Table 2 displays descriptive comparisons for matched individuals with and without PD for dCDT variables of interest. The final model included total strokes (command condition), TCT (command condition), and TCFA (command and copy conditions). Supplementary Figure 1 displays results from projection predictive variable selection. All effects were retained, and fit was acceptable with minimal influence from outliers (LOO Pareto k estimates < 0.5). Positive to very strong evidence was found for an effect of total strokes (command condition), TCT (command condition), and TCFA (copy condition). Fewer strokes (βMedian = –0.69, β SD = 0.23, Odds Ratio [OR] = 0.50, 95% CI, BF = 15.91) and slower performance (βMedian = 1.27, β SD = 0.27, OR = 3.56, 95% CI [2.16, 6.30], BF = 394.00) were associated with higher odds of a PD diagnosis. In contrast, a smaller clock face in the copy condition was associated with higher odds of a PD diagnosis (βMedian = –0.57, β SD = 0.18, OR = 0.57, 95% CI [0.38, 0.80], BF = 12.85).
PD (n = 115)and non-PD (n = 115) group comparisons for digital clock drawing test variables of interest
Please see manuscript for descriptions of the variables.
Group MoCA scores
There were no significant between group differences for MoCA clock drawing command or copy accuracy scores (command χ2(3, 230) = 3.23, p =0.357; copy χ2(3, 230) = 5.02, p = 0.170) (Supplementary Table 1).
dCDT variables distinguishing cognitive phenotypes within the Parkinson’s disease group
For the 115 participants with PD, the PCA of the 7 cognitive outcome measures showed 2 factors with eigenvalues greater than 1 (Supplementary Figure 2.1, 2.2, 2.3.). We replicated the cluster analysis with a subsample of individuals with PD who completed dCDT from Crowley and colleagues ([22]; note one participant was missing a clock drawing and was not included in this study). Replication of the analyses show the same findings. Hierarchical cluster analysis showed the greatest reduction in squared Euclidian distance between two and three clusters). K-means cluster analysis with three clusters yielded three PD cognitive phenotype clusters: 1) PDExe (n = 25); 2) PDMem (n = 34), and PDWell (n = 56). Cross-validation agreement with the full PD sample ranged from 86.7% to 96.7%, with an average agreement of 92.3%. Detailed neuropsychological and neuroimaging profile differences are summarized in Crowley and colleagues [22].
Demographics and clinical comparisons of PD phenotypes in the analytical sample (Table 3)
Demographics
Age and sex ratio were not different between groups. All participants were Caucasian. Groups did not differ in years of education.
Demographic characteristics by PD Cognitive Phenotype
WRAT, Wide Range Achievement Test; WTAR, Wechsler Test of Adult Reading; STAI, State-Trait Anxiety Inventory; Handedness, Modification of Annette (1976) inventory with range –24 to 24 (higher positive = right-side dominance). References in manuscript.
Disease and medication
PD phenotypes differed in disease duration (F[2,113] = 3.47, p = 0.034,
Mood/general cognition
Groups differed in MMSE performance (F[2,113] = 5.123, p = 0.007,
PDExe (n = 25) versus PDWell (n = 56)
In order to examine group differences in digital clock drawing behaviors between PD cognitive phenotypes, we first compared the low executive group (PDExe) to the cognitively well group (PDWell). As stated (see Statistical Methods), the projection predictive variable selection method was used to identify the most salient variables (see Supplementary Figure 21.). The interpreted model included TCT (command condition), PCFL (command condition), TCFA (command condition), Total Strokes (copy condition), and PFHL (copy condition). Three of five possible effects were retained, and fit was acceptable with minimal influence from outliers (LOO Pareto k estimates < 0.7). Weak evidence was found for an effect of TCT (command condition) (βMedian = 0.77, β SD = 0.38, OR = 2.17, 95% CI [1.09, 4.90], BF = 1.16), and positive evidence was found for an effect of PCFL (command condition) (βMedian = 1.14, β SD = 0.55, OR = 3.14, 95% CI [1.32, 11.36], BF = 5.78) with slower performance associated with higher odds of being in the low executive group. Positive evidence was also found for TCFA (command condition) with smaller clock faces associated with higher odds of being in the low executive group (β Median = –0.93, β SD = 0.39, OR = 0.40, 95% CI [0.16, 0.80], BF = 3.69).
PDMem (n = 34) versus PDWell (n = 56)
The interpreted model included disease duration, age, total strokes (copy condition), PFHL (copy condition), TCFA (command and copy condition). Supplementary Figure 22. displays results from projection predictive variable selection. One of six possible effects was retained, and fit was acceptable with minimal influence from outliers (LOO Pareto k estimates < 0.5). Weak evidence was found for an effect of TCFA (copy condition), with a larger clock face associated with higher odds of being in the low memory group (βMedian = 0.76, β SD = 0.34, OR = 2.14, 95% CI [1.16, 4.35], BF = 2.13).
PDExe (n = 25) versus PDMem(n = 34)
The sparse model was interpreted, which included disease duration, total strokes (command and copy conditions), PFHL (copy condition) and TCFA (copy conditions). 2 Supplementary Figure 23. displays results from projection predictive variable selection. Three of five possible effects were retained, and fit was acceptable with minimal influence from outliers (LOO Pareto k estimates < 0.7). Positive evidence was found for an effect of total strokes (copy condition), with more pen strokes associated with higher odds of being in the low executive group (βMedian = 1.29, β SD = 0.50, OR = 3.61, 95% CI [1.51, 10.80], BF = 9.96). Positive evidence was also found for an effect of disease duration, with longer disease duration associated with higher odds of being in the low executive group (βMedian = 1.08, β SD = 0.51, OR = 2.94, 95% CI [1.25, 9.39], BF =3.33). Weak evidence was found for an effect of TCFA (copy condition), with smaller TCFA associated with higher odds of being in the low executive group (βMedian = –1.06, β SD = 0.50, OR = 0.35, 95% CI [0.11, 0.85], BF = 2.69). Figure 2 displays dCDT performance for the PD cognitive phenotypes and the non-PD group. See supplementary video example of representative participants from each PD cognitive phenotype group with preserved time and size in command and copy conditions.
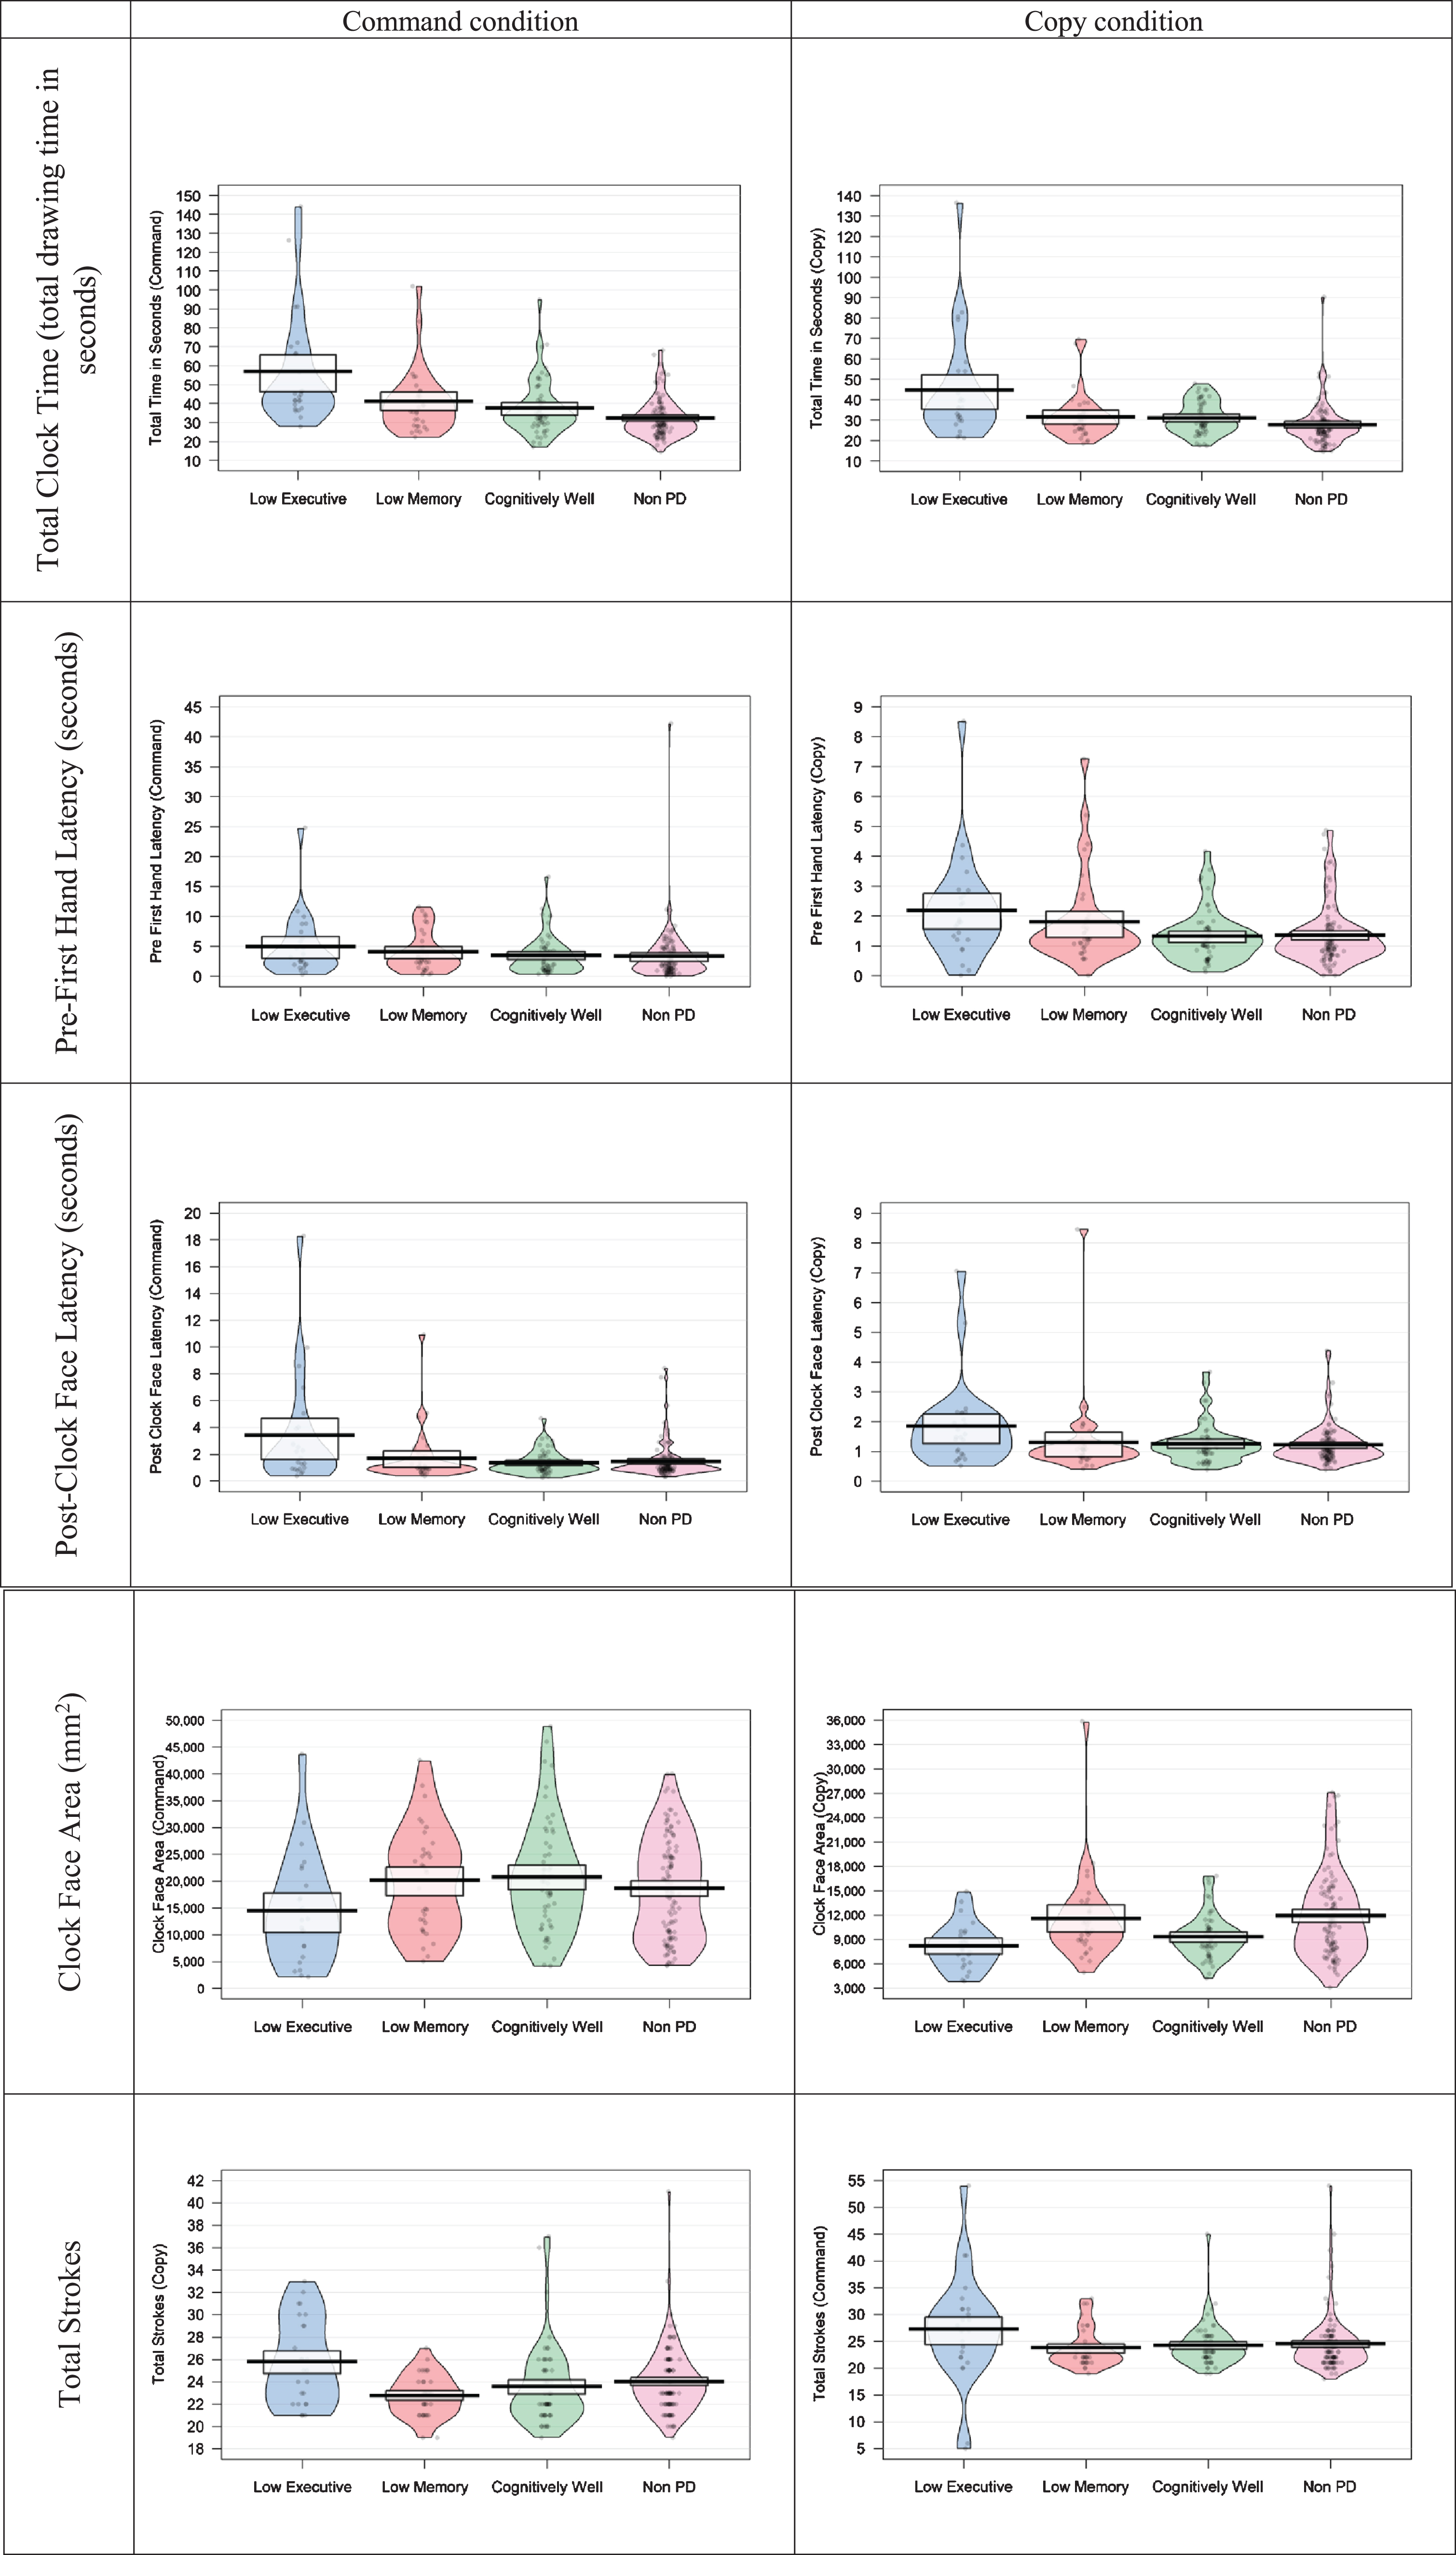
Pirate plots of digital clock drawing test (dCDT) performances for each PD cognitive phenotype (PDExe n = 25; PDMem n = 34; PDWell n = 56) and the control group (non-PD n = 115). Pirate plots include the raw data, mean, a Bayesian highest density interval, and smoothed density curve.
Group MoCA scores
There was no significant between group difference for MoCA clock drawing command or copy accuracy scores (4 group comparison) (command χ2(9, 230) = 13.46, p = 0.143; copy χ2(9, 230) = 11.54, p = 0.240) (Supplementary Table 1).
DISCUSSION
The current investigation sought to examine subtle cognitive differences between individuals with idiopathic non-dementia PD and matched non-PD peers, and to further assess clock drawing command and copy differences between cognitive phenotypes within the PD group. This study employed a sophisticated assessment of digital clock drawing, which enabled capture of various drawing latencies and graphomotor behaviors. These findings complement prior research describing the involvement and integration of several cognitive abilities for successful completion of the dCDT [15]. Despite no general difference on a traditional clock drawing scoring approach, we identified specific digital clock drawing behaviors distinguishing PD and non-PD groups with evidence for positive to very strong effects (ORs ranging from 0.34 to 0.57 and from 2.14 to 3.56). Non-demented individuals with PD took, on average, 10.45 seconds longer to complete the drawing to command. These findings are consistent with prior research demonstrating cognitive and motor slowing in PD [45–47]. Although currently unexamined, subtle performance differences could relate to differences in approach to clock construction and the pathological processes of PD progression. Since fronto-subcortical pathways known to be altered in PD are important for cognitive and motor abilities [48, 49], neuroanatomical changes as a result of PD pathology may impact cognitive performance through task approach.
Furthermore, we found effects between the PD cognitive phenotypes on digitally acquired clock drawing metrics to command and copy. Specifically, individuals with idiopathic PD who showed lower mental flexibility and processing speed skills (PDExe) diverged from those with PD who have other cognitive profiles, such as lower memory functioning or no cognitive weaknesses. The PDExe group took the longest to complete the drawing to command, taking at least 15.8 seconds longer on average than both PDMem and PDWell. The PDExe group also displayed the longest latencies (i.e., PCFL and PFHL) and was most variable in the upper quantiles of latency, suggesting likely deficits in processing speed, among other cognitive operations [15]. Prefrontal white matter integrity is considered a foundational component of processing speed and working memory abilities in PD [50]. A companion paper [22] summarizing the neuropsychology and structural neuroimaging differences of PD cognitive phenotypes reports individuals in the PDExe group had less overall subcortical gray than non-PD peers, the lowest putamen, thalamus, and white matter volumes, and reduced white matter connectivity beween the dorsolateral prefrontal cortices to the caudate nuclei. This pattern was present without significant group differences in vascular disease risk markers, dopaminergic medication or anticholinergic medication dosages. These findings, combined with the cortical gray matter volume differences, suggests that PDExe participants may have unique subcortical gray and white matter profiles differentiating them from their PDMem and PDWell peers. Thus, the current study’s digital clock drawing findings suggest slower dCDT TCT could theoretically be an indicator of emergent degradation of white matter integrity, however this needs to be further studied. Digitally-acquired TCT, in PD populations, may provide a quick and efficient indication of white matter integrity as related to frontal systems operations.
PD cognitive phenotypes also showed differences in the graphomotor aspects of clock drawing in command and copy conditions. Individuals with PD and memory weaknesses (PDMem) performed more similarly to the PDWell group than the PDExe group with regards to graphomotor aspects. In the command condition, the PDMem group drew clocks of similar size as the PDWell, but larger than the PDExe group. In the copy condition, PDMem drew the largest clocks (i.e., on average 2,250.55 mm2 or 24% larger). The PDExe group, however, drew the smallest clocks in both conditions (i.e., on average 5,692 mm2 or 39% smaller on command, and 1,147.6 mm2 or 14% smaller on copy). These smaller clock faces, on both command and copy conditions, may be due to the micro-graphia often seen in disorders involving the basal ganglia, such as in PD [17], supporting the idea that smaller clock faces could signify compromised frontostriatal circuitry underlying executive functioning deficits, as well as visuoattention and visuoconstruction deficits associated with PD and seen in PDexec participants [22]. PDexec participants have been shown to Researchers report observing similar inability to improve performance from command to copy among individuals with other forms of subcortical compromise such as small vessel vascular dementia [6, 51]. Command to copy patterns in PDExe appears consistent with literature showing that compromised executive functioning underlying their spatial and constructional deficits [4, 10].
This project has several strengths including the enrollment of a large cohort of non-demented individuals with PD whose cognitive abilities were examined through a rigorous neuropsychology and neuroimaging protocol [22]. While studies have primarily categorized individuals with PD using clinical variables, this study is the first to compare command and copy dCDT variables between data-driven cognitive phenotypes in PD. In addition, our statistical methodology allows for a robust assessment of generalizability and parsimony within the model (i.e., through MCMC, cross-validation, and projection predictive variable selection). Our matching protocol was employed to reduce bias from nuisance covariates in the selection of individuals in the PD and non-PD groups.
We do recognize study limitations. This study was restricted to measurements of cognitive performance during an initial baseline assessment. Longitudinal assessment could examine relationships between cognitive trajectories and measures of dCDT performance. Future investigations should also examine the neurobiological underpinnings of clock drawing, using neuroimaging techniques to interrogate differences in cognition across groups as measured by dCDT performance. It may also be of interest to investigate whether individuals with PD take longer to transition from one aspect of clock drawing to another, and whether those latencies are due to decision making abilities versus motor output. Prior studies suggest that drawing time (i.e., “ink time”) and transition latencies (i.e., “think time”) are important features when evaluating dCDT performance in clinical populations, such as those with depression [52]. Similar ink and think time evaluations, applied to a PD population, could explain the nature of motor and cognitive slowing which may be implicated in clock drawing. Additionally, in order to examine PD cognitive phenotype and digital clock variables, we included age and disease duration in the full models rather than recomputing a phenotype propensity score weighting, as this would have reduced the sample size. We also limited the covariates included in the model, for placing all covariates in the full model would risk possible distortion of theorized effects [53]. Our research findings should be examined in more ethno-racially diverse cohorts and with other digital clock drawing platforms (such as tablet based administration) to ensure scientific findings are not limited to specific digital pen technologies. We also did not examine how cognitive phenotypes may differ relative to motor severity of tremor or gait disturbance, and we additionally examined performance while “on medication”. Both of these elements may contribute to different clock drawing profiles. Relatedly, motor profiles may differ relative eto pen pressure and velocity—two variables we did not examine in this project. Finally, our sample is fully Caucasian and has limited ethnoracial diversity as well as educational range. It is essential future studies address diversity considerations in PD, as well as differences in clock drawing characterisics relative to education.
Despite the limitations, we propose the study’s digital and objective quantification of clock drawing in command and copy conditions provide clinically useful information for understanding PD cognitive characteristics. The subtle cognitive changes recor-ded through digital technologies may assist in early disease identification, and help monitor cognitive changes with disease progression. Future research needs to report on how these participant cohorts change longitudinally, if these profiles remain in larger and more diverse patient samples, address how PD cognitive profiles may interact with motor profiles, and how clock drawing profiles may differentially present in on versus off medication states.
CONFLICT OF INTEREST
The authors have no conflict of interest to report.
Footnotes
ACKNOWLEDGMENTS
We wish to sincerely thank all the participants who provided time and effort towards this research study. Without them, this study and research would certainly not have been possible. Also thank you to the research coordinators Donna Weber and Kristy Ayers for their valuable time in study coordination and assistance. Additional thanks to Michael Okun, M.D., UF, for his study encouragement. We also sincerely thank Debbie Erney for her essential media mastery skills creating the ![]() .
.
This work is supported by R01 NS082386, K23 NS060660, NIA R01 AG055337, NSF 13-543, and R01 NR014810.