
Abstract
Background/Objective:
Idiopathic REM sleep behavior disorder (iRBD) often precedes Parkinson’s disease (PD) and other alpha-synucleinopathies. The aim of the study is to investigate brain glucose metabolism of patients with RBD and PD by means of a multidimensional scaling approach, using18F-FDG-PET as a biomarker of synaptic function.
Methods:
Thirty-six iRBD patients (64.1±6.5 y, 32 M), 72 PD patients, and 79 controls (65.6±9.4 y, 53 M) underwent brain 18F-FDG-PET. PD patients were divided according to the absence (PD, 32 subjects; 68.4±8.5 y, 15 M) or presence (PDRBD, 40 subjects; 71.8±6.6 y, 29 M) of RBD. 18F-FDG-PET scans were used to independently discriminate subjects belonging to four categories: controls (RBD no, PD no), iRBD (RBD yes, PD no), PD (RBD no, PD yes) and PDRBD (RBD yes, PD yes).
Results:
The discriminant analysis was moderately accurate in identifying the correct category. This is because the model mostly confounds iRBD and PD, thus the intermediate classes. Indeed, iRBD, PD and PDRBD were progressively located at increasing distance from controls and are ordered along a single dimension (principal coordinate analysis) indicating the presence of a single flux of variation encompassing both RBD and PD conditions.
Conclusion:
Data-driven approach to brain 18F-FDG-PET showed only moderate discrimination between iRBD and PD patients, highlighting brain glucose metabolism heterogeneity among such patients. iRBD should be considered as a marker of an ongoing condition that may be picked-up in different stages across patients and thus express different brain imaging features and likely different clinical trajectories.
INTRODUCTION
REM sleep behavior disorder (RBD) is a parasomnia characterized by complex and often violent behaviors occurring during REM sleep [1]. Idiopathic RBD (iRBD) is recognized as a strong risk factor for Parkinson’s disease (PD) [2]. Moreover, about 40% among PD patients exhibit RBD [3]. However, RBD may also appear after the onset of motor symptoms in PD, or never at all [4, 5], even if the prevalence of PD patients developing RBD after the emergence of overt PD is unknown.
Some clinical signs and neuroimaging features of neurodegeneration can be found in iRBD patients, in absence of parkinsonism and/or dementia [1]. These findings strongly support the hypothesis that iRBD patients could be in a prodromal phase of an alpha-synucleinopathy. Indeed, the adequacy of the term idiopathic for a subject with isolated RBD has been questioned [6]. However, iRBD is a heterogeneous condition with about 25% of patients converting to a synucleinopathy within 3 years and a minority, but not negligible, percentage of patients remaining idiopathic after more than ten years [7], despite the presence of neurodegeneration at biomarker assessment.
Also, PD is heterogeneous, with different clinical and possibly neuroimaging phenotypes. PD patients with various non-motor symptoms, including RBD, and other altered biomarkers, including EEG and dopaminergic SPECT imaging, carry a poorer prognosis in comparison with mainly motor PD patients [8, 9]. Moreover, PD patients with RBD showed marked posterior cortical hypometabolism compared with PD patients without RBD [10].
At a group level, PD patients express a typical brain glucose metabolism pattern (PDRP) characterized by relative hypometabolism in the lateral premotor and posterior parietal cortical regions associated with relatively increased pallido-thalamic, pontine and cerebellar metabolism [11]. This pattern has been consistently identified in several independent PD cohorts using spatial covariance analysis [12, 13]. The PDRP is significantly expressed in iRBD patients as compared to controls [14–16] and is associated with conversion to Lewy body diseases (LBD) [15]. Moreover, a specific RBD related pattern (RBDRP), partially overlapping the PDRP, has been reported [16]. Therefore, investigating the specific patterns of glucose metabolic alterations in iRBD or in PD patients, either with or without RBD, is regarded as a meaningful approach to detect brain dysfunction.
We have recently identified a specific RBDRP pattern and compared it with the known PDRP [17], finding the former significantly expressed in PD patients, in particular in those with Mild Cognitive Impairment (MCI). Moreover, subjects scores on RBDRP were highly correlated to subjects scores on PDRP [17]. Finally, RBDRP was equally expressed in PD patients with and without RBD [17], thus suggesting that it may represent an ‘early-stage’ PD pattern. However, not all iRBD patients eventually develop PD and not all PD patients ever exhibit RBD, thus increasing the level of complexity.
Indeed, although studying heterogeneous conditions, such as iRBD and PD by means of disease-specific related patterns, may be useful to provide data representative of the core neuroimaging features of the diseases, a meaningful part of patients may not be represented by such rigid classifications.
We faced the problem of describing brain 18F-FDG-PET patterns of patients with RBD and PD by a classical strategy widely used in ecological studies [18]. The rationale of the method is: if the mutual distances among the profiles (initially expressed in a high dimension space spanned by the principal components of the VOI’s values) can be collapsed into a dominant single dimension explaining the major part of between-class variability, then we can safely affirm that a single linear (i.e. one dimensional) order get rids of the among pathology classes differences so corroborating the existence of a single flux of variation encompassing both RBD and PD conditions. This resembles the existence of a single physical driving force (e.g. temperature and altitude) ordering multidimensional ecological profiles (e.g. different areas characterized by a vector of different species abundance) along a linear order or ‘cline’ [18] that, in our case, corresponds to a shared ‘pathology’ driver.
To this aim: i) we applied for the first time a typical ecological approach used to detect environmental clines demonstrating the existence of a single dimension linear ordering: subjects without RBD nor PD (controls), subjects with RBD but no PD (iRBD), subjects with PD but no RBD (PD) and subjects with PD and RBD (PDRBD); ii) we checked the relative between-group separability by linear discriminant analysis.
In addition, the need of taking into consideration patients recruited in different centers prompted us to develop a data normalization process that could be of use for multicenter neuroimaging studies.
We supplemented a classical z-score based normalization procedure (based on different healthy reference samples for the two centers so to eliminate any systematic center bias) with a check for the invariance of correlation structure that could be affected by a ‘range restriction effect’ [19] due to the drastic change in variance coming from standardization. The change in correlation structure can provoke huge biases in neuroimaging studies based on dimension reduction techniques relying upon among ROI’s correlation and, to our knowledge, was never applied in neuroimaging studies.
MATERIALS AND METHODS
Subjects
The study cohort consisted of 187 subjects, recruited in seven centers located in Germany, Netherlands and Italy, subdivided into four groups (see Table 1 for demographic data).
Education is total years of education; iRBD, idiopathic REM sleep behavior disorder patients; M, male; MCI, mild cognitive impairment; MMSE, Mini-Mental State Examination; PD, Parkinson’s disease patients without RBD; PDRBD, Parkinson’s disease patients with RBD; UPDRS-III, Unified Parkinson Disease Rating Scale motor section
a)In 18 controls, the educational level was unknown; in 61 controls the UPDRS-III score was unknown, but lower than three in all the remaining cases. b)In iRBD patients, the educational level and the presence/absence of MCI were unknown. c)In eight PD patients, the MMSE score was unknown; in ten PD patients, the UPDRS-III score and the presence/absence of MCI was unknown. d)In five PDRBD patients, the MMSE score was unknown; in eight PDRBD patients, the UPDRS-III score and the presence/absence of MCI was unknown.
This cohort also included 21 iRBD patients and 38 de novo, drug naïve PD patients from a previous study [17]. The opportunity to recruit subjects from independent centers allowed investigating the issue of data harmonization that is a crucial step for using neuroimage studies in the realm of multicenter trials.
Seventy-nine healthy controls, 36 iRBD and 72 PD patients were prospectively enrolled from the recruiting centers. Diagnosis of RBD and PD followed international standard criteria [20, 21]. The reason for adopting the 1999 PD criteria is because a substantial part of PD patients was diagnoses before the publication of updated criteria. Brain MRI/CT excluded other brain diseases. In PD patients, the Mayo sleep questionnaire [22] and a semi-structured clinical interview by a sleep medicine expert were used to investigate the presence of RBD. In 17 PD patients with RBD and 10 PD patients without RBD, the presence/absence of RBD diagnosis was further confirmed by polysomnography (PSG). In all iRBD patients, the diagnosis was PSG-confirmed.
The Mini-Mental State Examination (MMSE) was used as a measure of global cognition and a comprehensive neuropsychological battery has been performed, including: (i) categorical and phonological verbal fluency to asses language; (ii) Trailmaking test (TMT) A, Stroop color-word test and digit span (forward) to asses attention and working memory; (iii) TMT B, Stroop color test and symbol-digit for executive functions; (iv) figure copying of the mental deterioration battery (simple copy and copy with guiding landmarks) and Clock Completion test to assess visuospatial abilities; (v) Rey Auditory Verbal Memory Test (immediate and delayed recall) and Corsi’s block design to investigate memory. The presence/absence of mild cognitive impairment (MCI) was investigated according to international criteria, by level 2 assessment (at least two tests 1.5 SDs below norms) [23]. The Unified Parkinson Disease Rating Scale, motor section was used to assess motor impairment.
The control subjects were healthy volunteers carefully checked by clinical examinations, general medical history and were free of any neurological symptom. Only subjects with a normal MMSE (above 24) and/or MOCA (above 26) score and with a CDR of 0 were considered. They were chosen based on balanced age, gender and educational level distribution as the patients. They underwent brain18F-FDG-PET and MRI and/or TC scanning and were administered an extended neuropsychological testing to exclude the presence of cognitive impairment.
The study protocol met the approval of the local Ethics Committees, and all participants signed an informed consent form in compliance with the Helsinki Declaration of 1975.
Data acquisition and preprocessing
Forty-four healthy controls, 6 iRBD and 54 PD patients underwent brain 18F-FDG-PET in Genoa. PET Images were acquired by a SIEMENS Biograph 16 PET/CT. Scan acquisition lasted 15 minutes in 3-D mode. Images were reconstructed through a 3D ordered subset-expectation maximization (OSEM) algorithm, 16 subsets and 6 iterations, with a reconstructed voxel size of 1.33×1.33×2.00 mm, and smoothed with a Gaussian 8 mm full-width at half-maximum filter. Attenuation correction was based on CT scan.
Thirty-five healthy controls, 30 iRBD and 18 PD patients, recruited in Germany and in the Netherlands, underwent brain 18F-FDG-PET in Groningen. PET images were acquired by a Siemens Biograph mCT-64 PET/CT camera. Scan acquisition lasted 5 minutes in 3-D mode. Images were reconstructed with OSEM3D (point spread function and time-of-flight modeling), 21 subsets and 3 iterations, with a reconstructed voxel size of 3×3×2 mm, including point-spread function and time-of-flight modeling, and smoothed with a Gaussian 8 mm full-width at half-maximum filter. Attenuation correction was based on CT scan.
Dicom files were exported and converted into Analyze files. Subsequently, FDG-PET images were submitted to the pre-processing steps included in the Statistical Parametric Mapping (SPM8) stand-alone version for spatial normalization into the MNI space (Wellcome Department of Cognitive Neurology, London, UK). The spatially normalized set of images was then smoothed with a 10 mm isotropic Gaussian filter and all the default choices of SPM8 were followed, except spatial normalization, for which a customized brain 18F-FDG-PET template optimized for dementia patients was chosen [24].
Region of interest identification
FDG uptake values were computed in 45 anatomical volumes of interest (VOIs) in each hemisphere, as defined by the Automated Anatomic Atlas, and analyzed by an in-house created Matlab-based script automatically processing mean FDG uptake intensity from each of the VOIs, bilaterally [25]. In order to decrease the number of variables for statistical analysis, the number of VOIs was further reduced by merging regions with similar anatomo-functional characteristics into meta-VOIs, thirteen in each hemisphere: 1. Occipital Cortex (Calcarine/Lingual/ Inferior Occipital/Middle Occipital/Superior Occipital Gyri); 2. Putamen/Pallidum/Caudate; 3. Parahippocampal gyrus/Amygdala/ Hippocampus/Insula; 4. Orbito-frontal Cortex (Inferior Frontal/Medial Frontal/Middle Frontal Gyri); 5. Frontal Cortex (Middle Frontal/Superior Frontal/Superior-Medial Frontal/Superior-Orbital Frontal/Inferior Frontal Gyri); 6. Cuneus/Fusiform Gyrus/Precuneus; 7. Postcentral Gyrus/Precentral Gyrus/Supplementary Motor Area; 8. Parietal Lobe (Inferior Parietal/Superior Parietal Gyri); 9. Anterior Cingulate Gyrus, 10; Posterior Cingulate Gyrus; 11. Temporal Lobe (Inferior Temporal/ Middle Temporal/Superior Temporal Gyri); 12. Temporal Pole (Middle Temporal Pole/Superior Temporal Pole Gyri); 13. Thalamus.
Strategy of analysis: Elimination of systematic bias (Center effect)
Preliminary analyses (data not shown) demonstrated the presence of a strong ‘center effect’ causing a systematic bias whose nature, probably related to general measurement conditions (e.g. scanners and data acquisition protocol), is difficult to ascertain. In order to overcome this problem, a standardization procedure focused on the control groups of both centers was performed. The raw data were transformed into z-scores by the action of the mean and standard deviation relative to the controls of the center in which FDG-PET was performed. Thus, the standardization procedure does not generate two zero mean/unit standard deviation distribution for all the samples of Genoa and Groningen respectively but only for the two control subsets. Hence, the other groups are normalized with respect to their own controls. If the same systematic bias is present in both control and pathological classes, the adopted choice keeps intact the correlation structure of the dataset (that could be modified by the change of scale for eventual range restriction effects [26]), thus allowing the merging of the two Genoa and Groningen datasets. To check the tenability of this hypothesis, we performed two separate principal component analyses for the raw and normalized datasets demonstrating their complete superposition in terms of eigenvector distribution (Fig. 1).
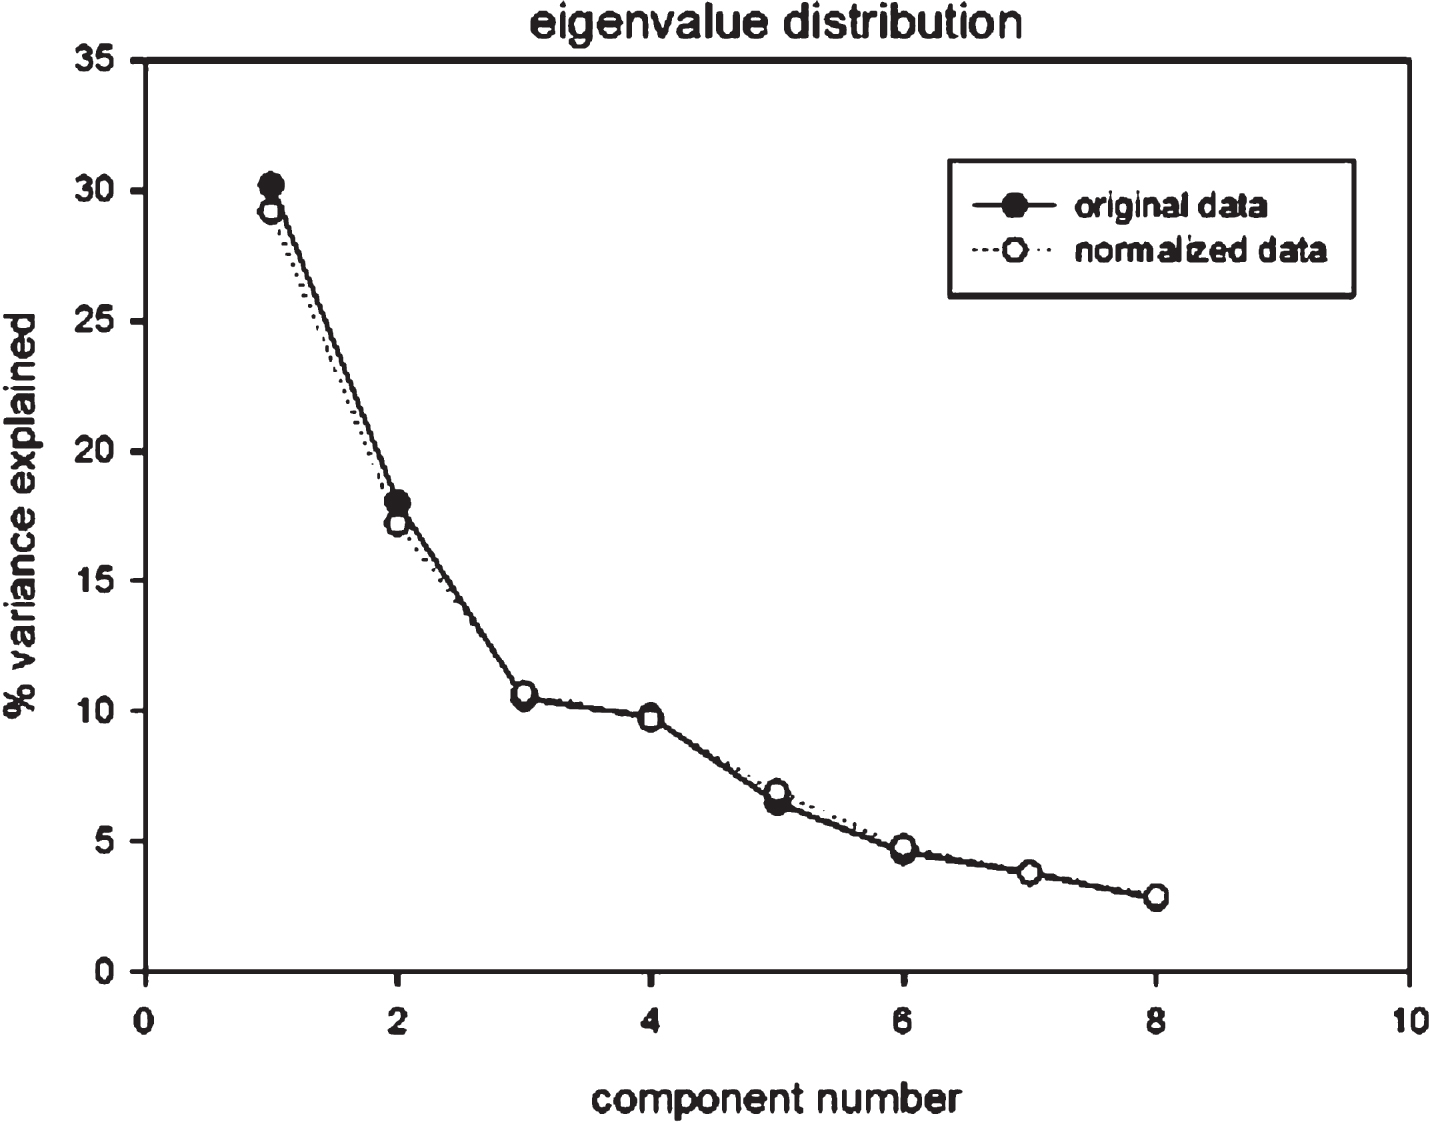
Eigenvalue distribution of both original and normalized data showing the complete superposition between the two sets. Moreover, the corresponding component scores were highly correlated (correlation coefficients around r = 0.85) and no significant ‘location effect’ was put in evidence.
Checking brain glucose metabolism differences between groups
The normalized whole dataset was submitted to a principal component analysis (PCA), giving rise to an eight-component solution explaining 85% of variance. The eight-factor space was the basis for the generation of two-class linear discriminant analysis independently evaluating the discrimination power as for PD and RBD classes with respect to controls. The two PD and RBD binary categories were in turn combined so as to generate a four-category classification correspondent to: controls (RBD no, PD no), iRBD (RBD yes, PD no), PD (RBD no, PD yes) and PDRBD (RBD yes, PD yes). Discriminant analysis was performed by SPSS (version 23) and general linear model analysis. The presence of a single flux of variation encompassing both RBD and PD conditions was tested by means of a multidimensional scaling approach [27] (Principal Coordinate Analysis, PCoA), as applied to the between classes centroids Euclidean Distances.
RESULTS
Table 2 reports the loading pattern (corresponding to the correlation coefficients between meta-VOIs and factors) for the eight components explaining the most of the variance for the normalized data set, before the noise floor starts.
Legend: L, Left, R, Right; the other abbreviations refer to regions as listed in the methods.
As expected, while major components showed marked leading areas (bolded) allowing for a physiological interpretation, minor components are more diffuse and are likely to be more noise contaminated. In any case we selected the 8 components solution to be submitted to discriminant analysis, separately accomplished for RBD and PD conditions. Figure 2 shows the topography of the meta-VOIs set included in the Factor1, which explained the highest percentage of the variance.
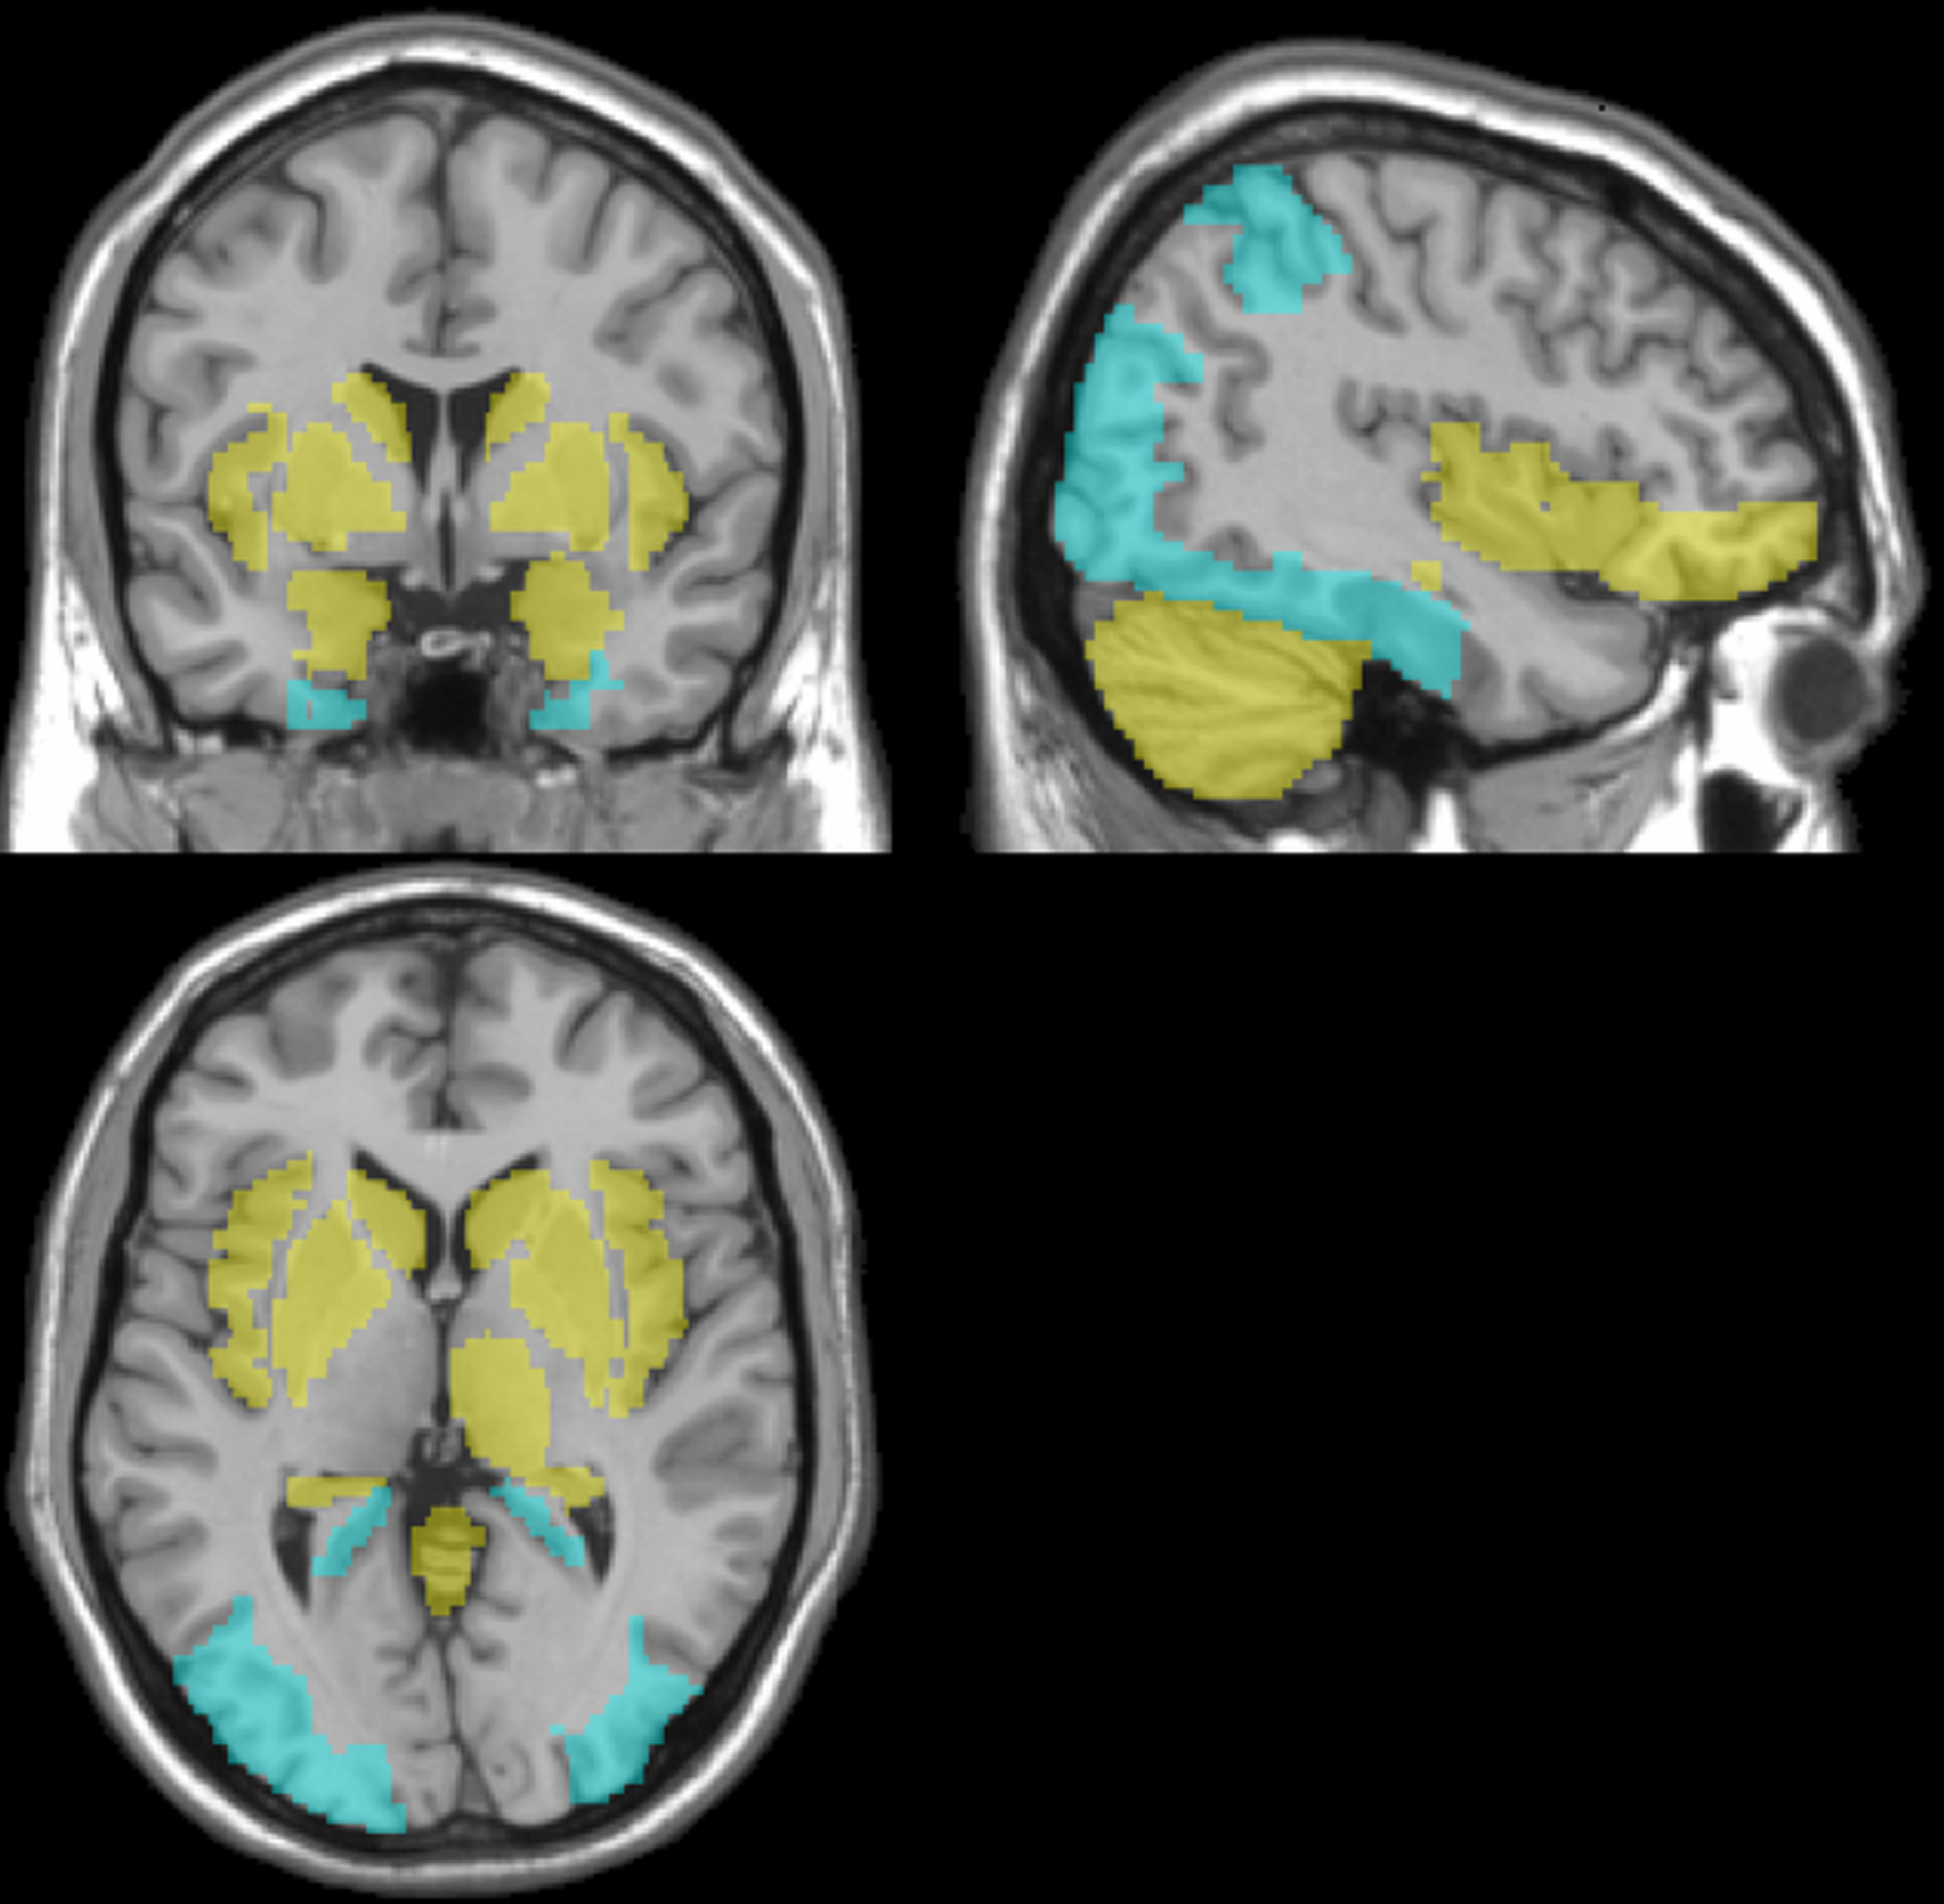
Topographic representation of the meta-VOIs set in the principal component (Factor1), superimposed to the Montreal Neurological Institute template in the coronal (top-left), sagittal (top-right) views and transversal (bottom-left). In yellow, the meta-VOIs set with positive correlation coefficients are shown. In blue, the meta-VOIs set with negative correlation coefficients are shown.
For both RBD and PD, the most discriminant factors were Factor1 and Factor4. In addition, PD discrimination function involved also Factor2, Factor5 and Factor7 pointing to a more ‘generalized effect’ of PD on brain metabolism with respect to RBD. The discriminant analysis showed 62% sensitivity and 76% specificity for RBD; 72% sensitivity and 88% specificity for PD (Tables 3 and 4).
RBD discriminant analysis. Most ‘false’ positive RBD (66.7%) were PD patients without RBD; most ‘false’ negative RBD (72.3%) were iRBD patients
PD (dist PD) points in the direction of PDRBD pole (cosine = 0.88 with PCo1) while iRBD condition (dist RBD) points toward control (cosine = –0.75 with PCo1). The PCo1 main axis explains the 81.5% of total information, suggesting the presence of a single flux of variation encompassing both RBD and PD conditions from controls to PDRBD condition with a marked difference between controls/iRBD vs. PD/PDRBD couples.
PD discriminant analysis. Most ‘false’ positive PD (62.5%) were iRBD patients; most ‘false’ negative PD (63.6%) were PD patients without RBD
Although the sharper ‘control/disease’ separation in PD with respect to RBD might already be considered as an indirect proof of a shared pathology encompassing both RBD and PD conditions, we looked for a more cogent demonstration. This was given by the analysis of the ‘complex class’ (four categories generated by the combination of PD/RBD binary categorizations) distribution.
This task was based on the classification of patients in a combined classification made-up of the four categories: Controls: PD = 0 and RBD = 0; iRBD: PD = 0 and RBD = 1; PD: PD = 1 and RBD = 0; PDRBD: PD = 1 and RBD = 1.
A multidimensional scaling approach as applied to the between classes centroids Euclidean Distances generated a main (First principal coordinate, PCo1) linear ordering explaining 81% of variance, going from controls to PDRBD and having a ‘control pole’ (controls/iRBD) and a ‘disease pole’ (PD/PDRBD) at the extremes (Fig. 3).
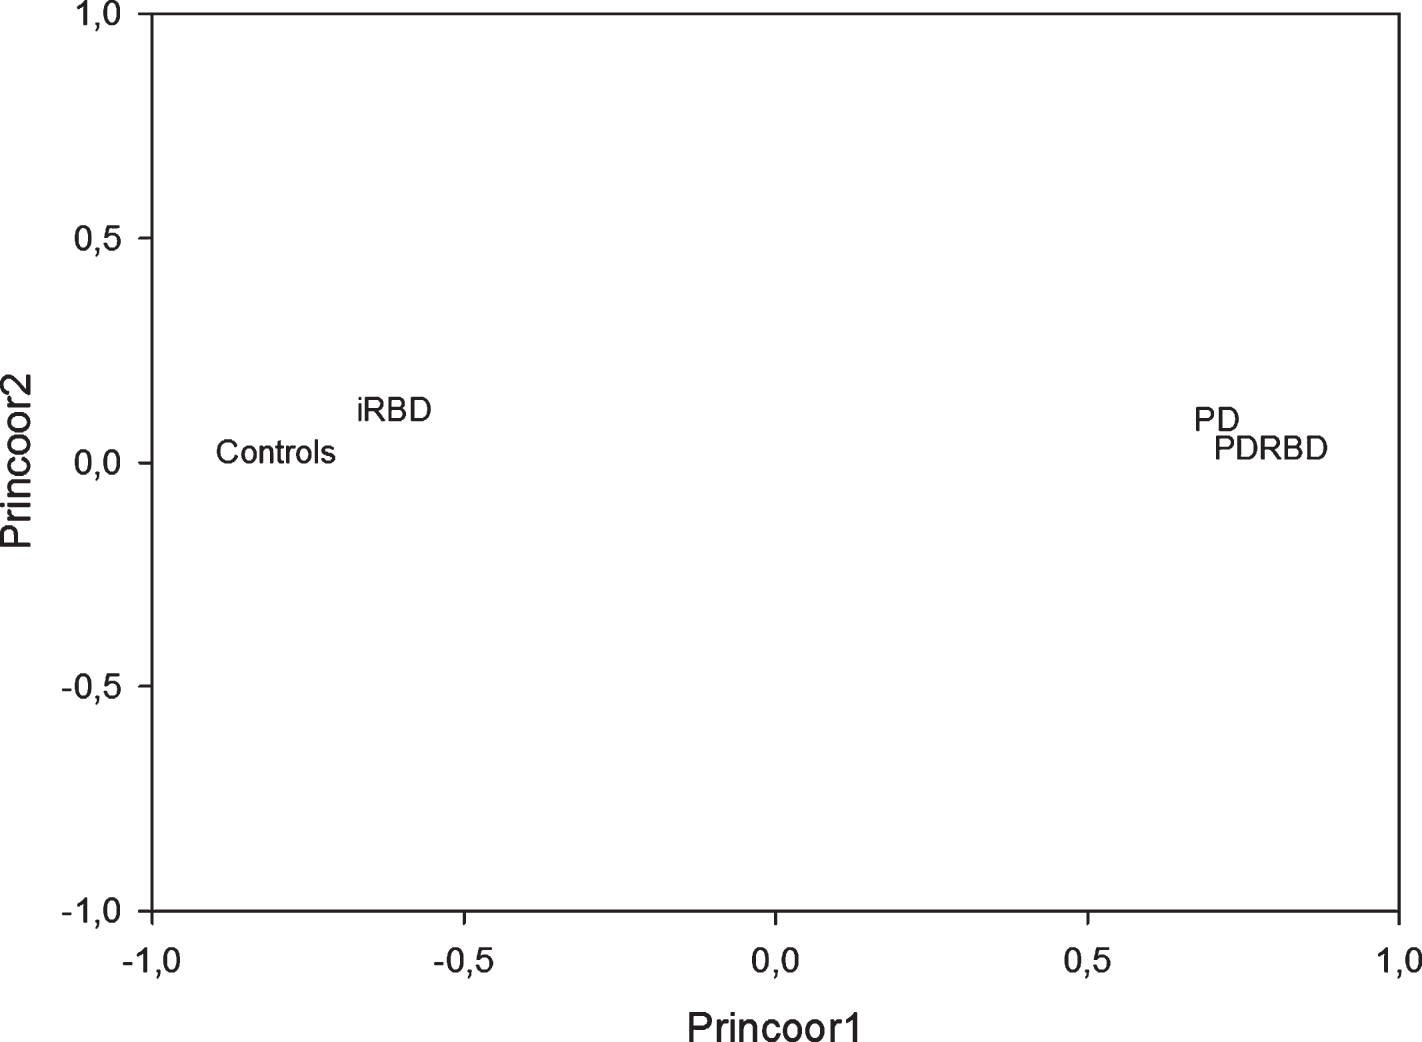
The geometrical disposition of the groups in the principal coordinate space.
This metrics results from the quadratic distances (Table 5) between groups computed on the 8-factor space (see Table 2) in which each group is defined by the profile of the group averages relative to the factors.
iRBD, idiopathic REM sleep behavior disorder; PD, Parkinson’s disease.
It is evident how iRBD, PD and PDRBD are progressively located at increasing distance (0.79, 2.17, 3.74) from controls. In order to have a clear image of a main linear order parameter (i.e. of the disposition of the classes mainly along a single axis), we applied a principal coordinate analysis to the above distance matrix, obtaining the results reported in (Tables 6 and 7).
Director Cosines (mutual orientation of axes with respect to poles)
The mutual distances among classes, computed on the 8 component vectors correspondent to the relative group averages on the 8 factors (see Table 2), are fully explained (99.18%) by two dimensions (principal coordinates) with first coordinate explaining 81.5% of total variance. The Table reports the Eigenvalues (variance relative to each coordinate), Differences in variance between subsequent coordinates and the Proportion of variance explained by each coordinate.
Principal coordinate analysis is analogue to PCA but instead of applying on unit/variable matrices is computed over distance matrices. This implies that variables correspond to the distance from the different categories while loadings are the cosines of the extracted axes (PCo1, PCo2) with respect to the position in the space of the classes. Thus, we obtained (Table 6) a single dimension ordering axis (Principal Coordinate 1) going from PDRBD pole (cosine = 0.97) to Controls pole (cosine = –0.98). The cosine corresponds to the loading of classical PCA: the opposite sign and the close-to-unit module of cosine implies that controls/iRBD and PD/PDRBD poles are along the same line.
The variance escaping single dimension ordering (accounting for 17% of variance, PCo2) is mainly driven by the ‘peculiar eccentricity’ of iRBD (Table 6; Fig. 3). This eccentricity accounts for the singular (not PD related) properties of iRBD. The geometrical representation of the groups in the principal coordinate space immediately clarifies the situation.
DISCUSSION
Our data-driven approach on brain FDG-PET data has shown that iRBD, PD without or with RBD are located at increasing distances from healthy subjects. Moreover, principal coordinate analysis has shown a single dimension ordering going from controls/iRBD to PD/PDRBD pole, explaining 81.5% of total information. Along this axis, PD points more toward PDRBD while iRBD toward controls. This result strongly corroborates the hypothesis of a shared brain pathology encompassing both RBD and PD conditions.
Several studies have postulated that iRBD patients might represent a prodromal LBD stage. Indeed, more than 80% iRBD patients develop a synucleinopathy after 14 years from diagnosis [7]. Moreover, several neurodegeneration findings can be detected in the so-called ‘idiopathic’ RBD patients, including the presence of cognitive impairment [6, 28], hyposmia [29], altered color vision [29] and autonomic dysfunction [29].
Clinical signs of neurodegeneration are combined with both structural and functional neuroimaging changes, other than brain glucose hypometabolism. The nigro-striatal dopaminergic system can be altered in iRBD [30] and in particular, the nigro-caudate deafferentation has been proposed as a marker of RBD [31]. Indeed, dopaminergic system abnormalities identify those iRBD subjects at high risk of short-term conversion [32]. Moreover, MRI substantia nigra alterations have been found in iRBD patients [33–35].
In the present study, data-driven discrimination analysis on FDG-PET data achieved moderate accuracy in identifying subjects with RBD (70%) and PD (82%). This is because the model mostly confounds RBD-only and PD-only patterns. Indeed, looking at discriminant analysis (Table 3) most ‘false’ positive RBD were indeed PD patients without RBD while most ‘false’ negative RBD were iRBD. On the other hand (Table 4) most ‘false’ positive PD were iRBD patients while most ‘false’ negative PD were PD patients without RBD. Thus, the intermediate classes were the least discriminated ones. These results further support the hypothesis that iRBD and PD are two contiguous and partially ‘confused’ conditions along, with a shared pathological mechanism.
The use of multidimensional scaling techniques in biomedical science is advisable when in presence of distance spaces computed on multivariate data. Here we adopted a definition of continuity borrowed from ecology [18] that does not imply any theoretical assumption other than the possibility of representing distances between categories on a linear order.
This approach has allowed to highlight the heterogeneity of brain glucose metabolism in RBD and PD. The principal components loading distribution largely overlaps previously published pattern of altered brain metabolism in both PD [11–13] and RBD [14–16] (PDRP and RBDRP, respectively) (Fig. 2). Indeed, both PDRP and RBDRP showed relative hypometabolism in the posterior parietal and occipital cortical regions associated with relatively increased thalamic, brainstem and cerebellum metabolism. In our study, according to both PDRP and RBDRP, bilateral posterior cortical areas have shown a negative factor loading while bilateral cerebellum and right thalamus showed a positive factor loading in the principal component. These brain areas may account for a stable core of brain areas affected by the PD pathology, which can be found in both prodromal PD stages (thus in iRBD patients) and in full-blown PD patients.
Moreover, according to RBDRP but not PDRP, bilateral hippocampal cortex is included with a negative factor loading in the principal component while, according to PDRP but not RBDRP, the globus pallidus and the putamen are included with a positive factor loading. These brain areas may account for the heterogeneity of both RBD and PD and for the different metabolic pattern that can be found at different clinical stages along the continuum from iRBD to full-blown PD and eventually to PDRBD.
Furthermore, our principal component included bilateral cuneus and precuneus with negative factor loadings, which are not included in either PDRP or RBDRP, but they are part of the PD-related cognitive pattern (PDCP) [36]. This novel finding may account for the known association between RBD and cognitive dysfunction, either in iRBD patients [6] and in PD patients with RBD [28].
Interestingly, the principal components found in the present study included brain regions that are not included in either PDRP, PDCP or RBDRP, namely bilateral amygdalae, insulae and caudate nuclei, all with positive factor loadings. This could be a consequence of the pre-processing building of meta-VOIs. Indeed, amygdala and insula were clustered together in a meta-VOI with hippocampal region and caudate nuclei were clustered in a large region along with globus pallidus and putamen. Thus, these meta-VOIs might be included in the principal component due to the weight of hippocampal and globus pallidus regions, respectively. On the other hand, this might represent features that are not observed when evaluating the characteristic of PD or RBD patients alone, but that are noticed when evaluating with the more holistic approach that we adopted, thus further accounting for the heterogeneity of the disease. For instance, a minority of iRBD patients eventually develops multiple system atrophy (MSA), which has a typical metabolic pattern, very different from the typical PD pattern, including putamen and caudate nuclei alterations [37]. Indeed, iRBD patients may develop over time not only PD, but also dementia with Lewy bodies (DLB) and MSA [38]. This may further account for the brain glucose metabolism heterogeneity of iRBD patients.
The presence of strong center-related batch effects can be very detrimental for the analysis of multicenter studies. The classical standardization based on z-score in the case of multidimensional data, as in neuroimaging studies, must be complemented by a check on the invariance of between-areas correlation structure that can be altered by the variance normalization. This possible bias has to be controlled for by the equivalence of the PCA solutions of raw and normalized data (Fig. 1). This approach may be used in clinical research and in clinical trials.
This study has some limitations. First, the current study is cross-sectional and follow-up for iRBD patients is ongoing. In fact, when follow-up will be available we should be able to investigate iRBD who further developed a Lewy body disease. Indeed, it is arguable that iRBD patients who were incorrectly classified in the PD group might be the ones who will convert earlier to a synucleinopathy. On the other hand, PD patients without RBD who were incorrectly classified as iRBD might represent subjects with a more benign phenotype in contrast to those who might have a more aggressive PD subtype, with a worse prognosis. Second, the relatively limited number of subjects does not allow a more precise stratification of the patient to investigate more in depth the role of clinical characteristics on 18F-FDG-PET discrimination ability.
In conclusion, our study has shown an increasing distance from healthy brain glucose metabolism to PD patients with RBD, passing by iRBD and PD. However, data-driven approach to brain 18F-FDG-PET showed only moderate discrimination between subjects with/without RBD and/or PD, suggesting that at least a portion of iRBD patients might be considered, from a biological point of view, already in the spectrum of LBD pathology. This finding adds further evidence to the poor meaning of the term ‘idiopathic’ which may be adequate for at least a part of subjects with clinically isolated RBD [39].
In the present study we have analyzed with a multidimensional scaling approach a larger sample of subjects than previously [17]. In agreement with the previous work, the findings corroborate the hypothesis that RBD and PD share a common brain pathological mechanism. However, we have also shown that the core neuroimaging alteration that can be found in both iRBD and PD patients is not expressed in a small but not negligible part of patients.
Indeed, the multidimensional scaling approach used in the present study has highlighted the heterogeneity of brain glucose metabolism alteration that can be found in both iRBD and PD patients. Thus, our results suggest that patients with iRBD are heterogeneous also from a neuroimaging standpoint since they show different brain imaging endophenotypes that may underlie different clinical trajectories.
The prognostic value of 18F-FDG-PET imaging in defining iRBD patients at high risk of short-term conversion into a neurodegenerative disease needs to be investigated in larger, longitudinal studies.
CONFLICT OF INTEREST
The authors report no conflicts of interest.
Footnotes
ACKNOWLEDGMENTS
This study was partially funded by the Dutch ‘Stichting ParkinsonFonds’ and the German ‘ParkinsonFonds Deutschland’. We thank Dr. Mattioli Pietro for his assistance in the research.