
Abstract
Background:
Dopamine transporter SPECT is an established method to investigate nigrostriatal integrity in case of clinically uncertain parkinsonism.
Objective:
The present study explores whether a data-driven analysis of [123I]FP-CIT SPECT is able to stratify patients according to mortality after SPECT.
Methods:
Patients from our clinical registry were included if they had received [123I]FP-CIT SPECT between 10/2008 and 06/2016 for diagnosis of parkinsonism and if their vital status could be determined in 07/2017. Specific binding ratios (SBR) of the whole striatum, its asymmetry (asymmetry index, AI; absolute value), and the rostrocaudal gradient of striatal binding (C/pP: caudate SBR divided by posterior putamen SBR) were used as input for hierarchical clustering of patients. We tested differences in survival between these groups (adjusted for age) with a Cox proportional hazards model.
Results:
Data from 518 patients were analyzed. Median follow-up duration was 3.3 years [95% C.I. 3.1 to 3.7]. Three subgroups identified by hierarchical clustering were characterized by relatively low striatal SBR, high AI, and low C/pP (group 1), low striatal SBR, high AI, and high C/pP (group 2), and high striatal SBR, low AI, and low C/pP (group 3). Mortality was significantly higher in group 1 compared to each of the other two groups (p = 0.029 and p = 0.003, respectively).
Conclusion:
Data-driven analysis of [123I]FP-CIT SPECT identified a subgroup of patients with significantly increased mortality during follow-up. This suggests that [123I]-FP-CIT SPECT might not only serve as a diagnostic tool to verify nigrostriatal degeneration but also provide valuable prognostic information.
INTRODUCTION
Dopamine transporter SPECT with [123I]FP-CIT is an established method to investigate nigrostriatal integrity in case of clinically uncertain parkinsonism. For identification of neurodegenerative parkinsonism, dopamine transporter SPECT with [123I]FP-CIT provides a sensitivity of 78% to 97% and an excellent specificity of >95% [1, 2]. Importantly, a nigrostriatal dopaminergic deficit is not only a hallmark of Parkinson’s disease but is also observed in so-called atypical parkinsonian syndromes (APS), including multiple system atrophy (MSA), progressive supranuclear palsy (PSP), and corticobasal degeneration (CBD) [3]. Consequently, normal presynaptic dopaminergic imaging was included as an exclusion criterion into the diagnostic criteria for Parkinson’s disease [4] and current international guidelines clearly discourage the use of dopamine transporter SPECT for differential diagnosis of neurodegenerative parkinsonism [5, 6].
Beyond accurate diagnosis of nigrostriatal degeneration to initiate optimal treatment, prognosis of the disease course and survival is an important part of patient counseling in clinical practice. A less favorable prognosis may also prompt closer patient follow-up and more aggressive treatment (e.g., inclusion in clinical trials). Prognosis is commonly based on the clinical diagnosis, and patients with a diagnosis of Parkinson’s disease have a median survival of 7 to 14 years after disease onset (depending on the age at onset) [7, 8], whereas median survival in APS is only 7 to 8 years [9–11]. However, due to the large variance of reported survival durations, individual prognosis based on clinical diagnosis is difficult.
Moreover, the clinical diagnosis is of limited accuracy in parkinsonian syndromes (74–84%, depending on clinical expertise and disease stage) [12]. Hence, imaging-based prognosis of survival might be more accurate than prognosis based on the clinical diagnosis. In an [18F] FDG PET study, an imaging-based prognosis of comparable accuracy to the clinical stratification was achieved earlier in the disease course, and tended to reach a more differentiated prognostic stratification between Parkinson’s disease on one side and dementia with Lewy bodies/Parkinson’s disease with dementia, PSP/CBD, and MSA on the other [11].
Prognosis based on imaging of striatal dopaminergic integrity has rarely been investigated before. Only one previous study used [123I]FP-CIT SPECT and concluded that dopamine transporter SPECT does not predict mortality in Parkinson’s disease [13]. A study using [18F]Fluorodopa PET, also a marker of nigrostriatal integrity and as such comparable to [123I]FP-CIT SPECT, also did not find an association between survival and the extent of the dopaminergic deficit in Parkinson’s disease [14].
Taken together, it is established that the striatal specific binding ratio (SBR) on [123I]FP-CIT SPECT has little value for differentiating between parkinsonian syndromes [5, 6], although it has excellent diagnostic accuracy for detecting nigrostriatal degeneration in parkinsonian syndromes per se [1, 2]. Both, asymmetry and the rostrocaudal gradient of striatal dopamine transporter binding on the other hand have shown differences between parkinsonian syndromes (for a review, see [3]). Given that survival differs between parkinsonian syndromes, we hypothesized that the latter two variables, in combination with striatal SBR, might improve prognosis. As a useful combination of these predictor variables was unknown a priori, we chose a data-driven, observer-independent method as opposed to arbitrarily selected combinations by the investigators.
Against this background, the present study investigated whether a data-driven analysis applied to dopamine transporter SPECT bears the potential to identify a high-risk group with increased mortality. For this purpose, we analyzed a large, monocentric, clinical patient sample, solely based on imaging data, which were acquired as part of the diagnostic process in patients with clinically uncertain parkinsonism.
MATERIAL AND METHODS
Patients
We included patients from our clinical registry if they had received [123I]FP-CIT SPECT between 10/2008 and 06/2016 and if their vital status (alive or date of death, if applicable) could be determined in 07/2017 from the state resident registration. Following the German interdisciplinary guideline on Parkinson’s disease the indication for [123I]FP-CIT SPECT was early-stage clinically uncertain parkinsonism in the vast majority of cases. Few exceptions included patients scheduled for deep-brain stimulation or follow-up examinations (the latter were excluded, n = 3). Referring sites include tertiary referral centers (university hospital and a specialized clinic for movement disorders) and private neurological practices. Notably, subjects who had received [123I]FP-CIT SPECT for diagnosis of dementia (e.g., for differential diagnosis between dementia with Lewy bodies and Alzheimer’s dementia) were not included. Survival time (from time of [123I]FP-CIT SPECT) of individual patients was either confirmed by the documented date of death in the hospital information system or otherwise by automated queries against the state resident registry yielding either confirmation of survival or the date of death. Patients who moved from the state of Baden-Württemberg could not be tracked due to data protection legislation and were lost to follow up. Patients’ consent was obtained and the study proposal was approved by the local Ethics Committee (proposal no. 351/16).
Data availability statement
The data that support the findings of this study are available on reasonable request from the corresponding author. The data are not publicly available as they contain information that could compromise the privacy of research participants.
SPECT acquisition and processing
During the contemplated time period all scans were acquired on the same dual-headed SPECT system (E.CAM, Siemens, Germany) equipped with a low-energy high-resolution parallel-hole collimator using a highly standardized approach starting at exactly 3 h after intravenous bolus injection of 193±9 MBq [123I]FP-CIT (GE Healthcare, Germany; thyroid uptake blocked with sodium perchlorate). Acquisition parameters were as follows: 60 30-s projections per head; radius of rotation: 13.5 cm (in few cases, a slightly larger radius needed to be chosen due to the individual anatomy); energy window: 159 keV±15%; acquisition matrix: 128×128; zoom factor: 1.23. Data sets were reconstructed using an iterative three-dimensional ordered subset expectation maximization algorithm with resolution recovery (8 subsets, 8 iterations, 8-mm Gaussian filtering [15]) and corrected for attenuation employing Chang’s method (μ= 0.12/cm–1) (Syngo Software; Siemens, Germany). For stereotactic normalization of each patient’s data set to an institutional 123I-FP-CIT template in MNI space, the software ‘Statistical parametric mapping’ was used (SPM8; Wellcome Trust Centre for Neuroimaging, UK).
Regions of interest (ROI) were taken from the AAL atlas [16] and modified (Supplementary Material 2): binary image volumes of caudate and putamen were smoothed with a Gaussian filter of 12 mm FWHM and then thresholded at 10% of the maximum. The putamen was split into anterior and posterior parts at y = 0 mm (Montreal Neurological Institute space, corresponding to the position of the anterior commissure). ROI median values were extracted and individual specific binding ratios (SBR; occipital cortex as reference) of the whole striatum and striatal subregions (caudate nucleus, anterior and posterior putamen) of both hemispheres were calculated.
Hierarchical clustering
Agglomerative hierarchical clustering was used to identify subgroups of patients. As input variables we selected three measures that are commonly used in routine diagnostics and in earlier studies correlating SPECT findings with clinical features and diagnoses (see [3]): SBR of the whole striatum, asymmetry of striatal binding (asymmetry index, AI, calculated as absolute value of (SBRright – SBRleft)*2/(SBRright + SBRleft; expressed as percent), and the rostrocaudal gradient of striatal binding (C/pP calculated as average SBRcaudate/average SBRposterior putamen). A reduced SBR indicates striatal dopaminergic deficit and neurodegenerative parkinsonism as opposed to, e.g., essential tremor [1, 2]. Furthermore, striatal SBR is often more reduced in APS than Parkinson’s disease [17]. The AI is often larger in CBD and Parkinson’s disease compared with PSP and MSA and, particularly, patients without nigrostriatal degeneration (normal DAT binding; [18–20]). Finally, the involvement of caudate nucleus and putamen is often more homogeneous in APS (particularly PSP; thus, the rostrocaudal gradient being lower) than in Parkinson’s disease [17, 20].
Because of the skewed distribution of the AI, log-transformation was applied. SBR of the whole striatum and C/pP were adjusted for previously demonstrated age-dependency [21, 22] based on regression analyses of scan results from a group of 216 patients with scans clinically read as normal (mean age 66±12 years; n = 169 were also part of the present study population; please see Supplementary Material 1). The hierarchical clustering algorithm with complete-linkage starts by putting each patient in a separate cluster. Next, the two clusters which are most similar, based on the Euclidean distance, are merged together. This procedure is repeated iteratively until all patients are grouped into one cluster. An advantage of the hierarchical clustering approach compared to, e.g., k-means clustering, is that there is no requirement to choose the number of clusters beforehand [23]. In contrast, the number of clusters we investigated was determined afterwards by the elbow method, the average silhouette method, and the gap statistic [24].
Survival analysis
A Cox proportional hazards model was computed in order to test whether survival (adjusted for age) was different between the subgroups identified by the preceding hierarchical clustering.
Finally, an exploratory comparison of survival of the patient groups with the survival of an age- and sex-matched German standard population was conducted using a log-rank test as described in [28]. We used death rates of the whole German population in 2008 to 2010 from data of the German Federal Statistical Office (https://www.destatis.de), as patients were included since 2008. Accordingly, this is a conservative approach given the increasing life expectancy for later birth cohorts.
We used R 3.5.1 (R Core Team, 2018), ‘survival’ [25] for regression analysis, ‘cluster’ [26] for advanced cluster analysis, and ‘ggplot2’ [27] for data visualization. The significance threshold was set to p < 0.05.
RESULTS
566 patients were identified from our clinical registry who had received [123I]FP-CIT SPECT between 10/2008 and 06/2016 for diagnosis of parkinsonism. The vital status of 518/566 patients could be determined in 07/2017. Of the 518 patients, 77 died during follow-up. The median follow-up duration (from time of [123I]FP-CIT SPECT) as estimated by the reversed Kaplan-Meier procedure was 3.3 years [95% C.I. 3.1 to 3.7].
Hierarchical clustering
The gap statistic as well as the elbow method of total within sum of squares suggested the number of clusters to be three while the average silhouette method suggested two. We followed the majority of methods to define the optimal number of clusters and continued our analysis with three clusters (see Supplementary Material 2).
Each cluster (groups 1 to 3) was characterized by a unique signature with respect to the 3 considered variables: relatively low striatal SBR, high AI, and low C/pP (group 1), low striatal SBR, high AI, and high C/pP (group 2), and high SBR, low AI, and low C/pP (group 3) (Fig. 1). As shown in Fig. 2, the average scan in group 1 and 2 showed somewhat asymmetric nigrostriatal dopaminergic deficits that affected the entire striatum more homogeneously in group 1 compared to group 2. In turn, the average scan in group 3 is compatible with a normal [123I]FP-CIT SPECT finding. The significance of these differences was supported by MANOVA overall (Pillai’s trace) as well as for each variable separately (all p < 0.001). Concerning pairwise comparisons of each of the three binding parameters (post hoc t tests), all groups significantly differed from each other. The rank orders were as follows (for details see Table 1): SBR, group 1 < group 2 < group 3; AI, group 1 > group 2 > group 3; CpP, group 1 < group 3 < group 2. For comparison, the average SBR, AI and C/pP values of the 216 subjects with scans clinically read as normal (n = 169 also included in the present study population) and used for age correction were 1.40±0.28, 5% ±4%, and 0.49±0.15, respectively.
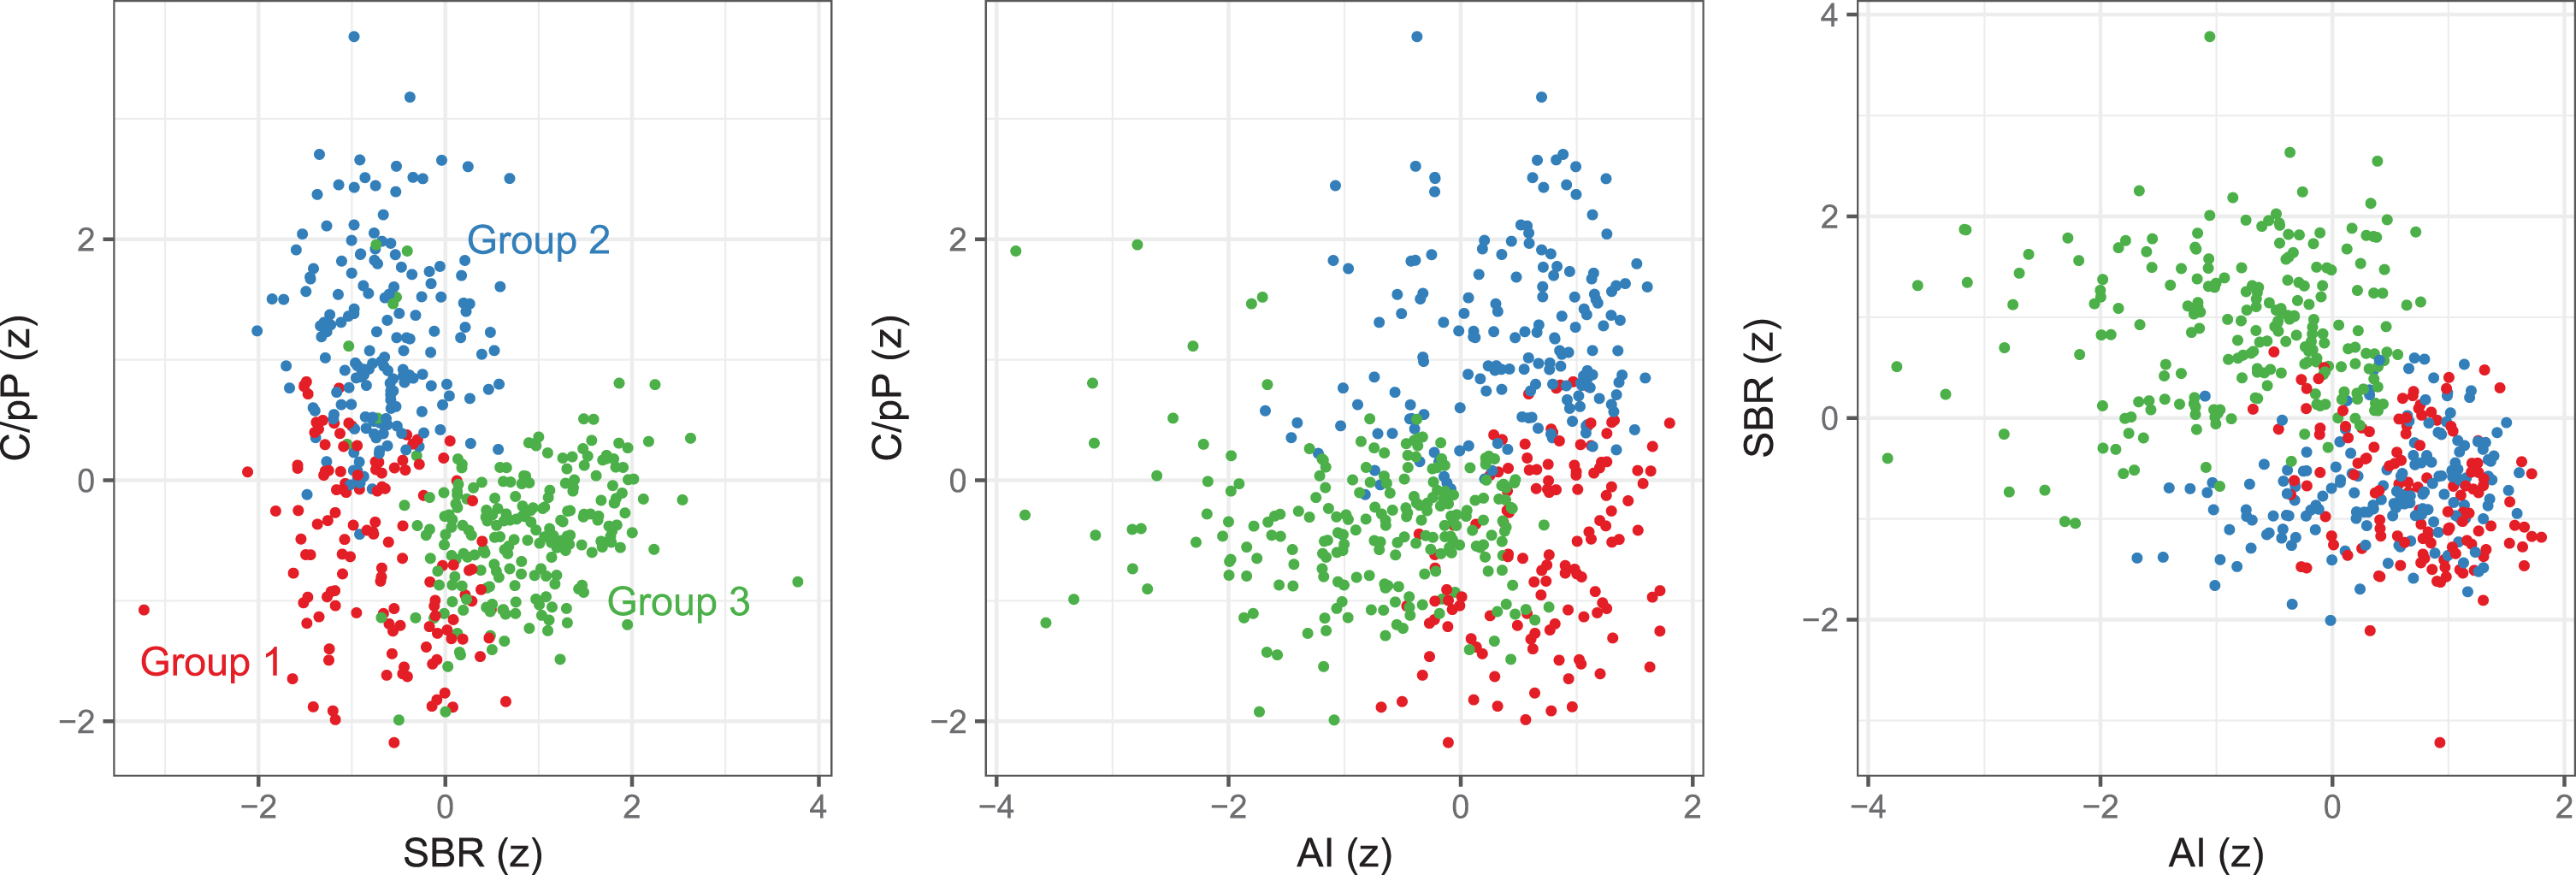
Patient groups identified by hierarchical clustering differed by specific binding ratio (SBR) of the whole striatum, asymmetry index (AI), and rostrocaudal gradient (SBRcaudate/SBRposteriorputamen, C/pP; all z-transformed, SBR and C/pP were adjusted for age; absolute AI was log-transformed). Red, group 1; blue, group 2; green, group3.
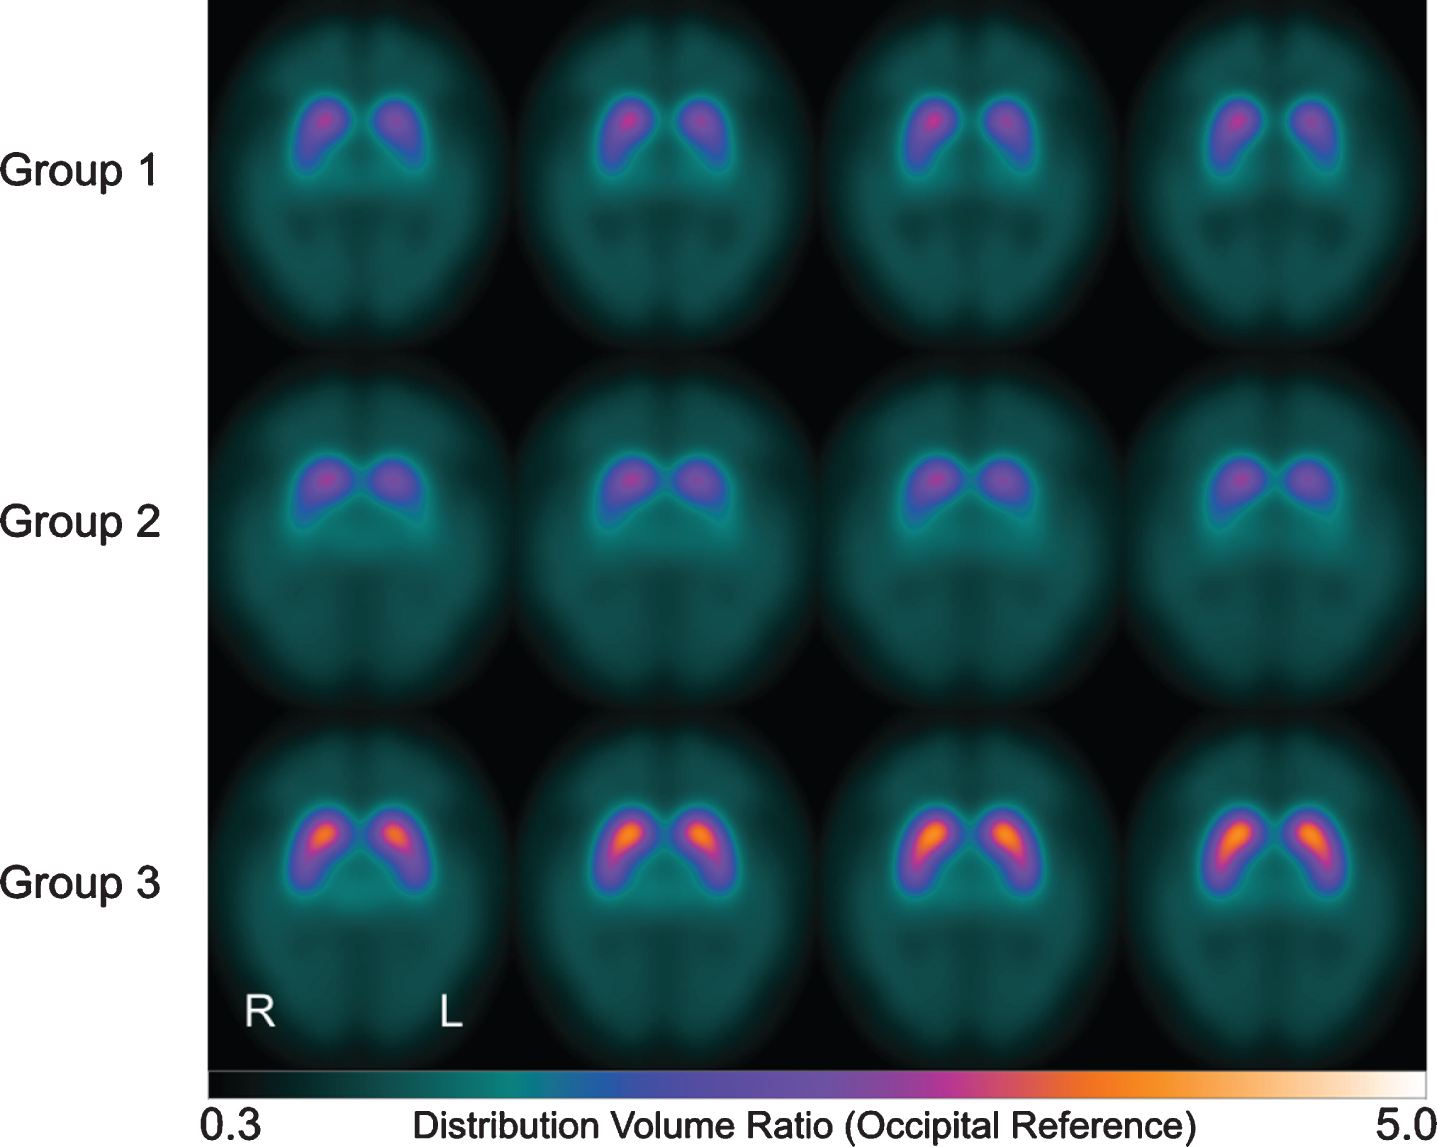
Axial slices of averaged parametric [123I]FP-CIT scans (occipital cortex as reference region) for each of the groups identified by hierarchical clustering. Scans were left-right-flipped if necessary, such that in each case striatal SBR was lower in the left hemisphere. L, left; R, right.
Characteristics of the patient sample and the subgroups identified by hierarchical clustering
adifference between groups 1 and 2 (p < 0.01, post hoc t test); bdifference between groups 1 and 3 (p < 0.001, post hoc t test); cdifference between groups 2 and 3 (p < 0.001, post hoc t test); ddifference between groups 1 and 2 (p < 0.001, post hoc t test); edifference between groups 1 and 3 (p < 0.01, post hoc t test); SBR, specific binding ratio; AI, asymmetry index; C/pP, SBRcaudate/SBRposteriorputamen.
Survival analysis
Mortality was significantly higher in group 1 compared to each of the other two groups (Fig. 3): With group 2 as reference, the hazard ratio (HR) of group 1 was 1.9 [95% C.I. 1.1 to 3.3] (p = 0.029). With group 3 as reference, the HR of group 1 was 2.2 [95% C.I. 1.3 to 3.8] (p = 0.003) (see Supplementary Material 1 for cross-validation). There was no significant difference in mortality between groups 2 and 3 (p = 0.574). Median survival was 7.5 years in group 1, whereas median survival could not be estimated for groups 2 and 3 because the follow up period was not long enough. The estimated 5-years mortality rates were 28%, 15%, and 17% in groups 1, 2 and 3, respectively.
Compared to the matched German standard population, survival was shorter in group 1 (p < 0.001) and group 2 (p < 0.05). In contrast, the survival of group 3 was not significantly different from that of the standard population (Fig. 3).
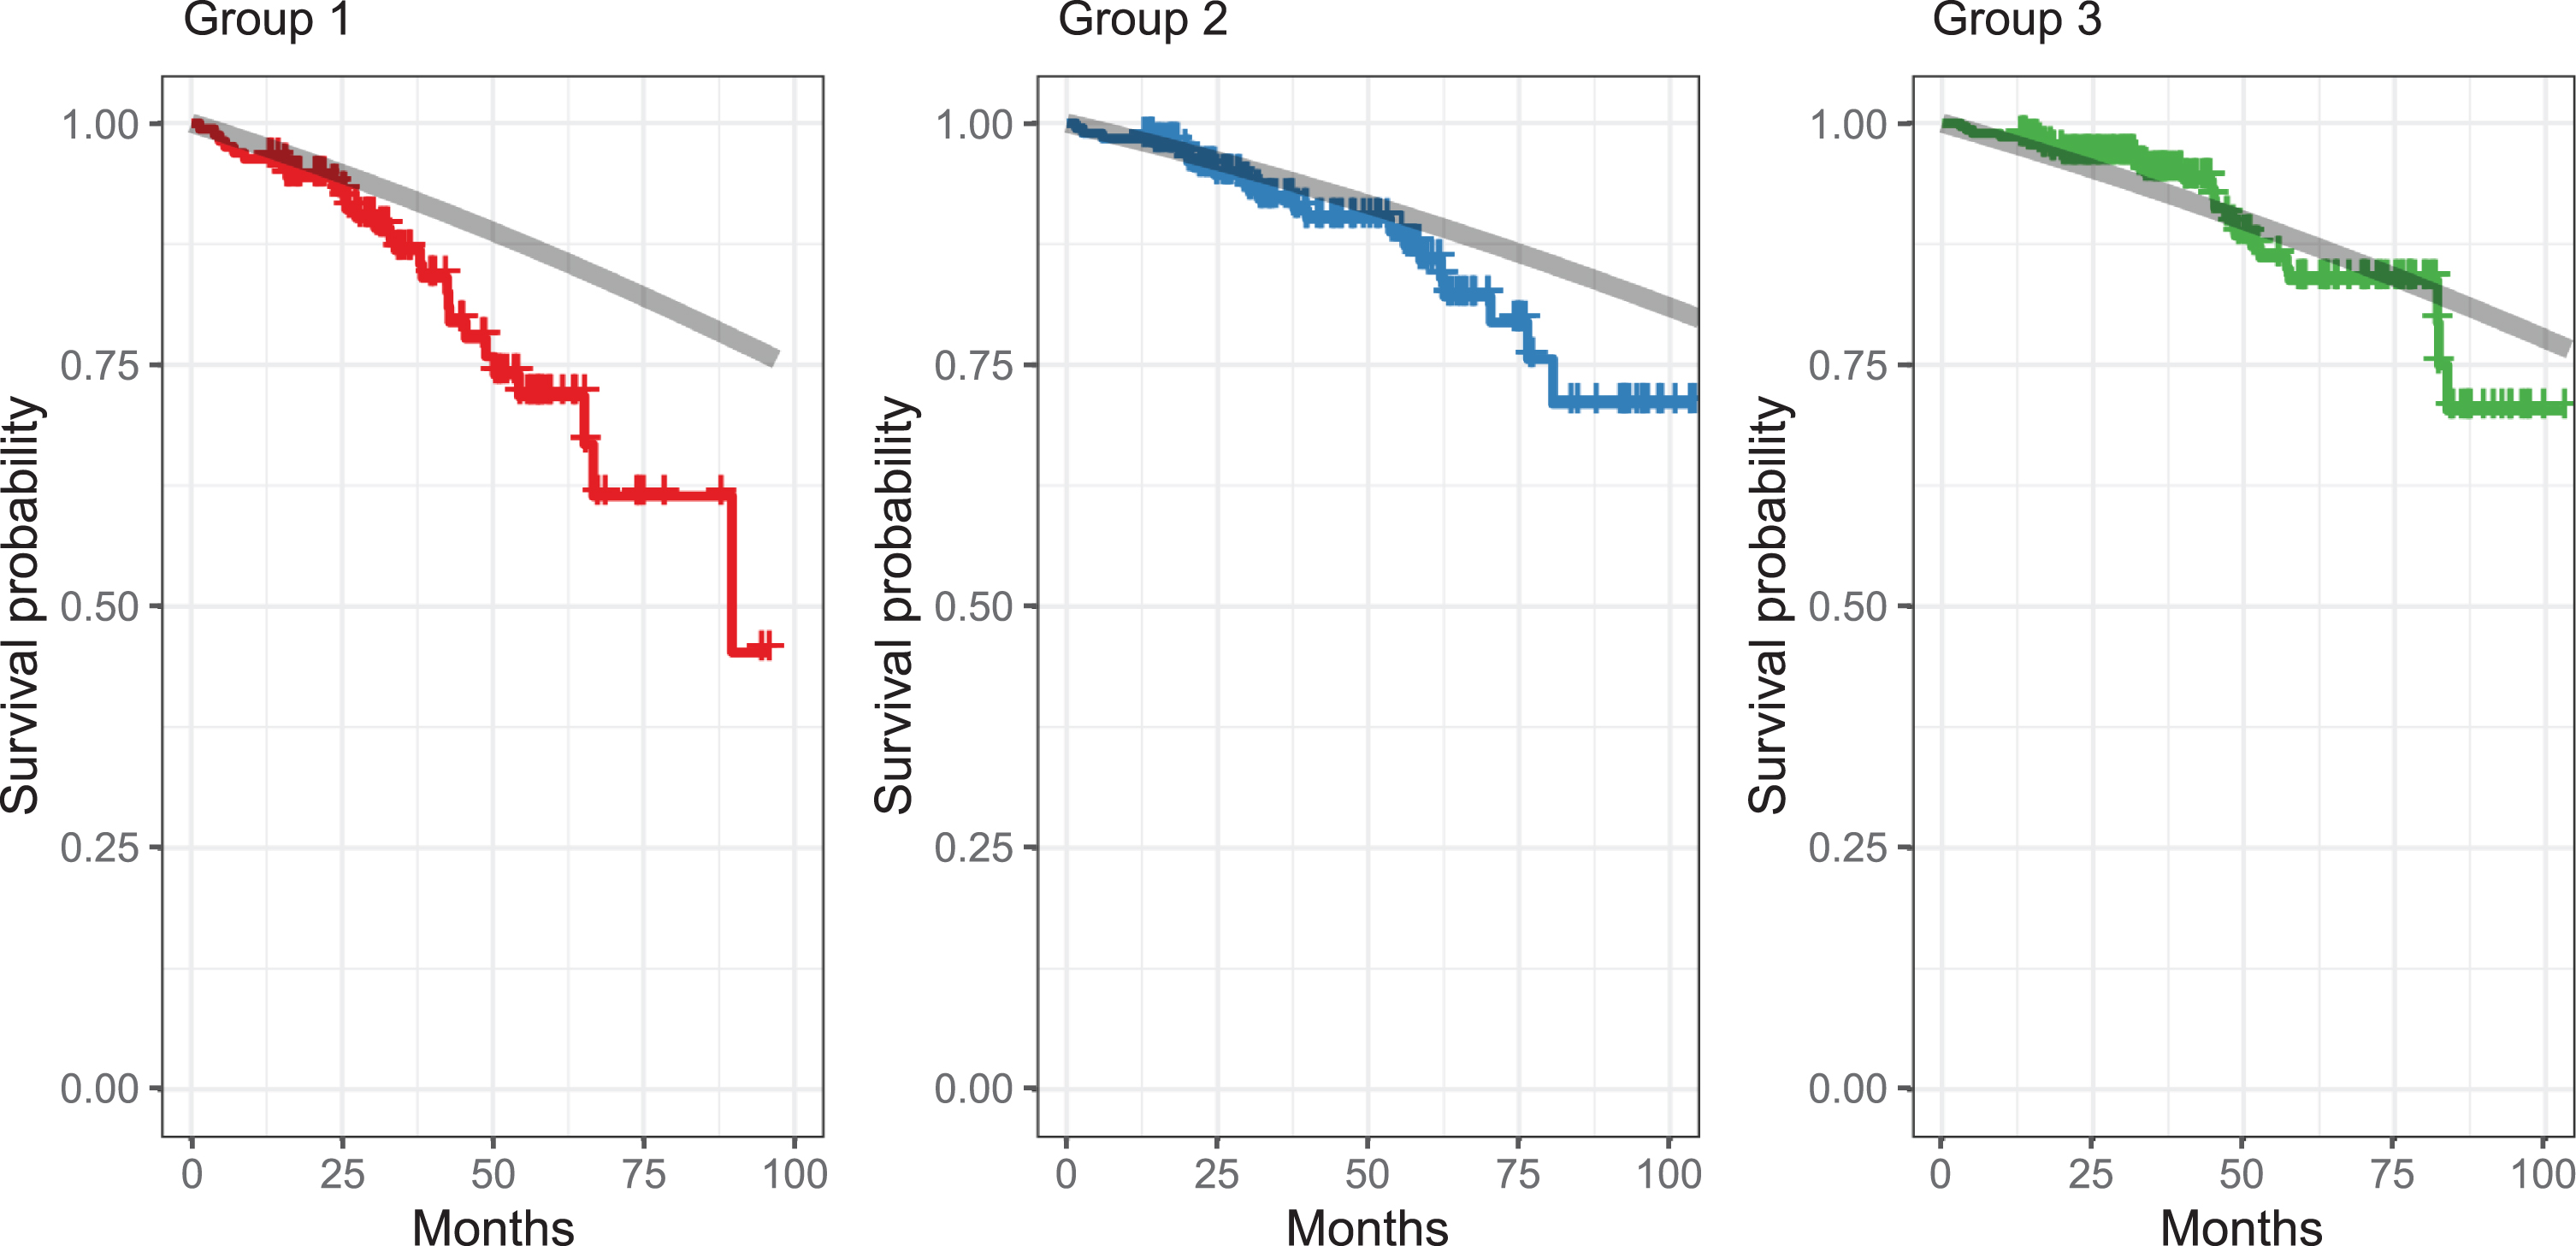
Kaplan-Meier survival estimates per group. Shorter survival in group 1 than in the other groups (adjusted for age). Gray lines show expected survival in the general population (matched by age and sex for each patient). Death rates were obtained from https://www.destatis.de (2008/10) and plotted for comparison. See [28] for technical details.
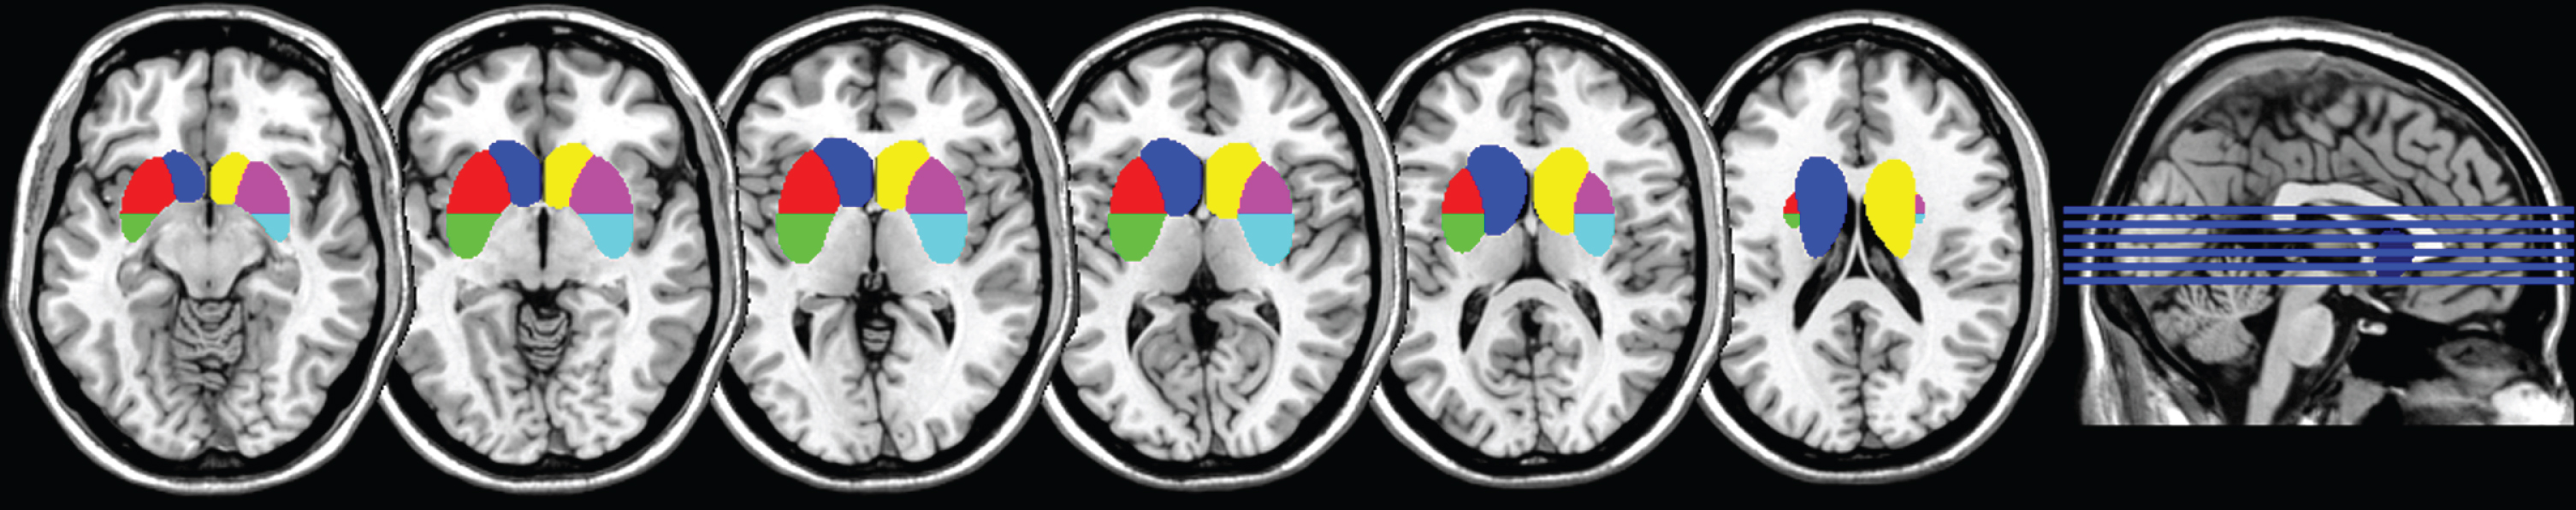
Regions-of-interest used for extraction of SBR of the caudate nucleus (blue and yellow), anterior putamen (red and magenta), and posterior putamen (green and cyan), overlaid on a template MRI in Montreal Neurological Institute space.
Confirmatory Cox regression analyses revealed that none of the three predictor variables alone (SBR of the whole striatum, AI, or C/pP; as continuous predictors or each split into three strata of equal range) allowed for identification of a high-risk group with shorter survival.
DISCUSSION
In patients with clinically uncertain parkinsonism, data-driven analysis of [123I]FP-CIT SPECT identified a subgroup of patients with significantly increased mortality during follow-up. An exploratory comparison to survival data from the general population indicated that this high-risk patient group had a highly significantly increased mortality.
This study is one of the first to test the predictive value of nigrostriatal integrity for survival. Our sample represents a clinically realistic sample of cases with clinically uncertain parkinsonism which might benefit from additional risk stratification. The sample analyzed here is a representative sample of patients referred to SPECT imaging in so far as we contemplated the entire population referred to our clinic for this purpose in the years 2008 to 2016. Survival at follow-up could successfully be determined in 92% of cases in this large sample.
The doubled mortality risk (HR of around 2) for the high-risk group is well comparable to the mortality risk associated with established clinical predictors, e.g., in Parkinson’s disease, dementia (HR = 1.7) [29]; cognitive impairment (HR = 3.0) [30], and depression (HR = 2.3) [30]; in MSA, orthostatic hypotension (meta-analysis, pooled HR = 1.3) [31], early onset of autonomic failure (HR = 2.8) [32], incomplete bladder emptying (HR = 2.1) [33], and early onset of falls (pooled HR = 2.3) [31]; in PSP, PSP-RS versus PSP-P (pooled HR = 2.4) [31], early onset of dysphagia in PSP (HR = 2.3) [34], and early onset of falls (pooled HR = 2.3) [31].
Two previous studies investigated the predictive value of a striatal dopaminergic deficit for survival [13, 14], and both did not observe an association between the extent of the dopaminergic deficit and mortality. Notably, both studies investigated survival in samples of Parkinson’s disease patients only, therefore excluding APS patients, who typically have shorter survival and a different signature of the striatal dopaminergic deficit, e.g., more homogeneous and severe involvement of caudate and putamen in APS compared to Parkinson’s disease [17, 35]; for a review see [3]. In line with previous data, in our study the extent of the striatal dopaminergic deficit per se did not predict survival. However, the combination of the extent of the striatal dopaminergic deficit with its spatial signature allowed for prognostic stratification.
One of the three groups identified by hierarchical clustering apparently included predominantly patients with normal scans (group 3). Group 2 showed a dopamine transporter binding profile suggestive of Parkinson’s disease. By contrast, the high-risk group 1 showed a different signature of the striatal dopaminergic deficit, i.e., low and asymmetric dopamine transporter availability with homogeneous involvement of caudate and putamen. The latter has been described previously in patients presenting with certain subtypes of parkinsonism: first, in patients with the akinetic-rigid subtype of Parkinson’s disease [36] which has been associated with shorter survival than the tremor-dominant subtype; second, in patients with APS [17, 35] (for a review, see [3]). The notion that the high-risk group includes a mixture of APS and Parkinson’s disease patients is also corroborated by the median survival time of 7.5 years after [123I]FP-CIT SPECT. This lies between the median survival times after diagnosis reported for APS (3–4 years [10, 37]) and Parkinson’s disease (8 years, depending on the age at onset [37]) in previous studies.
Furthermore, while no systematic long-term clinical follow-up data was available, 150/518 patients in total also underwent FDG PET as a well-established diagnostic marker in parkinsonian syndromes (for meta-analyses, see [38, 39]). In line with the aforementioned assumption, the proportion of patients with a regional metabolic pattern suggestive of an APS was much higher in the high-risk group 1 (12/42, 29%) compared to group 2 (8/48, 17%) and group 3 (3/60, 5%) (Fisher’s Exact Test, p = 0.0034; data not shown in detail).
Therefore, the ability to predict survival in patients with uncertain parkinsonism might also reflect the ability to identify APS patients. Notably, this was not a predefined purpose of the cluster analysis in our study. It might thus be intriguing to pursue follow-up studies, preferably including [18F]FDG PET (for a review, see [38]) or, ideally, postmortem diagnosis for optimized identification of APS patients. Moreover, as differential diagnosis of Parkinson’s disease versus APS is not considered a strength of [123I]FP-CIT SPECT and actually discouraged in current guidelines [5, 6], such analyses might benefit from the use of higher resolution [18F]FP-CIT PET [20].
Age was correlated with striatal binding and rostrocaudal gradient (not shown in detail), therefore both were age-adjusted in the cluster analysis. Whereas the physiological decline of dopamine transporter availability with increasing age is well established [21, 40], reports on the association between age and the rostrocaudal gradient of striatal binding are conflicting (probably depending on the method used) [21, 40]. However, the presence of this association is in line with the previous observation of the association between the putamen-to-caudate ratio with disease severity in Parkinson’s disease [41]. Further, age was included as a covariate in the survival analysis in order to obtain differences between identified clusters that were not confounded by age. As expected, age was itself a significant predictor of survival, consistent with a previous study [14].
Limitations of the study
The present approach relies on a data-driven analysis of a very comprehensive population covering 8 years of clinical SPECT imaging (n = 664 in total, selected for the present analysis n = 518). For practical reasons this necessarily implies that properly validated clinical follow-up diagnoses and individual clinical data (e.g., type, severity and duration of motor symptoms) are available only in a restricted number of patients which would prohibit data-driven analyses. Thus, a comparison to imaging-based predictions or clusters is also not possible. However, this does not compromise the major finding of the present study that [123I]FP-CIT SPECT is of relevant prognostic value in patients with neurodegenerative parkinsonism well beyond its acknowledged diagnostic value (in particular, normal scan as formal exclusion criterion of Parkinson’s disease [4]). For future application to individual clinical cases, risk stratification might benefit from a combined inclusion of imaging and clinical variables [42]. Individual causes of death were also not regarded here, as they were not reliably documented in our sample. A natural extension of our approach would be to use convolutional neural networks directly on the imaging data and infer latent representations that could be employed for survival analysis. However, the method presented in the current study already bears the potential to assign new patients based on [123I]FP-CIT scans to one of the risk groups.
Conclusion
In patients with clinically uncertain parkinsonism, data-driven analysis of [123I]FP-CIT SPECT identified a subgroup of patients with significantly increased mortality during follow-up. The pattern of nigrostriatal degeneration observed in this group includes findings observed primarily in atypical parkinsonian syndromes but also in subtypes of Parkinson’s disease with less favorable outcome. This suggests that [123I]FP-CIT SPECT might not only serve as a diagnostic tool to verify nigrostriatal degeneration but also provide valuable prognostic information in terms of a warning sign that triggers additional examinations for differential diagnosis of parkinsonism or intensified clinical follow-up.
CONFLICT OF INTEREST
Dr. Meyer reports personal fees from GE, personal fees from Philips, outside the submitted work. All other authors have nothing to disclose.