
Abstract
Background:
Currently, there is no established biomarker for Parkinson's disease (PD) and easily accessible biomarkers are crucial for developing disease-modifying treatments.
Objective:
To develop a novel method to quantify cerebrospinal fluid (CSF) levels of α-synuclein protofibrils (α-syn PF) and apply it to clinical cohorts of patients with PD and atypical parkinsonian disorders.
Methods:
A cohort composed of 49 patients with PD, 12 with corticobasal degeneration (CBD), 22 with progressive supranuclear palsy, and 33 controls, that visited the memory clinic but had no biomarker signs of Alzheimer’s disease (AD, tau<350 pg/mL, amyloid-beta 42 (Aβ42)>530 pg/mL, and phosphorylated tau (p-tau)<60 pg/mL) was used in this study. The CSF samples were analyzed with the Single molecule array (Simoa) technology. Total α-synuclein (α-syn) levels were analyzed with a commercial ELISA-kit.
Results:
The assay is specific to α-syn PF, with no cross-reactivity to monomeric α-syn, or the β- and γ-synuclein variants. CSF α-syn PF levels were increased in PD compared with controls (62.1 and 40.4 pg/mL, respectively, p = 0.03), and CBD (62.1 and 34.2 pg/mL, respectively, p = 0.02). The accuracy of predicting PD using α-syn PF is significantly different from controls (area under the curve 0.68, p = 0.0097) with a sensitivity of 62.8% and specificity of 67.7%. Levels of total α-syn were significantly different between the PD and CBD groups (p = 0.04).
Conclusion:
The developed method specifically quantifies α-syn PF in human CSF with increased concentrations in PD, but with an overlap with asymptomatic elderly controls.
Keywords
INTRODUCTION
Parkinson's disease (PD) is the second most common neurodegenerative disease in the world with a significant unmet medical need. Worldwide, more than 4.6 million individuals over the age of 50 suffer from PD, and it is estimated that the number will more than double by the year 2030 [1]. The economic impact of the disease is enormous with millions of euros spent annually on symptomatic treatment [2, 3]. There is a huge need for treatments that slow or halt disease progression [4, 5]. Improved patient outcomes could be achieved by early diagnosis and disease-modifying treatment. To this end, we developed and validated a novel quantitative PD biomarker assay that could be used to follow the underlying pathophysiology of the disease.
PD belongs to a large group of “parkinsonian disorders,” where the main clinical symptoms are motor-related, manifested by resting tremor (specific for idiopathic PD), bradykinesia, rigidity and postural instability [6]. The primary motor characteristics of the disease are mainly due to the progressive degeneration of dopaminergic neurons in the substantia nigra (SN) and projections to the caudate and putamen, with subsequent decline in dopamine (DA) content [7]. Non-dopaminergic degeneration has also been reported on multiple sites in the PD-affected brain and is primarily linked to non-motor symptoms such as dementia, sleep disturbances, mood swings and severe anxiety [8, 9]. The major protein component of Lewy bodies (LBs), the pathological hallmark of PD, is aggregated α-syn [10], and studies on autopsy material from patients with PD suggest that LBs are formed prior to the appearance of motor symptoms [11]. In addition, point mutations and multiplications in the SNCA gene have been linked to familial PD [12], and polymorphisms of the α-syn promoter have been associated to increased risk of PD onset [13]. Increasing data suggest that the soluble oligomeric form of α-syn is neurotoxic and may trigger neurodegeneration [14]. Together these data strengthen the association between protein-misfolding and disease, where α-syn plays a key role. As a result, targeting α-syn for the development of disease-modifying drugs is a promising approach for fighting PD.
The differential diagnosis of PD is based on clinical features, and the gold standard still remains neuropathological confirmation [15]. The detection of changes in α-syn levels in cerebrospinal fluid (CSF) and blood of PD patients has been proposed as biomarker for diagnosis of disease and severity (reviewed in [16]). Several studies have been published evaluating monomeric α-syn as a potential diagnostic biomarker and most studies point towards a slight overall decrease of α-syn in CSF [17–19]. Other studies also suggest that α-syn oligomers are increased in PD CSF [20–22]. A relatively new technique called protein misfolding cyclic amplification (PMCA) used to multiply minute quantities of prion proteins [23] has been standardized to detect α-syn aggregates in various synucleinopathies, suggesting that α-syn-PMCA may provide an efficient and non-invasive biochemical test for the diagnosis of PD [24, 25]. Two recent studies applying the real-time quaking-induced conversion of α-syn (α-syn RT-QuIC) have provided the first prototypes for ultrasensitive and specific detection of α-syn aggregates in CSF of patients with PD and other synucleinopathies [26, 27].
The aggregated species of α-syn can form oligomers and protofibrils (PF). Oligomers refer to smaller soluble aggregates that can be on the way of forming fibrils (on-pathway) or fixed in a conformation that does not form fibrils (off-pathway) while PF are larger soluble multimeric species that always form fibrils [28, 29]. Measuring soluble aggregated proteins in the CSF of humans has been challenging due to the very low levels of the protein aggregates, which are thought to be in the femtomolar (fmol) range [30]. Most often, assay sensitivity is only good enough to measure aggregates in brain tissue or in various matrices from pre-clinical disease models, where the protein of interest many times is over-expressed, while levels in human CSF are at or near the detection limit [31]. Although studies have been published indicating CSF α-syn as a potential diagnostic biomarker, these findings have not yet been clinically validated. Therefore, we have used an ultra-sensitive technology called Single molecule array (Simoa) [32] to develop and validate a method capable of quantifying levels of α-syn PF in clinical cohorts of patients with PD and other parkinsonian disorders. The ultra-sensitivity is achieved by transferring magnetic beads binding your protein biomarker of interest, into femtoliter wells and enabling single molecule detection through fluorescence imaging using electron micrograph [33]. Hence, the uniqueness with this approach is that the concentration is based on the number of fluorescent beads, instead of mean fluorescence per sample. Using this novel Simoa technique, assay sensitivity can be enhanced up to three logs and levels of toxic α-syn PF can be evaluated in low picomolar-femtomolar levels [30].
MATERIALS AND METHODS
Calibrator: Recombinant α-syn
α-Syn PF (HNE-PF, BioArctic, Sweden) were used as calibrator [34]. Briefly, to produce aldehyde-induced α-syn, HNE (4-hydroxy-2-nonenal) was added to the α-syn samples to a molar ratio of 30:1 HNE:α-syn. The samples were then incubated at 37°C for 18 hours, and unbound aldehyde was removed by a Zeba desalt spin column (Thermo Fisher Scientific, USA) equilibrated with 20 mM Tris pH = 7.4 and 0.15 M NaCl. Ready-to-use calibrators were prepared with the highest calibration point at 3500 pg/mL. Before each run, a 2-fold serial dilution down to 3.4 pg/mL (lowest calibration point) was performed.
Antibodies
The antibody rec38FII (BioArctic, Sweden) [35] was used as capture antibody. Previous experiments performed by our group reveal that this antibody has higher affinity and selectivity for α-syn PF than for oligomers (data not shown). The α/β-synuclein antibody (F-11, lot no. B1717, Santa Cruz Biotechnology, USA) was used as detection antibody (Table 1).
Description of the antibodies used
Single molecule array (Simoa TM )
Magnetic homebrew carboxylated beads (Quanterix, USA) were activated by adding 0.1 mg/mL of 1-ethyl-3-(3 dimethylaminopropyl)carbodiimide hydrochloride (EDC, Thermo Fisher Scientific, USA) to a bead solution with 1.4×10⁶ beads/μL. After incubating at room temperature (RT) for 30 min, the beads were washed in a magnetic separator and 0.2 mg/mL of ice-cold capture antibody was added. The beads were incubated for 2 h on an agitator (HulaMixer, Invitrogen, USA) at 4°C. The beads were then washed and a blocking solution was added. After additional washes, the conjugated beads were re-suspended in corresponding bead diluent and stored at 4°C for future use. The monoclonal detection antibody F-11 (200μg/mL) was biotinylated by adding a 40X biotin excess (EZ-Link™ NHS-PEG4-Biotin, Thermo Fisher Scientific, USA) followed by 30 min incubation at RT. Free biotin was removed using an Amicon Ultra Centrifugal Filter (Millipore, Germany) and the biotinylated antibody was stored at 4°C, as described in [36]. Human CSF samples and HNE-PF standard (240μL) were analyzed in duplicates in the Simoa HD-1 Analyzer (Quanterix, Lexington, MA). In short, the HNE-PF standard was diluted in assay diluent pH = 9.0 (50 mM Tris, 0.1% Tween, 5 mM EDTA, 2% BSA) to construct the calibration curve (as described above). Samples and standard were plated on a 96-well plate (NUNC, Thermo Fisher Scientific, USA). The conjugated beads were washed 2 times in bead diluent buffer and then re-suspended in the corresponding volume of bead diluent along with 10μg/mL blocking solution (TruBlock™, Meridian Life Science, Inc., USA). The detector antibody was diluted in assay diluent pH = 9.0 to a final concentration of 0.3μg/mL and the enzyme SBG (streptavidin β-galactosidase, Quanterix, USA) was diluted in SBG Diluent to a final concentration of 100 pM. Reagents, samples and calibrators were run in the HD-1 Analyzer using a 3-step Assay Neat 2.0 protocol with 25μL conjugated beads, 100μL biotinylated antibody, 100μL SBG and 25μL Resorufin β-D-galactopyranoside (RGP, Quanterix, Lexington, MA) [36].
Development and validation of Simoa α-syn PF assay
The assay was performed using the conditions obtained from the optimization, technical qualification, and assay validation. The validation steps included: the establishment of the limit of detection (LOD) and lower limit of quantification (LLOQ), specificity, precision and accuracy, parallelism, dilution linearity, spike/recovery, and stability [37].
Assay sensitivity was determined by analyzing sixteen blank samples run in duplicates, and the LOD value was determined taking 2.5 SD above the blank. The LLOQ value was determined taking 10 SD above the blank.
The specificity for α-syn aggregates was tested by cross-reactivity to monomeric α-syn (BioArctic, Sweden, lot no. 150424AR), β-syn (rPeptide, USA, cat. #S-1003-2, lot no. 928007BS) and γ-syn (rPeptide, USA, cat. #S-1007-2, lot no. 041315GS). Peptide concentrations up to 3500 pg/mL were tested. Additionally, one CSF sample was spiked with 2, 20, and 200 ng/mL α-syn monomers and analyzed.
To confirm that the signal was derived specifically from CSF α-syn PF levels, two representative CSF samples were immunodepleted using a cocktail of anti-α-syn antibodies (Syn-1, BD Transduction Laboratories; rec38FII, BioArctic; MJFR14, Abcam and FL-140, Santa Cruz Biotechnology, Table 1) according to the following protocol: protein A + G beads were vortexed and transferred to new tubes. The beads were placed on a magnet for 1 min, and the storage buffer was removed and the volume was recorded. The beads were washed by adding 500μL of 1% PBS-Tween, vortexed, spun and put on a magnet to remove supernatant. Beads were then resuspended in an equal volume of the storage buffer removed above. Antibodies or PBS (input control and protein A/G samples) were added to 1100μL of CSF spiked with Tween-20 to a final concentration of 0.05% and incubated on a RotaMix at RT. After 10 min, protein A + G beads were added to all samples (except input control) and incubated for another 40 min. The samples were then spun shortly and placed on a magnet for 2 min and the supernatants from the depleted CSF samples were subjected to Simoa analysis along-side the non-depleted input CSF samples.
Precision and accuracy of the assay was determined using buffer spiked with recombinant α-syn PF (QC1 = 3.7 pg/mL, QC2 = 14.3 pg/mL, QC3 = 27.8 pg/mL) and three individual human CSF samples (CSF1, CSF2, CSF3). Five duplicates of each of these samples were analyzed at four independent occasions. The intra-assay precision is presented as the mean CVr (%), and the inter-assay precision is presented as the mean CVrw (%).
Parallelism was assessed using four individual CSF samples with varying concentrations of endogenous α-syn PF levels. The CSF samples were analyzed undiluted and after serial dilution 1:2, 1:4, 1:8, 1:16, and 1:32. Parallelism was evaluated by determining the mean back-calculated concentrations with a deviation at ≤20% as an indication of parallelism.
To test for dilution linearity, three human CSF samples and buffer were spiked with 700 pg/mL of α-syn PF and serially diluted 1:2, 1:4, 1:8, 1:16, and 1:32. The interpolated value was multiplied by the dilution factor to obtain the initial α-syn PF concentration.
α-Syn concentrations were measured in two CSF samples and buffer spiked with 7 pg/mL, 70 pg/mL and 700 pg/mL of α-syn PF. The concentration of the spiked samples and the endogenous concentration of the CSF samples were measured simultaneously. Recovery was calculated according to the following formula:
In order to test the stability of the α-syn PF at different storage conditions, ten fresh CSF samples were divided into thirty aliquots (250μL) and frozen according to the following scheme: 10 aliquots were stored at – 80°C for 2 months, 10 aliquots were stored at – 20°C for 2 months and the remaining 10 were stored at – 80°C for 1 month and then moved to – 20°C for another month.
Immunoassay for total α-syn in CSF
An enzyme-linked immunosorbent assay (ELISA) kit (catalog number: 844101, Legend Max, BioLegend, USA) was employed to measure total α-syn levels in CSF samples. The analyses were performed as described by the manufacturer.
Clinical study populations
A cohort composed of 49 patients with with PD, 12 with corticobasal degeneration (CBD), 22 with progressive supranuclear palsy (PSP), and 33 age-matched non-PD controls (CT) was used in this study. The PD group was defined according to the clinical diagnostic criteria of the United Kingdom Parkinson's Disease Society Brain Bank [38]. The PSP group was defined according to the National Institute of Neurological Disorders and Stroke and the Society for Progressive Supranuclear Palsy, Inc. clinical criteria [39] and the CBD group was defined according to Lang et al. [40]. The control samples came from patients who had visited the memory clinic but had no biomarker signs of Alzheimer’s disease (AD): tau<350 pg/mL, amyloid-beta 42 (Aβ42)>530 pg/mL and phosphorylated tau (p-tau)<60 pg/mL (Swedish BioFINDER cohort). The descriptive details are presented in Table 5.
Assay for neurofilament light (NFL)
The analyses were performed using the Simoa® NF-Light Advantage Kit from Quanterix (item no. 103186) according to the following protocol: the samples, QCs (quality control samples) and calibrator stock were removed from storage and allowed to thaw. The RGP reagent was shaken for 30 min at 800 rpm and heated to 30°C. The calibrators, samples and QCs were vortexed for 30 sec at 2000 rpm. Then, the internal calibrators, samples and QCs were centrifuged for 10 min at 4000 g. Calibrators, samples and QCs were added to the plate and covered with sealing tape. Reagents, samples and calibrators were run in the HD-1 Analyzer using a 4×dilution for the samples.
Assay for glial fibrillary acidic protein (GFAp)
The analyses were performed using the Simoa® GFAP* Discovery Kit from Quanterix (item no. 102336) according to the following protocol: the samples, QCs and calibrator stock were removed from storage and allowed to thaw. The reagents were prepared according to Quanterix insert and the beads were washed and diluted according to the same insert. RGP reagent was shaken for 30 min at 800 rpm and heated to 30°C. The calibrators, samples and QCs were vortexed for 30 s at 2000 rpm. Then, the samples and QCs were centrifuged for 10 min at 4000 g. The vial containing the beads was vortexed for 30 sec and the other reagent vials were turned upside down 5 times. The calibrator was diluted in a 3-fold serial dilution from 1000 pg/mL (highest point) down to 1.37 pg/mL. Calibrators, samples and QCs were added to the plate. Reagents, samples and calibrators were run in the HD-1 Analyzer using a 4× dilution for the samples and QCs.
Assay for t-tau and Aβ42
The analyses were performed using the Simoa® Neurology 3-Plex A Kit from Quanterix (item no. 101995) according to the following protocol: the samples, QCs and calibrator stock were removed from storage and allowed to thaw. The samples and QCs were vortexed for 30 s at 2000 rpm. Then, the samples and QCs were centrifuged for 10 min at 4000 g. The calibrator vials were vortexed for 30 sec at 2000 rpm and added to the plate. The bead vial was vortexed for 30 sec prior to run. The samples and QCs were added to the plate and the plate was sealed with sealing tape. Reagents, samples and calibrators were run in the HD-1 Analyzer using a 4× dilution for the samples and CQs.
Assay for p-tau
The analyses were performed using the Simoa™ pTau-231 Advantage Kit from Quanterix (item no. 102292) according to the following protocol: the samples and QCs were removed from storage and allowed to thaw. The reagents were prepared according to Quanterix insert and the beads were washed and diluted according to the same insert. The calibrator stock was removed from freezer and allowed to thaw. The calibrators, samples and QCs were vortexed for 30 s at 2000 rpm. Then, the samples and QCs were centrifuged for 10 min at 4000 g. The calibrator was diluted in a 3-fold serial dilution from 500 pg/mL (highest point) down to 2.06 pg/mL. The samples and QCs were added to the plate and the plate was closed with sealing tape. Reagents, samples and calibrators were run in the HD-1 Analyzer using a 4× dilution for the samples and QCs.
Statistical analyses
For statistical analyses, GraphPad Prism 8.1.0 and Stata/IC 15.1 were used. Since biomarker values did not follow a normal distribution, non-parametric tests were used. Differences among groups were evaluated using a Kruskal-Wallis test with multiple comparisons, contrasting the mean rank of each group to the mean rank of the PD group and controlling for false discovery rates using the Benjamini method. Statistical significance was set at p≤0.05.
RESULTS
Development of Simoa α-syn PF assay
The assay, including antibody pair rec38FII/F-11, was optimized according to the scheme outlined in Fig. 1 The optimization stages include, in first place, the selection of calibrator and antibody pairs. The second step is to conjugate paramagnetic beads with the selected antibody (rec38FII) and biotinylate the detection antibody (F-11). Third, perform tests in either 2-step or 3-step protocol to determine which setting gives the highest signal. The next steps are to optimize assay buffers, titrate detector and SBG concentrations. The final stages include adding helper beads (empty beads that are added to improve the bead fill), increase incubation times and sample volume. Once these steps have been completed, and if the optimal conditions haven’t been achieved, an adjustment of the antibody:EDC ratio and biotin excess can be done.
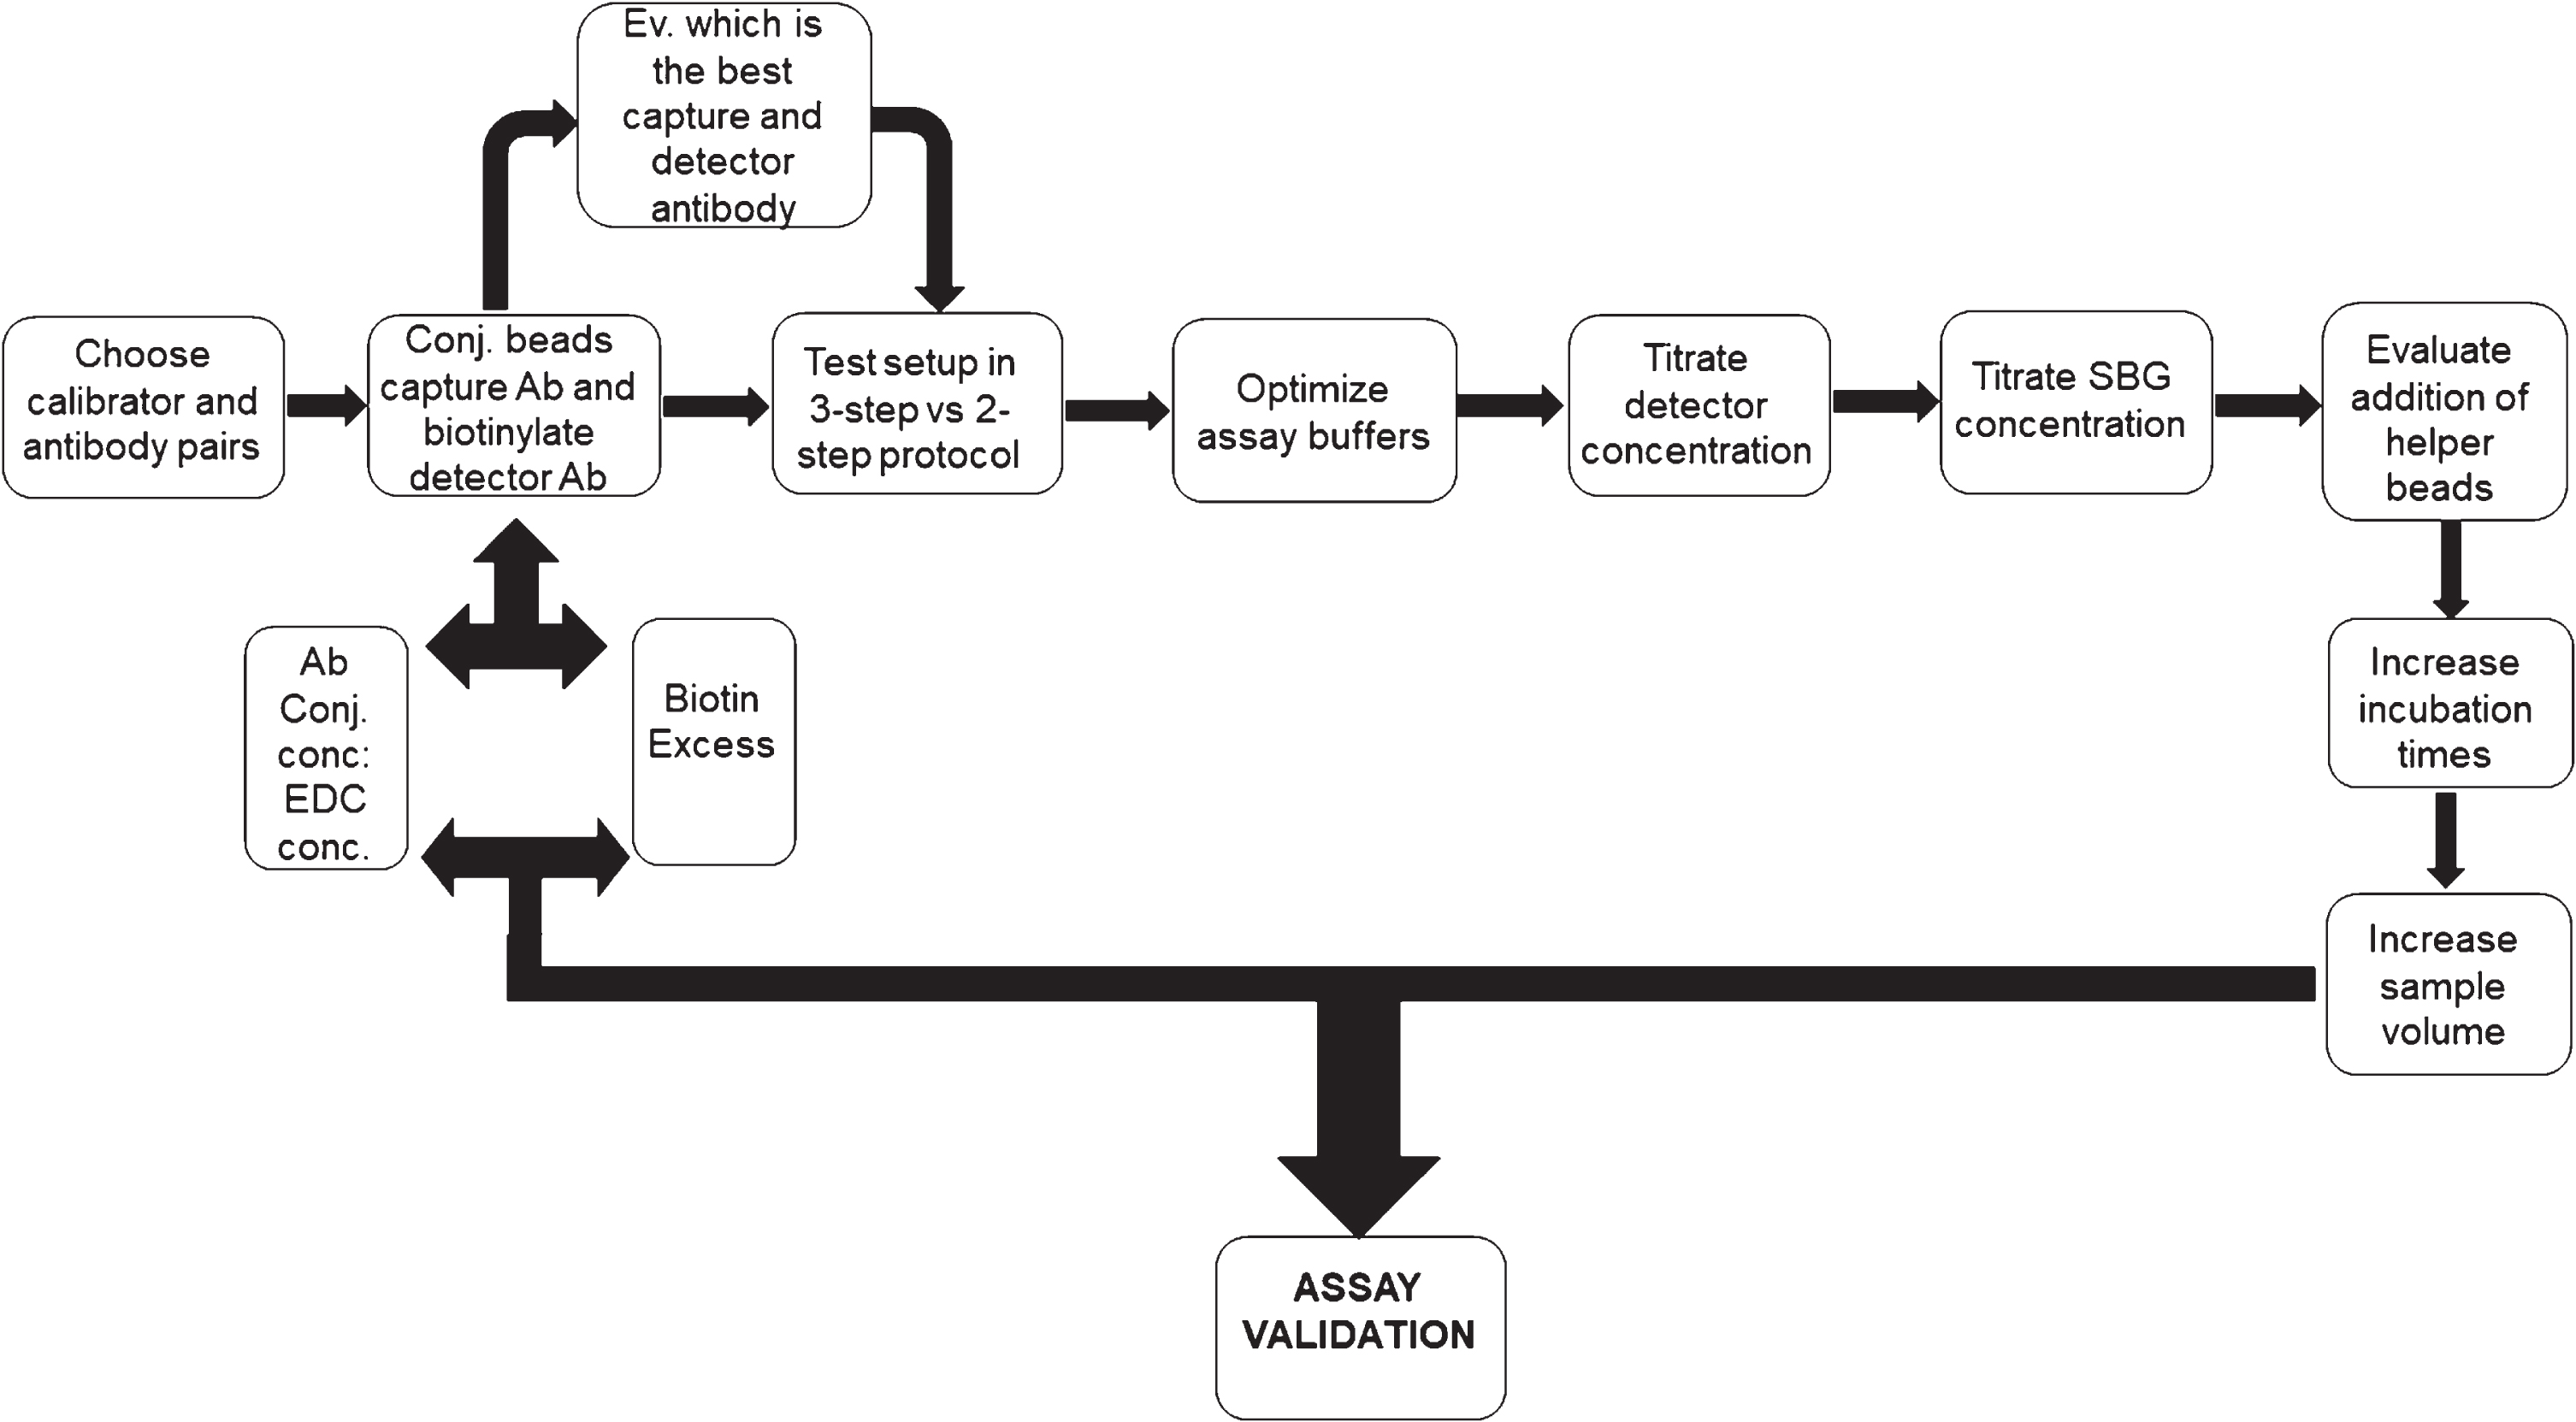
Schematic representation of the steps followed during the development of the Simoa assay. SBG, Streptavidin β-galactosidase; EDC, 1-ethyl-3-(3 dimethylaminopropyl)carbodiimide hydrochloride.
After all the optimization steps were covered, the final assay conditions were selected (Table 2).
Assay conditions for rec38F/F-11 Simoa PF assay. SBG, Streptavidin β-galactosidase; EDC, 1-ethyl-3-(3 dimethylaminopropyl)carbodiimide hydrochloride
α-Syn PF assay validation
The theoretical LOD value, determined taking 2.5 SD above the blank, was 0.65 pg/mL The concentration that corresponded to the LLOQ (10 SD above the blank) was 1.89 pg/mL. The upper limit of the curve was set to the highest calibrator point (3500 pg/mL).
After running a numerous amount of native CSF samples, we found that the actual value for LLOQ corresponded to 6 pg/mL with an LOD of 1.9 pg/mL. These numbers were obtained by introducing the signals from the native CSF samples and calibrator into a simulating software (SIMOA_4PL_Assay Developer Tool_February2018.xlsx, Quanterix, USA). For specific data, refer to Supplementary Figure 1.
The specificity for α-syn aggregates was tested by cross-reactivity tests to monomeric α-, β- and γ-syn. Peptide concentrations up to 3500 pg/mL were tested and did not result in detectable concentrations, confirming the specificity of the assay for α-syn PF (Fig. 2). Moreover, a CSF sample was spiked with 2, 20, and 200 ng/mL α-syn monomers and analyzed resulting in cross-reactivity of less than 0.006% for the highest spiking concentration.
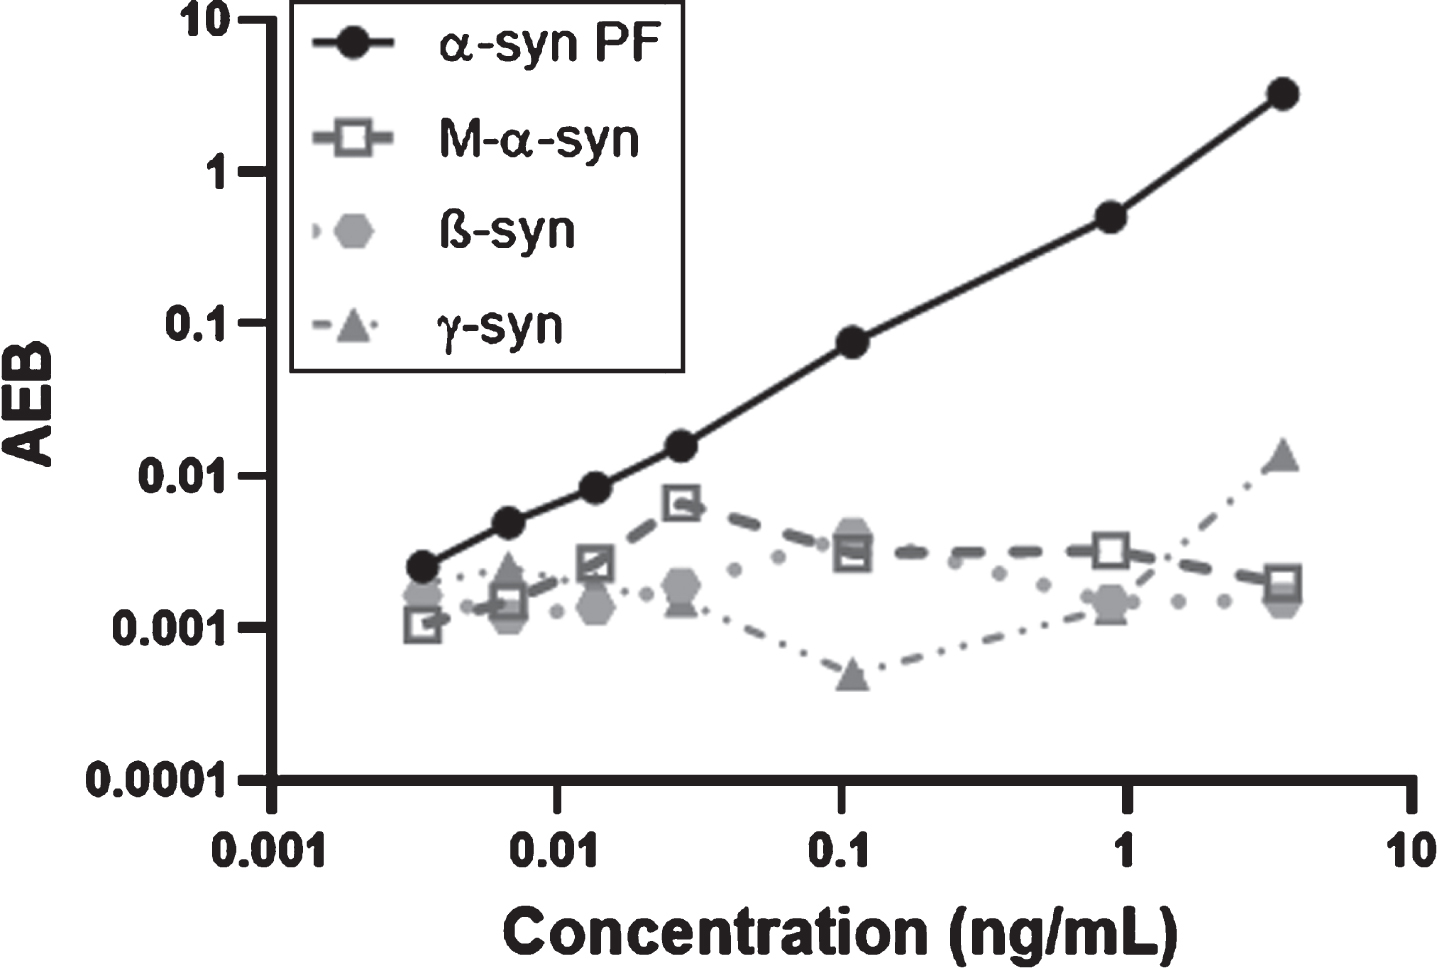
Specificity test of the assay. Cross-reactivity to monomeric α-, β-, and γ-syn was assessed in concentrations up to 3,500 pg/mL (0, 3.4, 6.8, 13.7, 27.3, 109, 875, and 3,500 pg/mL). α-syn PF, α-synuclein protofiblis (calibrator); M-α-syn, monomeric α-synuclein; β-syn, β-synuclein; γ-syn, γ-synuclein; AEB, average enzyme per bead. The axes are in logarithmic scale.
To confirm that the signal derives from endogenous CSF α-syn PF, two representative human PD CSF samples were immunodepleted using a cocktail of anti-α-syn antibodies (Syn-1, rec38FII, MJFR14 and FL-140) and the supernatants from the depleted CSF samples were subjected to Simoa analysis along-side the non-depleted input CSF samples. The CSF α-syn PF levels were reduced to below LLOQ (6 pg/mL), suggesting a reduction of more than 80%. As a control for non-specific bead reduction non-antibody coated beads were used (protein A/G) and the signals obtained were similar to non-depleted CSF (Fig. 3).
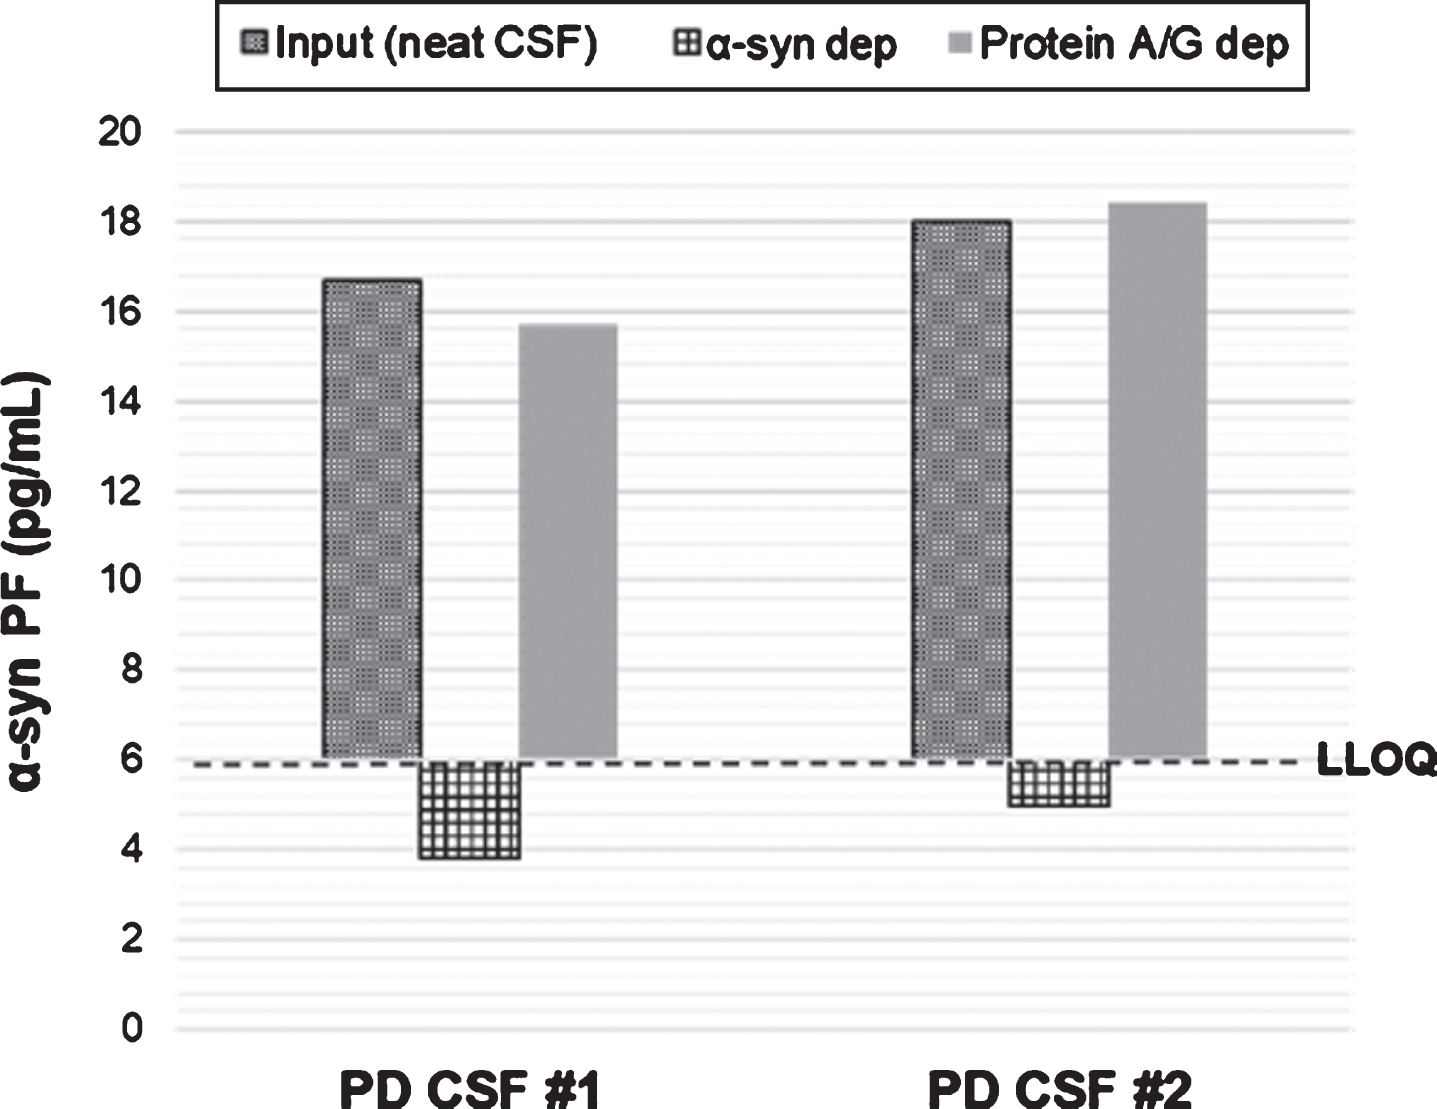
Immunodepletion of PD CSF samples with anti-α-syn antibodies. Two CSF samples were immunoprecipitated using anti-α-syn antibodies and the supernatants from the depleted CSF samples were subjected to Simoa analysis along-side the non-depleted (input) CSF samples. As control for non-specific bead reduction non-antibody coated beads were used (protein A/G beads). α-syn PF, α-synuclein protofibrils; α-syn dep, α-synuclein depletion; Protein A/G dep, protein A/G depletion. LLOQ, lower level of quantification.
Precision and accuracy of the assay was determined using buffer spiked with recombinant α-syn PF (QC1 = 3.7 pg/mL, QC2 = 14.3 pg/mL, QC3 =27.8 pg/mL) and three individual human CSF samples (CSF1, CSF2, CSF3). Overall, the intra-assay precision for QC samples and CSF samples was good, with CV values ranging between 3.9– 9.4% and 8.8– 17.2%, respectively. The intermediate precision (CVrw) was within the accepted range for the QC samples with a mean CV of 11.7% (10.2– 13.0%). However, for the CSF samples, the mean CV ranged between 23.4– 34.4%. Table 3 presents the precision and accuracy of the method for QC samples and human CSF.
Precision and accuracy for CSF and QC samples. Repeatability (CVr): Variation between duplicates; Intermediate presicion (CVRw): Variation between runs
Spike recovery of CSF samples compared with buffer spiked with 7, 70, and 700 pg/mL of α-syn PF
Parallelism was assessed using four individual CSF samples with varying concentrations of endogenous α-syn PF levels. CSF samples were serially diluted 1:2, 1:4, 1:8, 1:16 and 1:32. Parallelism was evaluated by determining the mean adjusted concentrations and precision at≤20% as an indication of parallelism. In three out of four CSF samples analyzed, parallelism was within accepted criteria for dilutions 2-fold from neat. For the higher dilutions, the endogenous signals measured were below assay LLOQ. These data suggest that CSF can be analyzed undiluted.
To test for dilution linearity, three human CSF samples and buffer were spiked with 700 pg/mL of α-syn PF and serially diluted 1:2, 1:4, 1:8, 1:16, and 1:32. The interpolated value was multiplied by the dilution factor to obtain the initial α-syn PF concentration. Results showed that the CSF samples did not follow linearity. However, the buffer spiked with α-syn PF did follow linearity for all the dilutions (Fig. 4).
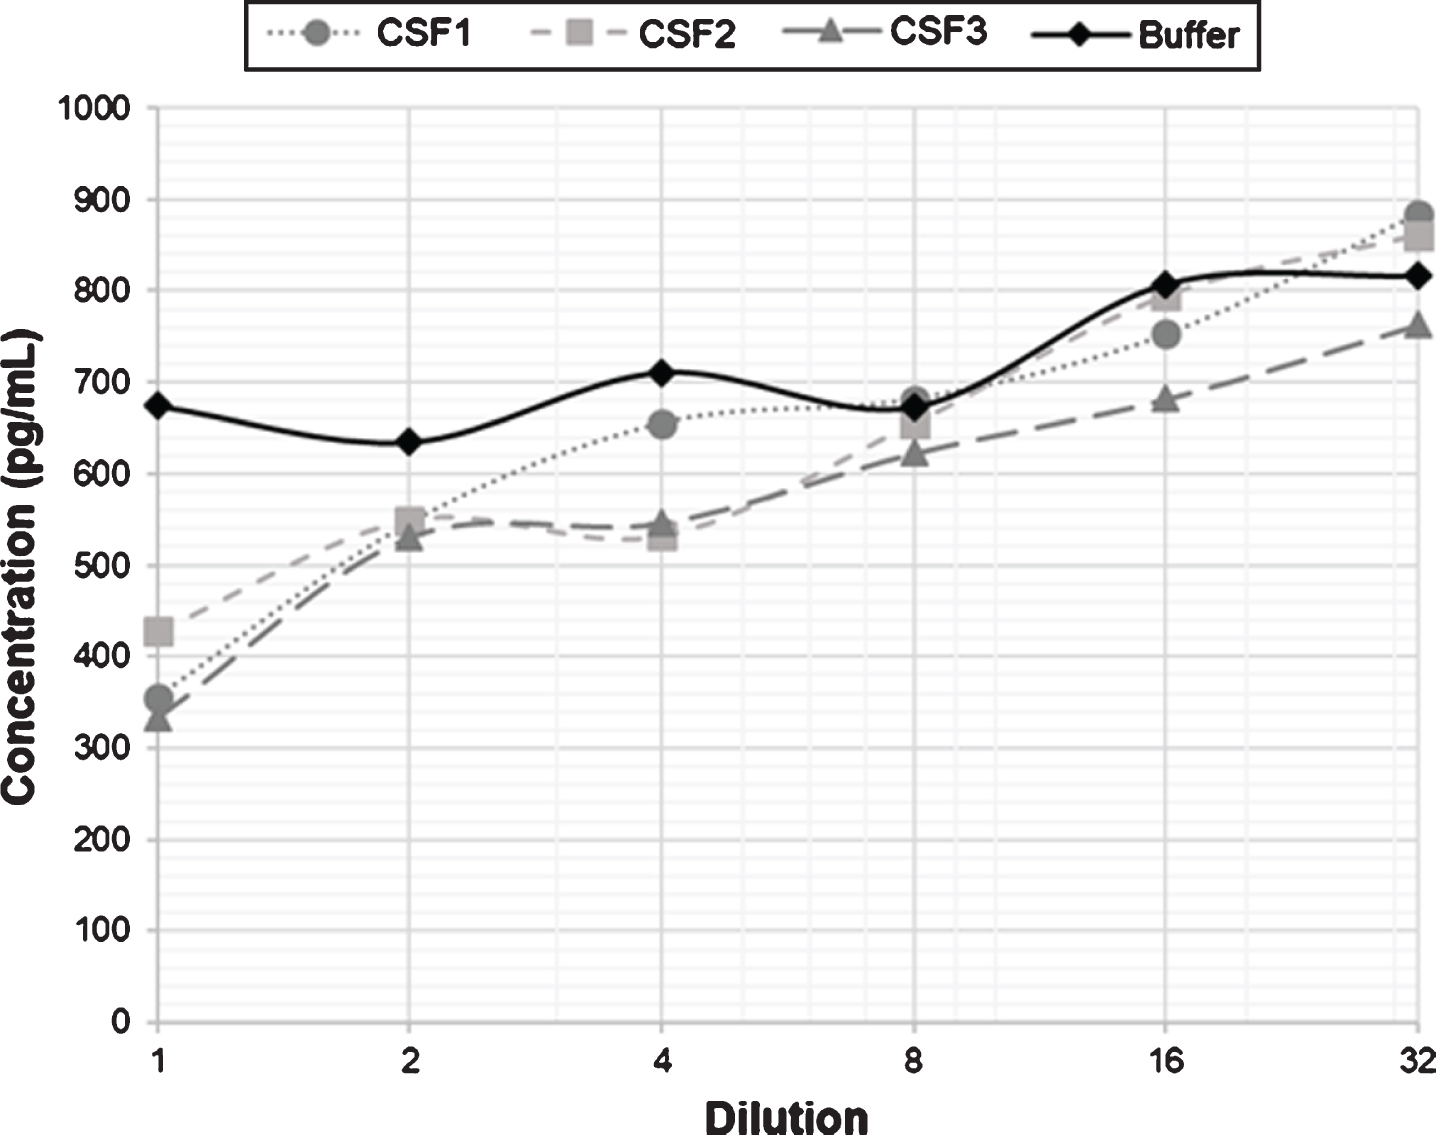
Dilution linearity of serially diluted CSF samples after spiking with a high concentration of α-syn PF. The graph shows the linearity of three CSF samples spiked with 700 pg/mL α-syn PF compared with a buffer solution spiked with the same amount of PF. 1: Spiked undiluted sample.
α-Syn concentrations were measured in two CSF samples and buffer spiked with 7 pg/mL, 70 pg/mL and 700 pg/mL α-syn PF. The concentration of the spiked samples and the endogenous concentration of the CSF samples were measured simultaneously. After subtraction of the endogenous α-syn concentration, the mean recovery was estimated to 71.4% (36.6– 95.3%) for the 7 pg/mL spike, to 79.1% (62.1– 96.4%) for the 70 pg/mL spike and 72.3% (50.7– 104.2%) for the 700 pg/mL spike. The spike recovery in CSF was lower compared to buffer, as shown in Table 4.
To evaluate the effect that storage conditions can have on the α-syn PF concentration, ten fresh CSF samples were stored at either – 80°C or – 20°C for two months. We show that the concentration of the CSF samples is generally higher at – 20°C suggesting that this freezing condition could be inducing the aggregation of α-syn, thus increasing the concentration of α-syn PF.
Detection of α-syn PF levels in clinical cohorts
Having established that the rec38FII/F-11 Simoa PF assay is highly specific and can detect endogenous levels in most CSF samples, an evaluation of the diagnostic and prognostic value in a clinical cohort from the Sahlgrenska University Hospital was assessed. This cohort comprised samples from patients with PD, CBD and PSP. The control samples came from patients who had visited the memory clinic but had no biomarker signs of AD (tau<350 pg/mL, Aβ42 > 530 pg/mL and p-tau<60 pg/mL). The CSF α-syn PF levels had concentration values between 6 and 208 pg/mL, with only 2 samples below the assay LLOQ of 6 pg/mL. In this cohort, we could find significant differences between the PD and CBD group (p = 0.02) and the PD and CT group (p = 0.03) for α-syn PF (Fig. 6a). For total α-syn, we could see significant differences between the PD and CBD group (p = 0.04) (Fig. 6b). Finally, the ratio between α-syn PF and total α-syn gave significant differences for the PD and CT group (p = 0.01) (Fig. 6c).
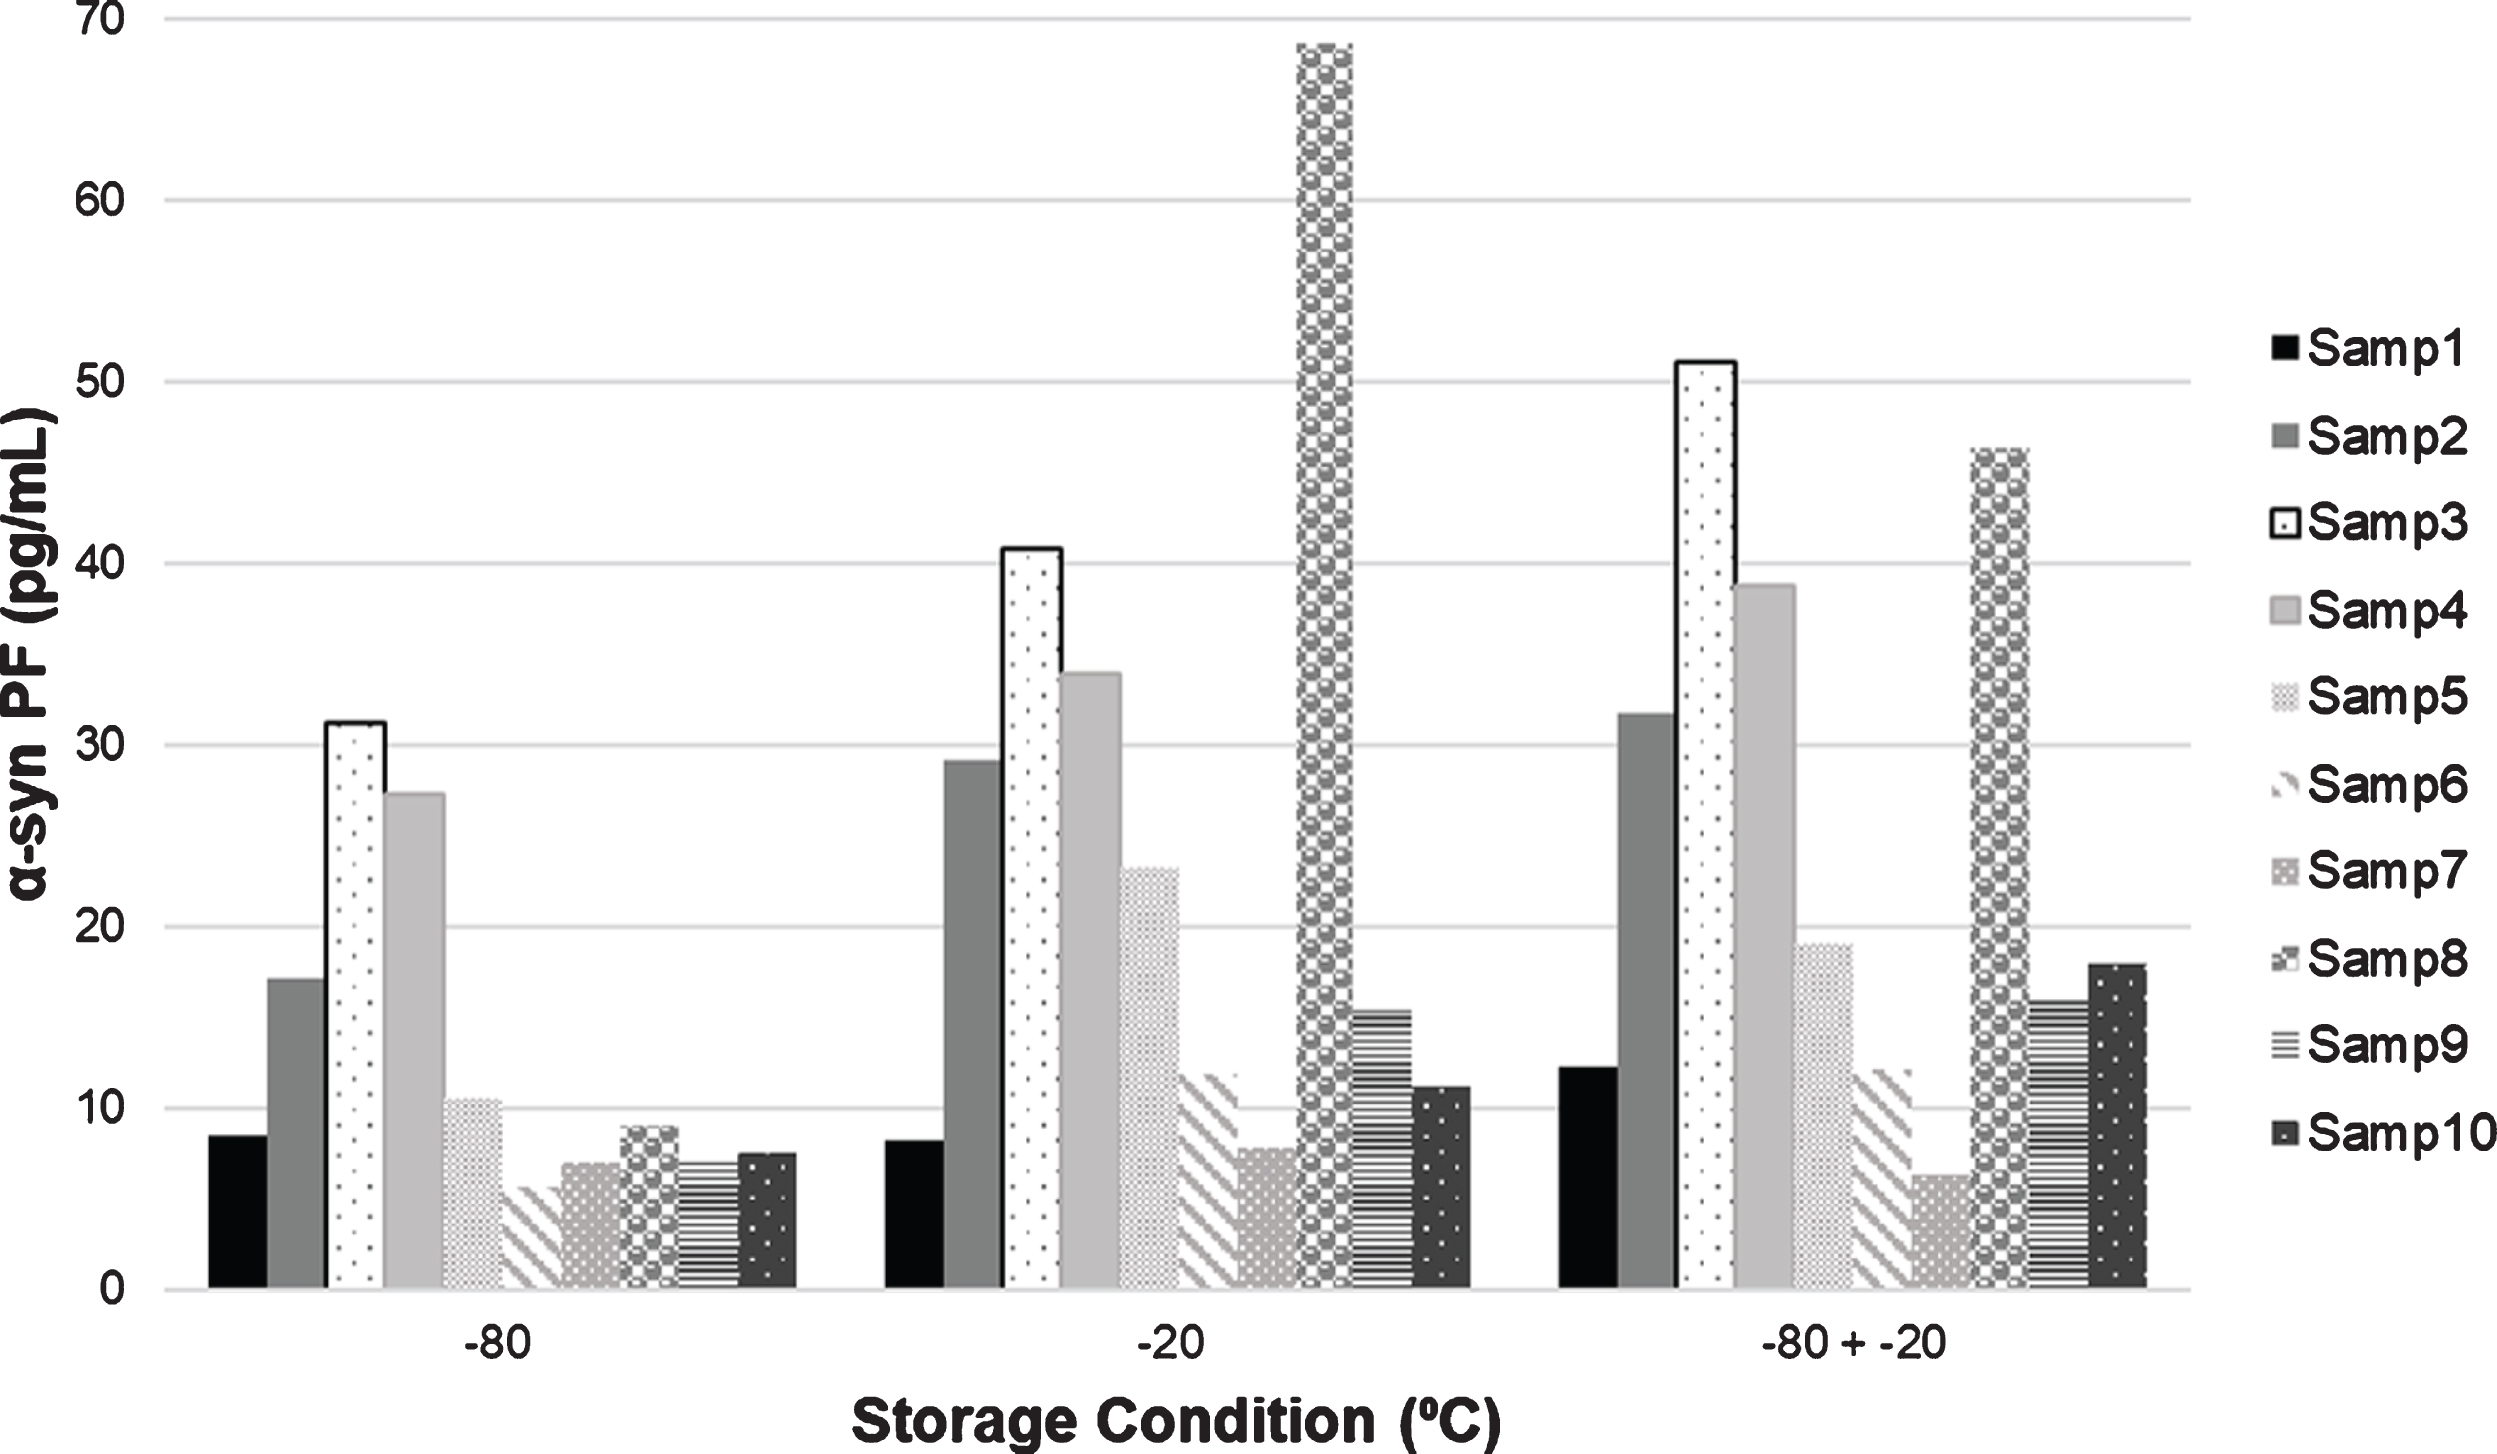
Graph showing the α-syn PF concentration at different storage conditions. α-syn PF, α-synuclein protofibrils; Samp#, sample number.
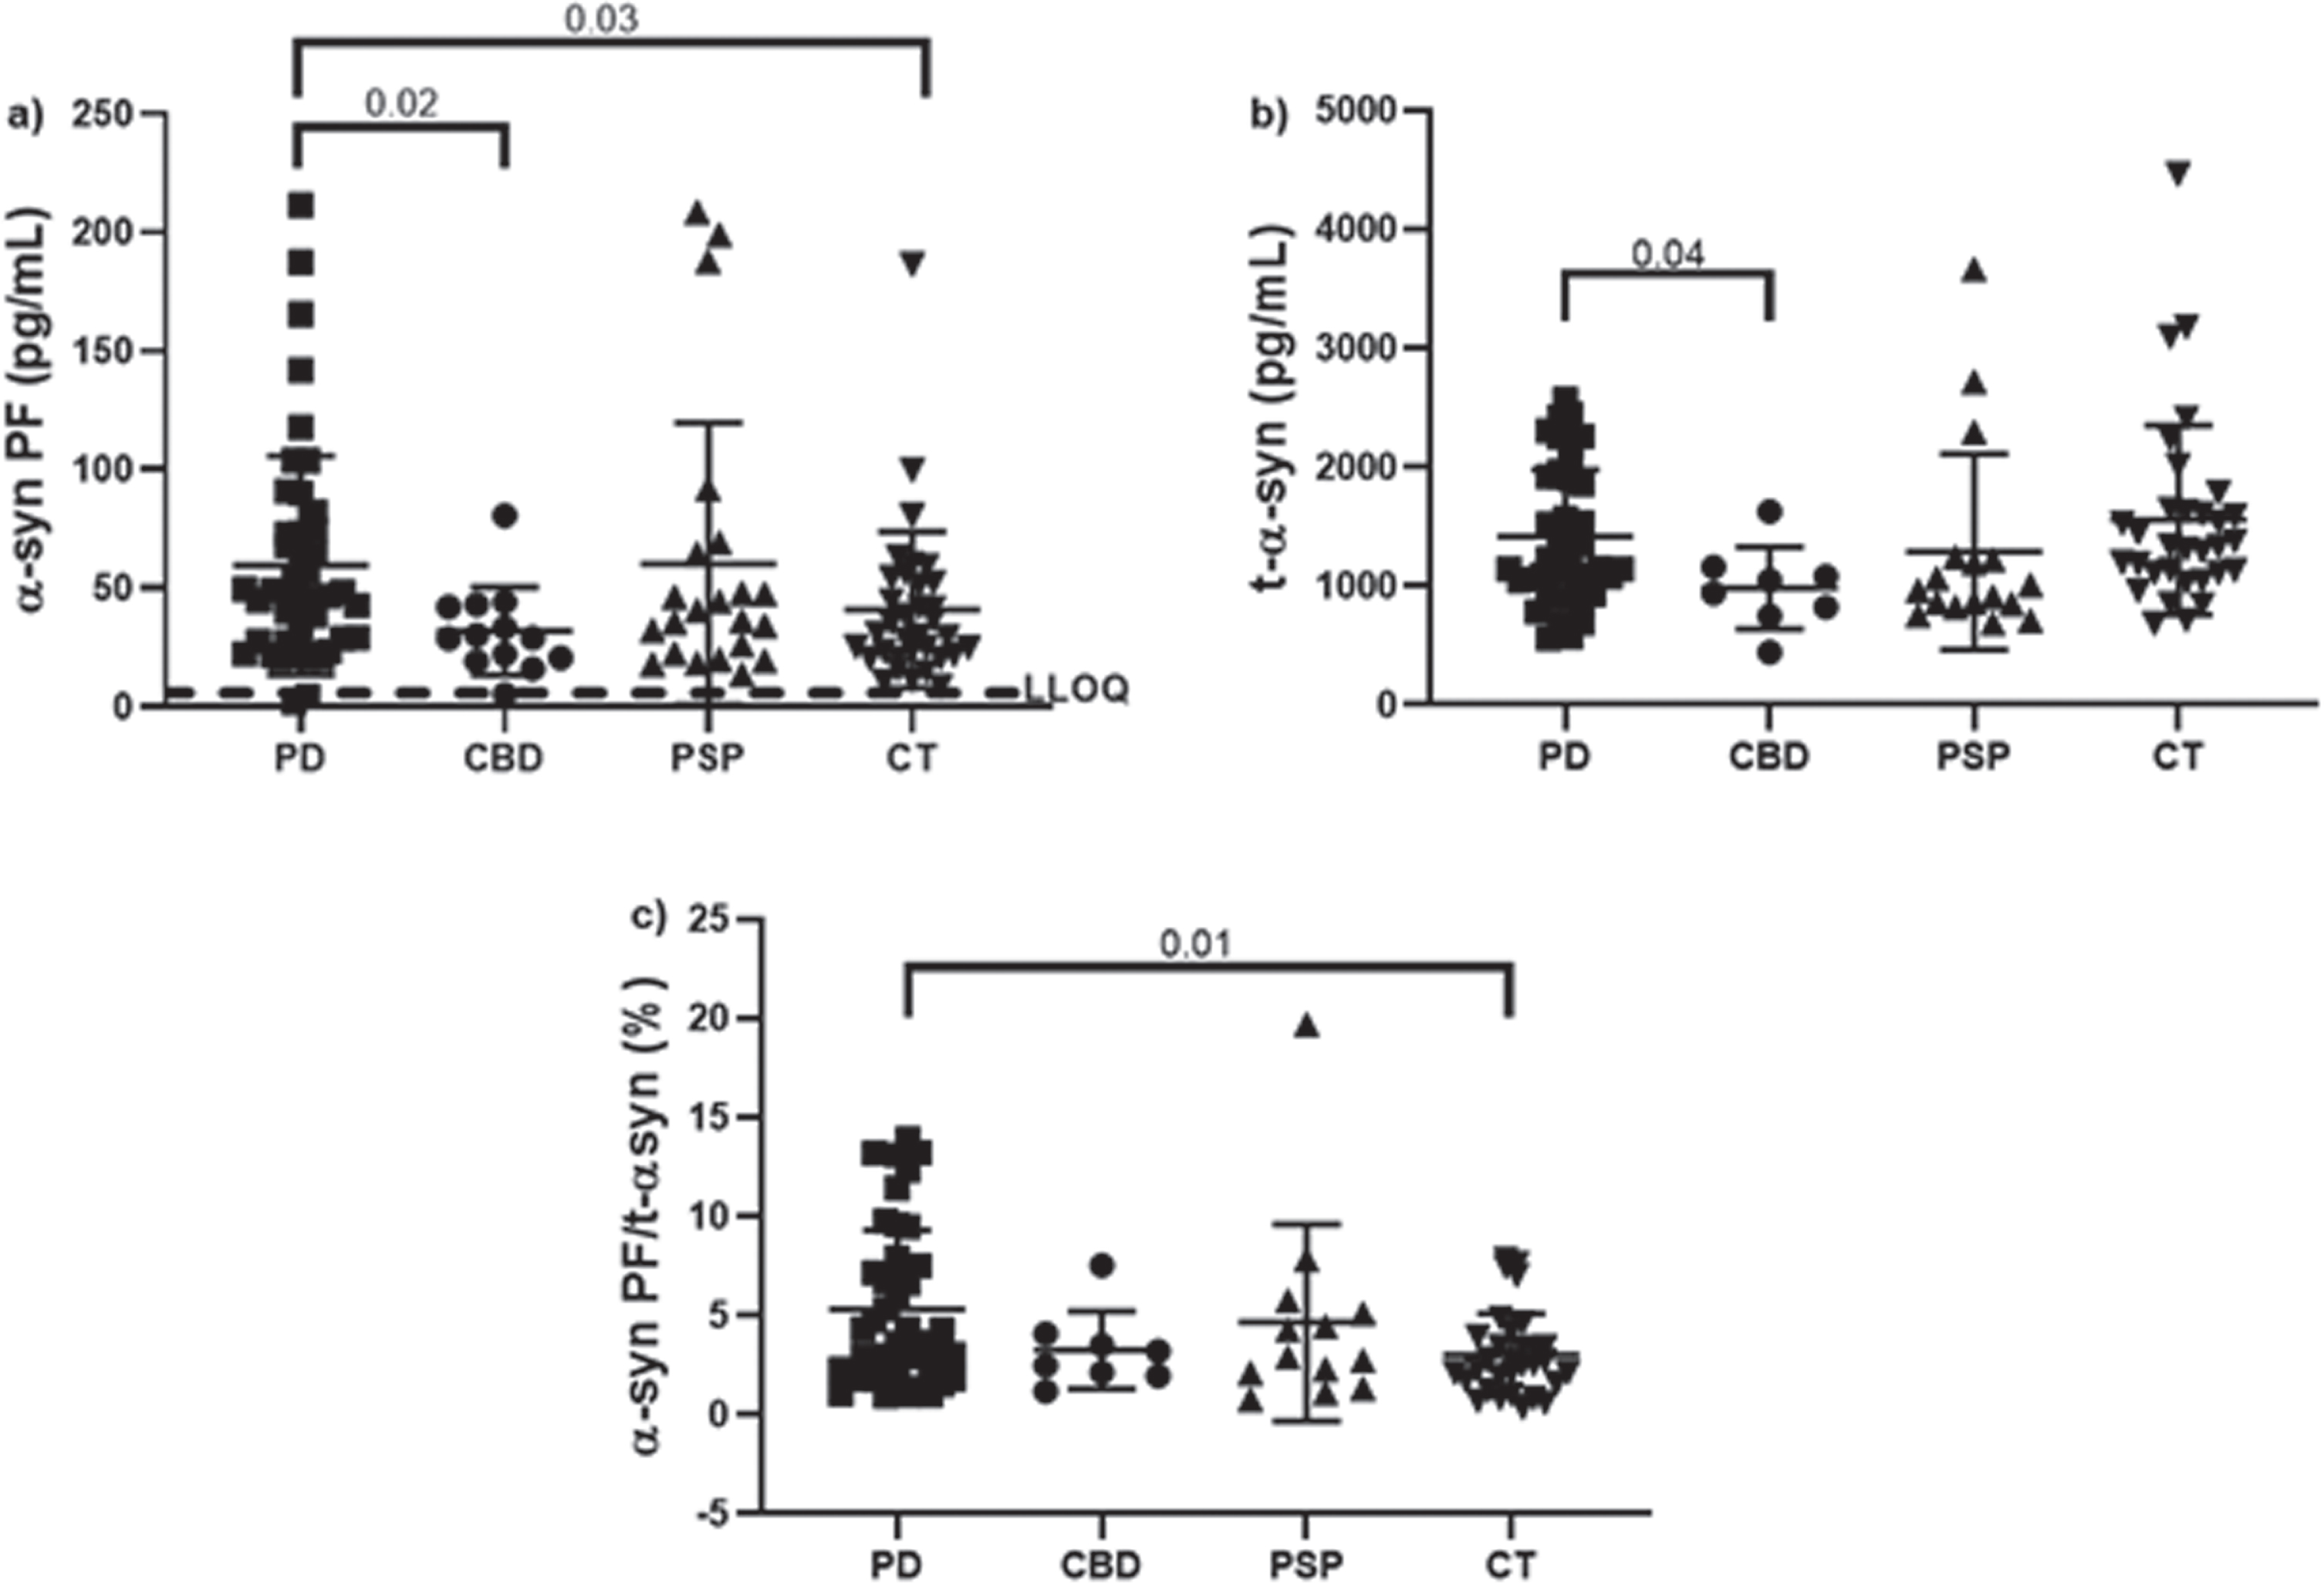
CSF α-syn concentrations in normal and different neurological disease subjects from the Sahlgrenska University Hospital cohort analyzed neat in duplicates. a) Levels of α-syn PF. b) Concentrations of total α-syn. c) Ratios between α-syn PF and total α-syn. Bars indicate mean with SD. Dashed line represents the lower limit of quantification (LLOQ) for the assay (6 pg/mL). Samples below the LOD and samples with CV > 20% were removed from the graph. PD (Parkinson's disease) n = 49; CBD (corticobasal degeneration) n = 12; PSP (progressive supranuclear palsy) n = 22; CT (control group, age- and gender-matched to the PD group) n = 33. Statistical significance was achieved using a Kruskal-Wallis test with multiple comparisons contrasting the mean rank of each group to the mean rank of the PD group and controlling for false discovery rates using the Benjamini method.
Additional statistical analyses on this cohort showed differences among groups for several markers, including t-tau, Aβ42, p-tau, NFL and GFAp. In general, the PD group showed lower concentrations of t-tau, p-tau, NFL and GFAp compared to the rest of the groups (Table 5).
Properties of the Sahlgrenska University Hospital cohort including levels of several markers for neurodegeneration. t-α-syn, total α-synuclein; α-syn PF, α-synuclein protofibrils; α-syn PF/t-α-syn, ratio between protofibrilar and total α-synuclein; t-tau, total tau; p-tau, phosphorylated tau; Aβ1–42, amyloid-beta 1– 42; NFL, neurofilament light; GFAp, glial fibrillary acidic protein. Statistical significance was achieved using a Kruskal-Wallis test with multiple comparisons contrasting the mean rank of each group to the mean rank of the PD group and controlling for false discovery rates using the Benjamini method
¶Compared to PD, p = 0.04; §Compared to PD, p = 0.02; °Compared to PD, p = 0.03; ‡Compared to PD, p = 0.01; #Compared to PD, p < 0.0001; &Compared to PD, p < 0.0001; *Compared to PD, p < 0.0001; £Compared to PD, p = 0.0297; ££Compared to PD, p < 0.0001; †Compared to PD, p = 0.0357.
DISCUSSION
In this study, we used the Simoa technology to develop a method capable of quantifying α-syn PF levels in CSF and applied on a clinical cohort of patients with PD and atypical parkinsonian disorders. We show that the assay is specific to α-syn PF and has no cross-reactivity with monomeric α-syn or to β-syn and γ-syn. Several groups have reported an increase in oligomeric α-syn in CSF of patients with PD [20–22, 41]; however, these groups report the increase measured in absorbance or relative luminescence units (RLU). To our knowledge, we are one of the first groups to report levels of α-syn PF in concentration units (pg/mL). After thorough optimization of the assay (where introducing a wash step of beads prior to analyses improved the performance), we show that the concentration of α-syn PF is increased in patients with PD compared with controls and CBD patients. We also show that our method can discriminate with relatively high accuracy between PD and non-PD subjects.
Although studies have been published indicating CSF α-syn oligomers as potential diagnostic biomarkers, these findings have not yet been clinically validated. We have done a complete method validation to elucidate the efficacy of α-syn PF as potential biomarkers for the diagnosis of PD. We show that the method has repeatability within the accepted range (below 15% CV) and that CSF samples can be analyzed in a 2-fold dilution from neat. We show that the intermediate precision for the CSF samples is 28.6% CV, which indicates that it is not optimal to run a study on different days. When recombinant PF were spiked into CSF samples, they do not follow linearity. However, when PF were spiked into the buffer, they follow linearity, suggesting a possible matrix effect in the CSF samples. Another explanation could be that the spiked PF are very different from endogenous α-syn aggregates present in human CSF samples, thereby explaining the lack of linearity when diluting. Additional confirmation of a possible matrix effect in the CSF samples is that the spike recovery is lower compared to spiked buffer samples. These findings highlight the challenge of measuring aggregated forms of α-syn in CSF of humans.
Previous studies have failed to report limits of detection and quantification of the methods probably due to the very low levels of the protein aggregates in human CSF and/or to the lack of sensitivity of the assays. Using the Simoa technology, we were able to establish an LLOQ for the assay of 6 pg/mL and show that all CSF samples are quantifiable and above this limit. Another advantage of our assay is that we used a biotinylated detection antibody with an N-terminal epitope in combination with a capture antibody with a C-terminal epitope that has a very high specificity and affinity for α-syn PF and does not measure the monomeric form of the protein. This setup increases the probability of the detection antibody to bind to the analyte since there is no competition for the same binding site. Recently, Sehlin et al. confirmed that heterophilic antibodies (HA) present in human body fluids (that recognize antibodies from other species) might crosslink the capture antibody to the detection antibody and lead to false-positive signals in oligomer ELISA assay [42]. To avoid this, we added an HA blocker to the beads in a concentration of 10μg/mL.
A very important finding we made is that storage conditions can have a major impact on the concentration and/or stability of α-syn PF. Several publications have described that freezing biological fluids could affect protein stability and induce aggregation [43–45]. Therefore, thorough care must be taken when storing the samples avoiding thaw and freeze cycles and, if possible, blast freezing the samples prior to storage (to remove ice crystals that could affect the stability of the protein).
Having established that the rec38FII/F-11 Simoa PF assay is highly specific and can detect endogenous levels in most CSF samples, we assessed the diagnostic and prognostic value in a clinical cohort. We show that there are significant differences between PD patients, controls, and CBD patients. By washing the beads before running the samples, we were able to get rid of the floating un-bound capture antibody that could be binding to the detector antibody and possibly avoiding false-positive signals.
Recently, two studies showed that the aggregated species of α-syn could be measured in CSF with a sensitivity of 93% and specificity of 100% [27] and 92% sensitivity and 95% specificity [26] using the RT-QuIC technique. This method is able to discriminate between α-synucleinopathies and non-α-synucleinopathies. Our method has a sensitivity of 62.8% and specificity of 67.7% for predicting PD using α-syn PF (Supplementary Figure 2). Numerous studies have been published evaluating monomeric α-syn as a potential diagnostic biomarker and most studies point towards an overall decrease of α-syn in CSF [17–19]. We show that there is a trend to a decrease in the concentration of total monomeric α-syn in CSF of patients with PD. We also observed an increase in the ratio between α-syn PF and total α-syn for the PD group compared with controls. This increase could be explained by the higher levels of α-syn PF observed in PD patients due to pathogenic mechanisms. In physiological conditions, there is a balance between momomeric α-syn and α-syn PF. However, in patients with PD the throughput of α-syn is distorted, leading to the accumulation of α-syn PF [46]. Therefore, this could be a meaningful and useful biological parameter for discriminating between PD and controls, as described in several studies [21, 47]. Mollenhauer et al. have reported a decrease in Aβ42 levels for patients with PD compared with controls [48]. This is confirmed in our study, where there is a significant decrease in the concentration of Aβ42 in the PD group. We report that the levels of t-tau and p-tau are significantly lower for the PD group compared with the control group. This finding has previously been reported by Hall et al. [49]. Several publications have reported that there are no significant differences in the levels of NFL in CSF between controls and PD [49–51]. However, we see that the control group has significantly higher levels of NFL than the PD group. An explanation for this could be that there is a very large spreading in the control group with individuals having very low levels of NFL and others having very high levels of the protein which affects the mean value. It could be that the individuals with high levels of NFL might have an underlying pathology (different from AD) that is reflected in the increase in NFL.
In conclusion, in this study, we developed and validated a novel immunoassay that can quantify soluble α-syn PF in human CSF. Analytically, the assay is both sensitive and specific. The developed method quantifies α-syn PF in human CSF and CSF α-syn PF concentrations are increased in PD, but with an overlap with asymptomatic elderly controls. However, further studies including non-related neurological disorders and other synucleinopathies, are needed to fully validate the use of α-syn PF as a diagnostic biomarker.
Limitations and future perspectives
One important limitation of this study is the lack of pathological confirmation for the different disease phenotypes. Using clinical criteria for assignment of disease and control status could lead to an overlap among the groups with some outliers, as we see in this study. For instance, the presence of the three outliers in the PSP group for α-syn PF may reflect a contamination with PD cases. Additionally, the higher concentrations of NFL observed in the control group may indicate presence of neuropathology that had not yet manifested clinically. This overlap among the groups could make it difficult to provide a definitive statement about the implementation of the assay in clinical routine. However, the results presented here provide us with an indication that α-syn PF could be used as biomarkers for diagnosis of PD. Additional autopsy-confirmed studies including multiple systems atrophy, dementia with lewy bodies, Parkinson's disease dementia, and other neurological disorders like AD, as well as a correlation with additional biomarkers with a certain degree of sensitivity and specificity for discriminating synucleinopathies from tauopathies (such as α-syn RT-QuIC or PMCA) are needed to fully validate the use of α-syn PF as a diagnostic biomarker.
CONFLICT OF INTERESTS
The authors Linda Söderberg, Johanna Fälting and Christer Möller are employees at BioArctic AB and Marco Giorgetti is employee at AbbVie. Kaj Blennow is supported by the Swedish Research Council (#2017-00915), the Alzheimer Drug Discovery Foundation (ADDF), USA (#RDAPB-201809-2016615), the Swedish Alzheimer Foundation (#AF-742881), Hjärnfonden, Sweden (#FO2017-0243), the Swedish state under the agreement between the Swedish government and the County Councils, the ALF-agreement (#ALFGBG-715986), and European Union Joint Program for Neurodegenerative Disorders (JPND2019-466-236).
Footnotes
ACKNOWLEDGMENTS
We thank BioArctic AB and AbbVie Inc. for providing the calibrators and antibodies for the study. We thank Victor Liman for his invaluable assistance during the Simoa analyses. The project was funded by BioArctic AB. Marianne von Euler Chelpin was awarded a grant from Åhlén-Stiftelsen (mA27/h17). Kaj Blennow has served as a consultant, at advisory boards, or at data monitoring committees for Abcam, Axon, Biogen, Julius Clinical, Lilly, MagQu, Novartis and Roche Diagnostics, and is a co-founder of Brain Biomarker Solutions in Gothenburg AB (BBS), which is a part of the GU Ventures Incubator Program, all unrelated to the work presented in this paper.