
Abstract
Background:
α-Synuclein (α-syn) is a major component of Lewy bodies, a pathologic marker of Parkinson’s disease (PD) in post-mortem studies. The use of α-syn as a practical PD biomarker has been investigated by numerous researchers. However, reports of differences in α-syn levels in biofluids, such as cerebrospinal fluid, plasma, and saliva, between PD patients and controls are inconsistent. Recently, the measurement of α-syn oligomer levels has emerged as a novel approach to diagnose PD.
Objective:
Lysates and culture media from two different types of dopaminergic neuronal cells or urine samples from 11 non-PD and 21 PD patients were collected and analyzed.
Methods:
We developed and performed an enzyme-linked immuno-absorbent assay (ELISA) to detect various oligomeric α-syn using distinct pairs of antibodies.
Results:
We validated our ELISA using rotenone-induced alterations of α-syn levels in human dopaminergic neurons. Total urinary α-syn levels, measured using our ELISA method, showed no difference between PD and non-PD individuals, but a higher level of α-syn oligomer recognized by MJFR-14-6-5-2 in PD urine samples was observed. Levels of distinct oligomeric α-syn detected by ASyO5 were lower in PD urine samples. Three different α-syn ELISA results were analyzed with respect to the severity of PD, but only the correlation between total α-syn levels and PD index was significant.
Conclusion:
Our findings suggest that detection of distinct oligomeric formations of α-syn and measurement of their levels in urine might be feasible for use in PD diagnostics.
Keywords
INTRODUCTION
The role of α-synuclein (α-syn) in the pathogenesis of Parkinson’s disease (PD) makes it a critical target not only for therapeutics but also for diagnostics [1]. Oligomerization of α-syn is a crucial step in determining its fate, which may play a functional role in its toxicity in dopaminergic neurons in the substantia nigra par compacta [2]. Large α-syn aggregates, such as Lewy bodies and Lewy neurites, accumulate in dopaminergic neurons and could be considered non-toxic in PD pathology [3, 4]. In contrast, intermediates formed during α-syn fibrillation or oligomerization, including curvy thread, halo, and sphere structures, might be responsible for the degeneration of dopaminergic neurons [5]. These different types of oligomers, a cause for the propagation of α-syn pathology, are important in the therapeutic approaches against α-syn [6].
Many research groups have struggled to produce diagnostic tools to analyze α-syn levels in PD patients [7]. Reports regarding the levels of α-syn in the bio fluids of PD patients across numerous studies are conflicting, suggesting that, to ensure its application as a diagnostic tool, measurement of α-syn levels in bio fluids requires consideration of the specific conformation of α-syn [8]. Oligomeric α-syn levels are increased in the cerebrospinal fluid [9], blood plasma [10], and saliva [11] of patients with PD or dementia with Lewy bodies, but the total level is unchanged or even decreased [9–11].
Urine is an excellent human fluid specimen because of the convenient sampling process and the sufficiency of collected volumes[12]. Furthermore, our previous studies revealed differences in exosomal DJ-1 or oxidized DJ-1 levels in a comparative analyses of urine from PD and non-PD patients [13, 14]. Increased γ-synuclein in urine is reported to be a marker of bladder cancer, as γ-synuclein is highly expressed in various tumor tissues [15].
Despite this, no previous studies have reported the presence of α-syn in urine or measured the levels of urinary α-syn [13, 16]. We speculate that the levels of urinary α-syn are too low for detection.
Therefore, we decided to use concentrated urine, instead of urine exosomes,to investigate the presence of α-syn oligomers in urine and compare the levels of α-syn between PD and non-PD patients’ urine. For this purpose, we developed a sandwich α-syn enzyme-linked immuno-absorbent assay (ELISA) for various α-syn oligomers and analyzed the levels of different oligomers of α-syn in concentrated whole urine samples, using a mild detergent.
MATERIALS AND METHODS
Western blot analysis
We loaded samples on to 4–15% gradient gels (#456-1086; Bio-Rad Laboratories, Inc.) and transferred them to nitrocellulose membranes. The primary antibodies used in this study are listed in Table 1. The secondary antibodies used for the detection of primary antibodieswere peroxidase-conjugated AffiniPure Goat Anti-Mouse IgG (H + L) (#115-035-003; Jackson Immunoresearch Laboratories Inc.) and peroxidase-conjugated AffiniPure Goat Anti-Rabbit IgG (H + L) (#111-035-144; Jackson Immunoresearch Laboratories Inc.). To visualize interesting protein bands, we used Luminata Crescendo Western HRP (#WBLUR0500; Merck) and images were acquired using MicroChemi 4.2 (Shimadzu).
Summary of antibodies for ELISA
Generation of standards for the ELISA
Recombinant human α-syn was purchased from Boston Bio (SP-480). To generate fibril standards, α-syn solution (70 μM, 1 mg/ml) was concentrated up to 3 mg/ml and dialyzed with phosphate-buffered saline (PBS).
As a pre-saturation step, the α-syn solution was incubated for one week at 37°C,whilst shaking at 100 rpm. After brief sonication, α-syn was re-incubated for 2 weeks under conditions identical to the pre-saturation conditions. Fibrillar α-syn was isolated following ultra-centrifugation at 100,000g for 1 h at 4°C. The precipitated α-syn fibril was washed with PBS twice, and the pellet was resuspended with PBS at a concentration of 1 mg/ml.
For another oligomeric ELISA standard, α-syn monomer solution (1 mg/ml) was incubated at 4°C for 5 days. The sample was then passed through a 0.2 μm filter to remove fibrillar conformers. The flow-through (FT) was subjected to 100 K filtration using a 100 K filter (100 K Omega Nanosep Centrifugal Devices, OD100C34, Pall), and we collected the retentate (100 K-Cut). The FT of the 100 K underwent 30 K filtration using a 30 K filter (3 K Omega Nanosep Centrifugal Devices, OD030C34, Pall), and the 30 K-FT was collected. The 100 K-Cut fraction was used for the standard of another oligomeric ELISA, and the 30 K-FT was used to verify its capacity as a standard.
Aggregates-trap assay and dot-blot assay
The nitrocellulose membrane was equilibrated with Tris-buffered saline with 0.1% TWEEN-20 (TBST) for 30 min at room temperature. Equivalent samples of each standard for the ELISA were then loaded onto the nitrocellulose membranes using a Dot-Blotter (Bio-Rad Laboratories, Inc.). For the detection of oligomeric standards, we used 2 μl of the standard mixtures in equal concentration for each ELISA. After blocking the membranes with 5% skimmed milk, the indicated primary antibodies were used at the same dilution ratio as the respective capture antibodies in the ELISAs. The rest of the steps followed the western blot assay protocol.
Sandwich ELISA
We coated 96-well immunoplates (Corning) with three different capture antibodies at the indicated dilution ratio (Table 1) in 60 μl of sodium bicarbonate buffer (pH 5.0), overnight at 4°C. Super Block T20 (PBS) Blocking Buffer (#37516; Thermo) was used for blocking and it was mixed with PBST (PBS with 0.1% TWEEN-20) to make the dilution buffer used for the standards and samples. Standards or samples of 100 μl were loaded to wells and incubated for 2 h at RT, with shaking at 100 rpm. For detection, we diluted the HRP-conjugated α-synuclein antibody (Table 1) in 100 μl of dilution buffer for 1.5 h at RT, shaking at 100 rpm, and 3, 3′, 5, 5′-tetramethylbenzidine ([TMB], T0440; Sigma) 100 μl was added and allowed to reactfor 5 to 15 min at RT. Then, 2 M HCl 10 μl was used to halt the TMB reaction. Absorbance at 450 nm was measured and used for estimations based on an interpolated standard curve.
Cell culture and rotenone treatment
The human neuroblastoma cell line, SH-SY5Y, was cultured with growth media (DMEM, 10% fetal bovine serum [FBS], and 1% Penicillin/Streptomycin). To differentiate SH-SY5Y to dopaminergic neuronal cells, we cultured SH-SY5Y cells with growth media containing 10 μM all-trans retinoic acid (RA) for 7 days.
Human iDP (induced human dopamine progenitor)-neurons (iDP-neuron) were differentiated from dopaminergic neural progenitors reprogrammed from human skin fibroblasts. The neuronal differentiation protocol has been previously described [17]. We treated both differentiated SH-SY5Y (dSH) and iDP-neurons with 3 μM rotenone (dissolved in DMSO) in growth media for 48 h. We collected the supernatant of the culture media, which was centrifuged to remove cell debris, and the supernatant was concentrated using a 3 K filter (3 K Omega Nanosep Centrifugal Devices, OD003C34, Pall). We also lyzed the cells with PBS containing 1% Triton X-100 (TX-100), Xpert Protease inhibitor cocktail ([PIC], P3100; GenDEPOT) and 5 mM EDTA under ice-cold conditions. Diluted crude lysates or concentrated culture media were loaded onto the ELISA. Estimated α-syn levels obtained from their respective ELISAs were normalized based on the concentration of total protein in the cell lysates. The α-syn levels in the concentrated culture media or diluted lysate were divided by the fold ratio of the concentration.
Urine collection and concentration
This study was approved by the Institutional Review Board of Boramae Hospital, Seoul National University (IRB No. 30-2018-20 and 30-2019-96). All experimental processes were performed in accordance with the relevant guidelines and regulations of the IRB. Urine samples were collected from PD patients as well as non-PD controls at Boramae Hospital (Seoul, Korea) on visits. All PD patients were able to volunteer because our expert neurologist did not recruit PD patients with cognitive decline. Hence, every patient signed the informed consent for themselves. Urine samples were stored at –80°C until use. All PD patients were diagnosed by a neurologist, and their Hoehn and Yahr (H & Y) stage was measured (Table 2).
Summary of clinical samples
We processed urine samples that were mixed with 1% TX-100 and 1X PIC. These were centrifuged (4000g for 30 min at 4°C) to remove debris, then concentrated using a10 K filter (AmiconUltra-4 Centrifugal filters Utracel-10 K, UFC801024, Merck). Each urine sample was subjected to distinct centrifugation protocols at 4°C and was concentrated to 10-fold of the original volume. Ten-fold concentrated urine samples were used in the ELISA, and this was accounted for in the subsequent analysis of α-syn. The serum was used as obtained from the patient.
To verify the presence of α-syn using western blot analysis, urine samples from PD patients were mixed with 1% Triton X-100 and 1X PIC, which was concentrated using a 100 K filter (VIVASPIN TURBO 4, VS04T41, Sartorius). Then, the flow-through underwent further concentration by 10 K filtration. Both 10-fold concentrated samples were mixed with 5X sample buffer (250 mM Tris-HCl, pH 6.8, 10% sodium dodecyl sulfate, 50% glycerol, 5% β-mercaptoethanol, and 0.1% bromophenol blue) and subjected to western blot assay. Lysates from rotenone-treated dSH and iDP-neurons were compared with urine samples.
RESULTS
Set-up and detection of monomeric or fibrillar α-syn standard for ELISA
To establish the sandwich ELISA for α-syn, we composed antibody-pairs for the sandwich ELISA. The three different antibodies that we used as capture antibodies in our ELISA are described in Table 1. Monomeric α-syn was used as the standard for the total α-syn ELISA; we then measured serial dilutions of monomer standards using a capture antibody (Clone 42) and detection antibody (Fig. 1A, B). We validated the combination of the total α-syn ELISA (Total-αS ELISA) antibody-pair using a monomer standard (Fig. 1C).
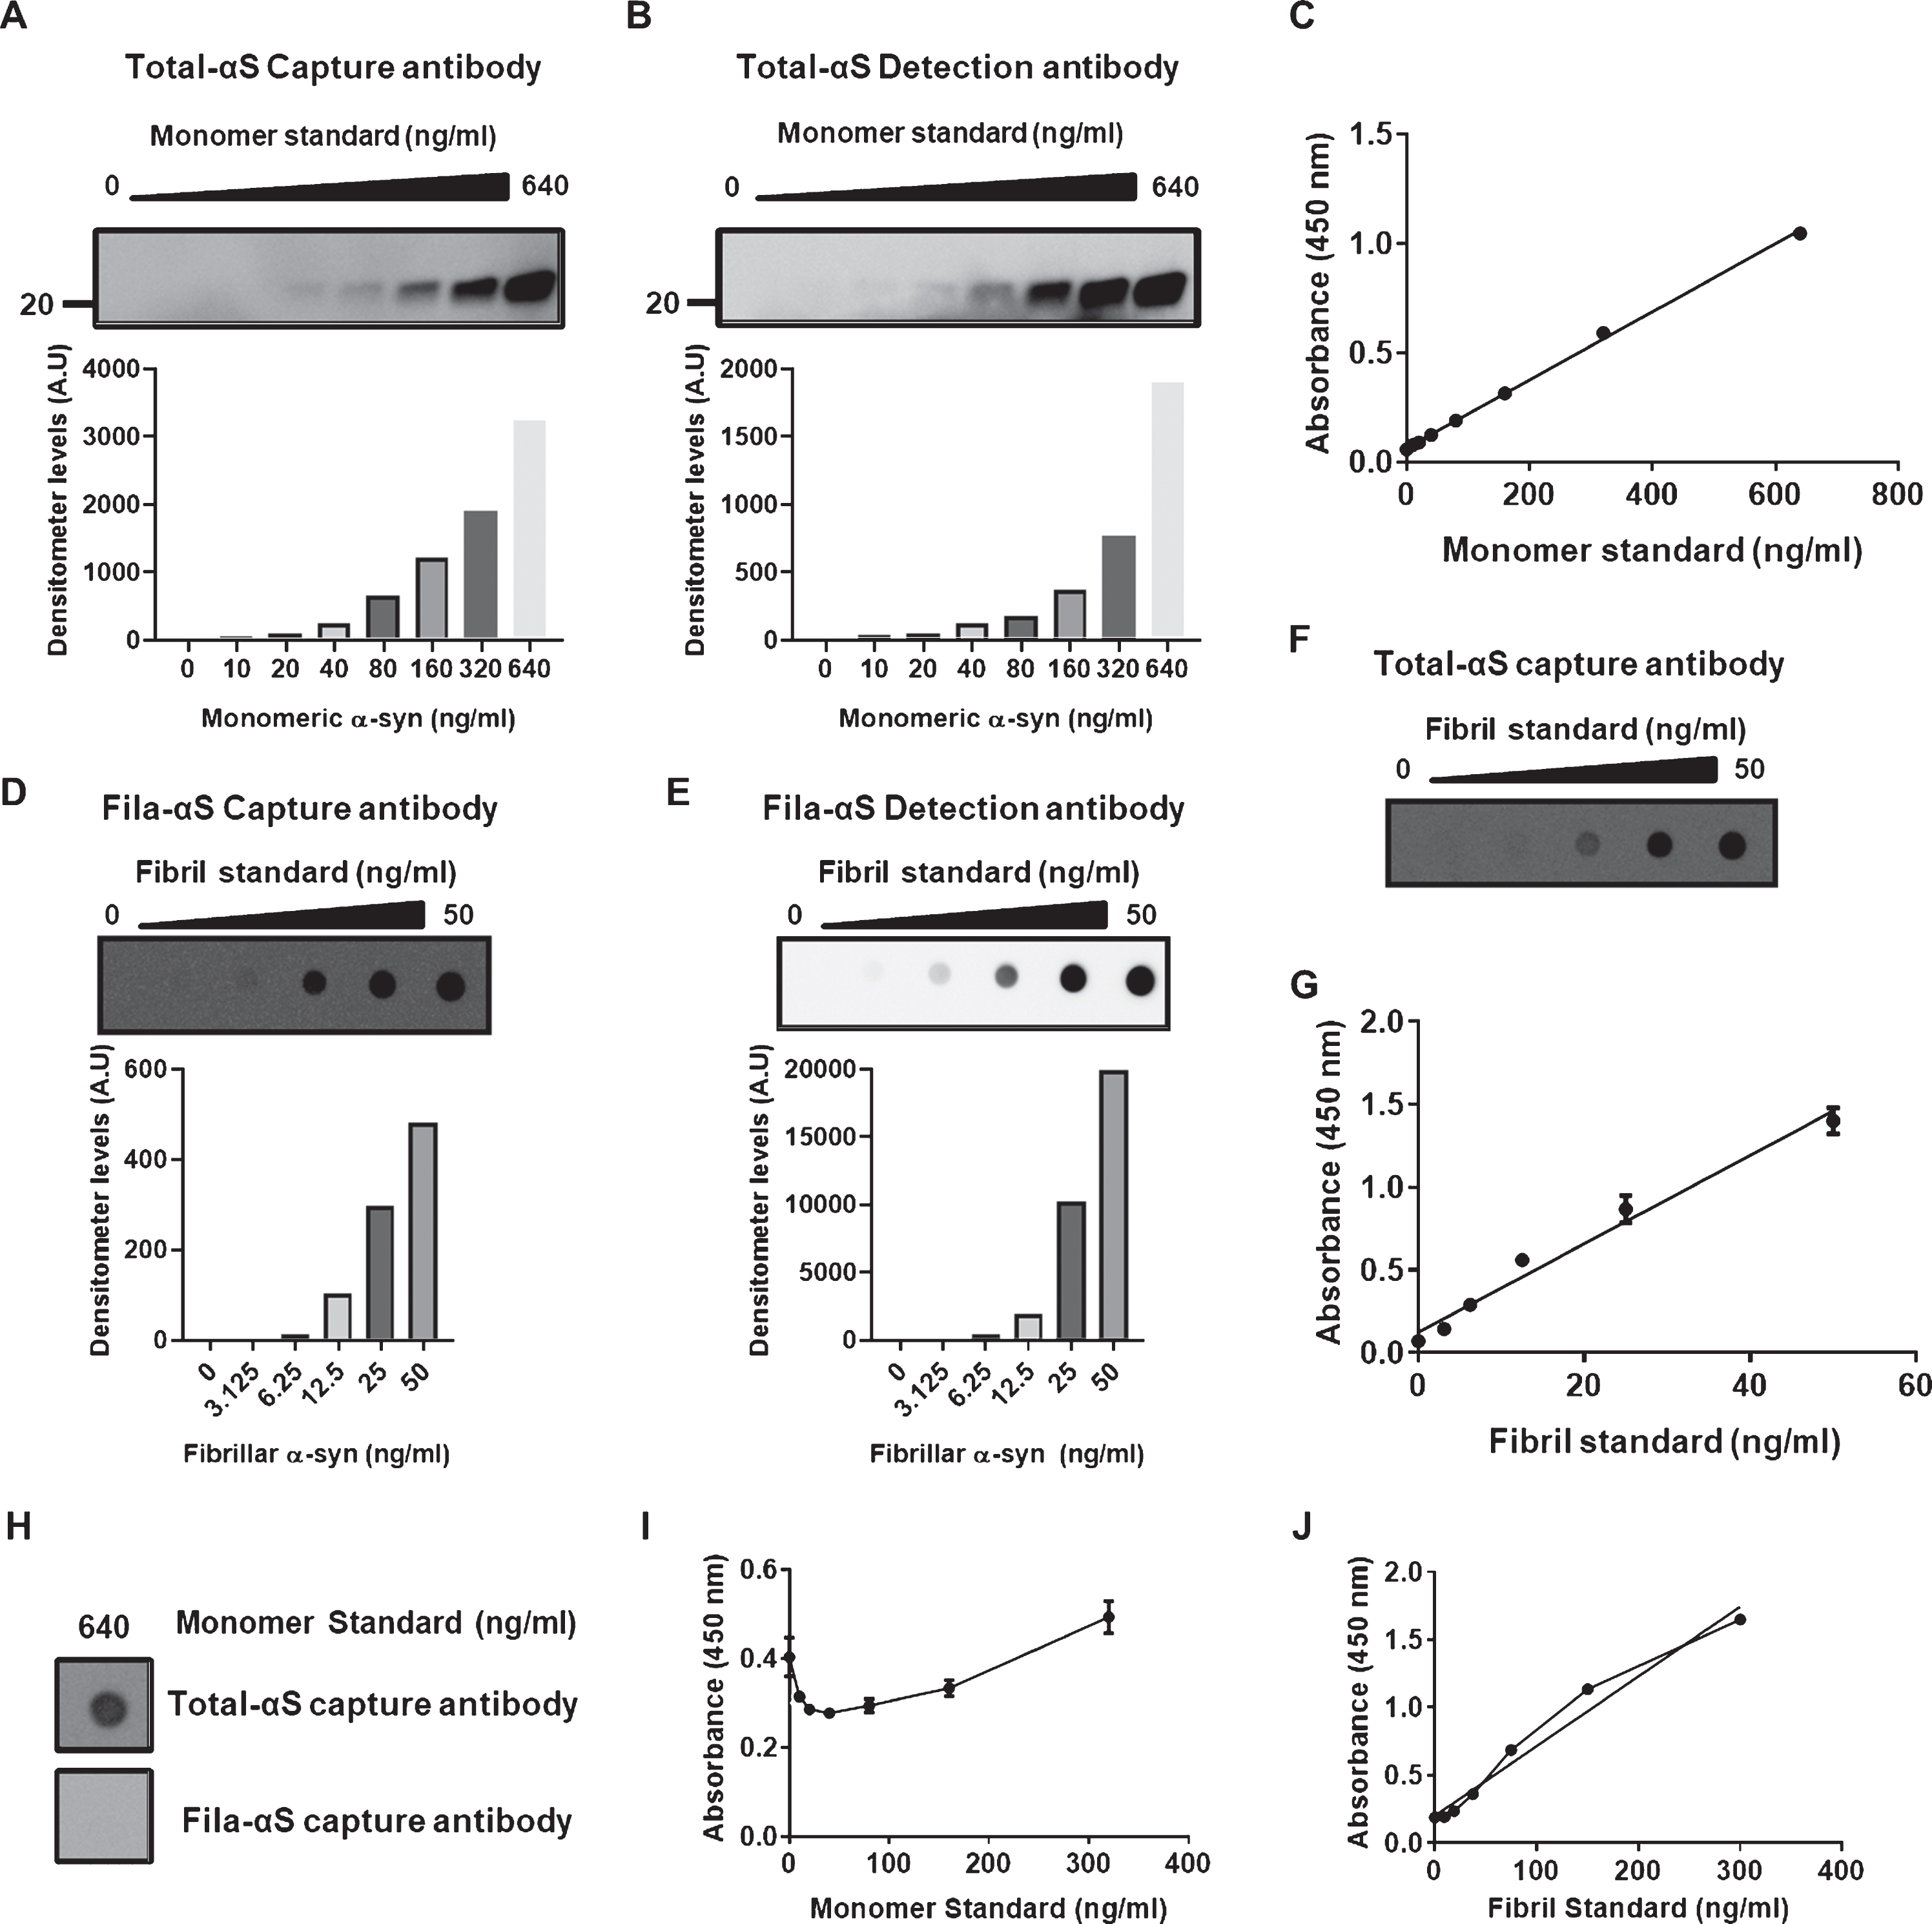
Establishment of sandwich ELISA detecting total α-syn and β-sheet rich conformations of α-syn. A,B) The serial dilution of monomer standards was confirmed following western blot assay using the capture (A) or detection (B) antibody for Total-αS ELISA. C) Monomeric standards showed a linear increase in 450 nm absorbances with the increase in concentrations of monomeric standards. D, E) A dose-dependent increase in fibril standards was observed following western blot assay using the Fila-αS capture (D) and detection (E) antibodies. F) The capture antibody for the Total-αS ELISA validated the serial increases in fibril standards shown in E-F. G) The association between the concentration of fibril standards and absorbance showed good linearity. H) The highest concentration of monomeric standards was not detected by the capture antibody of Fila-αS ELISA using an aggregates-trap assay but positively reacted with the capture antibody of Total-αS ELISA. I) The monomeric standards did not show a dose-dependent increase in the 450 nm wavelength absorbances in Fila-αS ELISA. Most standards were measured below the standard of zero-background. J) Fibril standards showed a linear increase with their concentrations and it appears that saturation occurs between 80 ng/ml and 160 ng/ml of the fibril standard, thereby reorganizing the range of fibril standards at lower levels.
The fibrillar form of α-syn was used as the standard for filament-conformation specific (Fila) α-syn ELISA (Fila-αS ELISA) because the Fila antibody could detect the aggregation-prone formation of α-syn oligomers, which harbors a β-sheet-rich structure [18]. Fibril standards were confirmed with a capture and detection antibody using an aggregates-trap assay (Fig. 1D, E). Fibril standards were tested with a Total-αS ELISA capture antibody (Fig. 1F), and the fibril standards and antibody pair showed a linear correlation (Fig. 1G). The highest concentration of monomer α-syn was detected using the capture antibody against Total-αS ELISA, and not by the filament-conformation specific α-syn capture antibody (Fig. 1H). Moreover, monomeric standards did not fit with Fila-αS ELISA, which was contrary to the linear curve of the fibril standards (Fig. 1I, J). These results show that monomeric or fibril standards with antibody pairs were suitable for their respective ELISAs.
Detection of neuronal cell-derived α-syn using ELISA
Previous studies have demonstrated that rotenone-treatment results in the aggregation of α-syn and its release [19, 20]. Therefore, we treated dSH, a human dopaminergic neuronal cell line, and iDP-neurons which were derived from fibroblasts of a healthy donor, with rotenone. Rotenone treatment promoted a slight increase in cellular Total-αS levels in dSH and a significant increase in iDP-neurons (Fig. 2A, E). The intracellular accumulation of β-sheet-rich oligomeric α-syn following treatment with rotenone was significantly higher in dSH, but there was no significant change in iDP-neurons (Fig. 2B, F). However, secreted levels of Total-αS and Fila-αS showed significant increases following rotenone treatment for both cell types (Fig. 2C, D, G, H). As rotenone-induced cytotoxicity can promote the release of α-syn as well as the aggregation of α-syn, the results from a cell-based system may validate our Total- and Fila-αS ELISA.
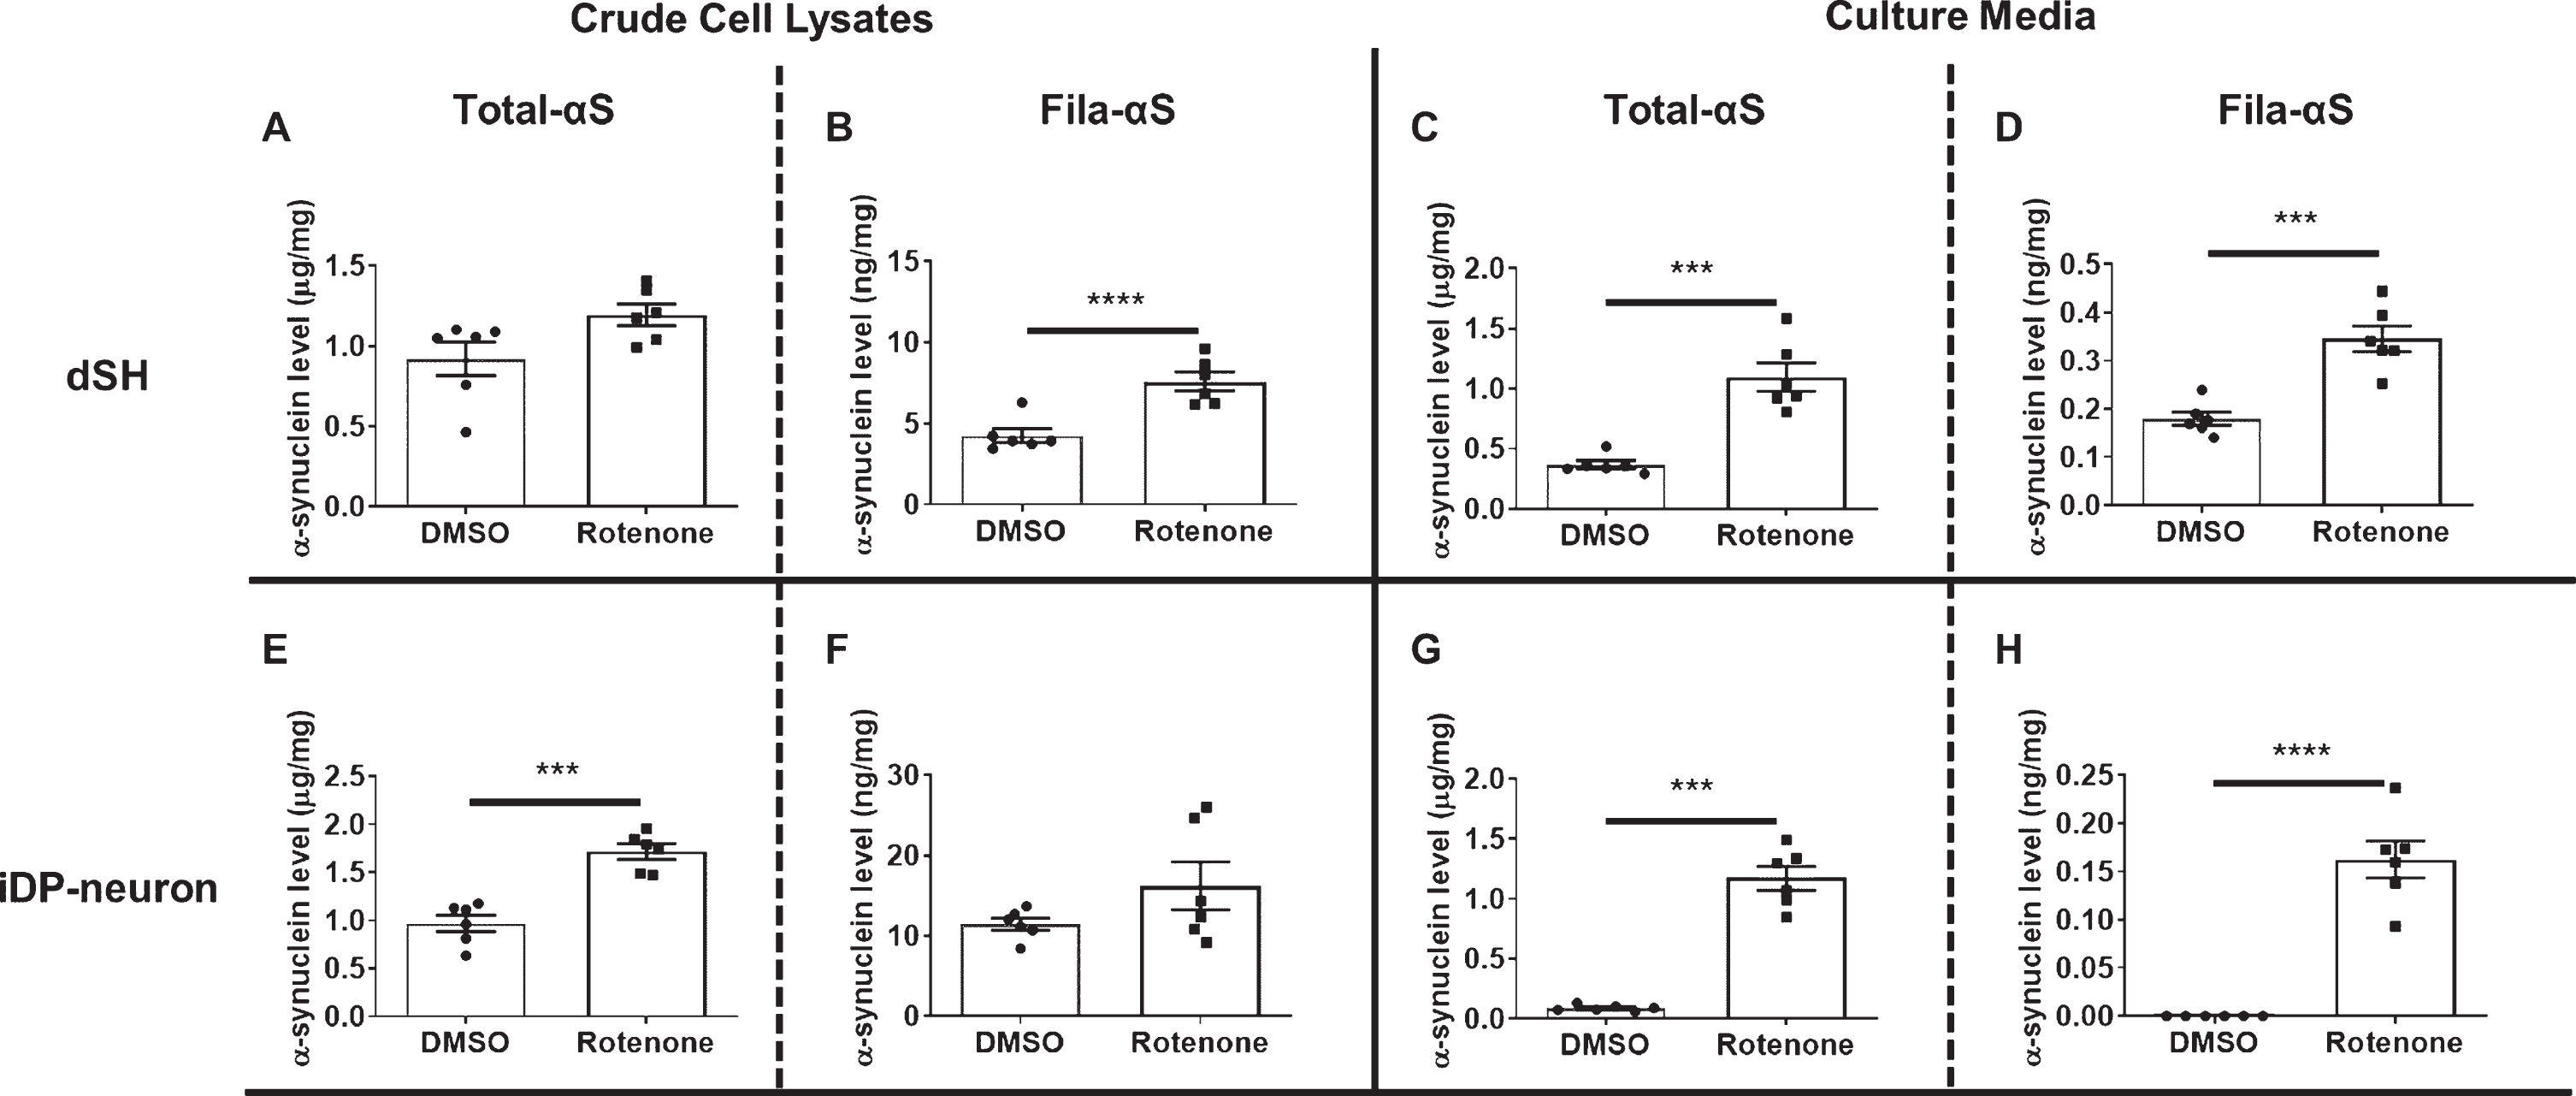
The validation of established ELISAs. We measured crude cell lysate from dSH using Total-αS ELISA (A) or Fila-αS ELISA (B). Culture media from dSH was also analyzed using the ELISA for Total-αS (C) or Fila-αS (D). Crude cell lysate from iDP-neurons was also subjected to Total-αS (E) or Fila-αS (F) ELISA. The measurements obtained using Total-αS ELISA (G) or Fila-αS ELISA (H) of the culture media from iDP-neurons are shown. A Student’s t-test was used for statistical analysis. *** p < 0.001; **** p < 0.0001.
To clarify the results of Total- or Fila-αS ELISA using the cell-based system, immune precipitation (IP) was used for the removal of α-syn in samples. We immune precipitated recombinant α-syn using the capture antibody against Total-αS ELISA and confirmed that IP pull-down α-syn was appropriate (Supplementary Figure 1A). The α-syn in naïve dSH lysate (Pre) was captured by the α-syn antibody-beads complex (IPed), and the α-syn levels following IP (Post) were decreased to undetectable levels (Supplementary Figure 1B). We observed that the removal of endogenous α-syn followed by IP decreased the levels of α-syn in Total- or Fila-αS ELISA (Supplementary Figure 1C, D). These results lead us to conclude that our developed ELISA is appropriate for the measurement of Total- or Fila-αS levels in biofluids.
Detection and analysis of α-syn in urine samples
The presence of α-syn in human urine has not been demonstrated with biochemical analyses to date. To confirm the validity of measuring α-syn levels in human urine, we attempted to detect monomeric and oligomeric α-syn in a urine sample that was concentrated 10-fold using sequential 100 K and 10 K filtration. Western blot analysis clearly showed the presence of monomeric α-syn in the 10 K filtration fraction (Fig. 3A). The high molecular weight bands of α-syn in the 10 K and 100 K fraction (arrowhead in Fig. 3A) might represent oligomeric α-syn in the urine. Various non-specific α-syn oligomers, which appeared as a ladder of numerous α-syn bands, were also observed in the lysates from dSH and iDP-neurons that were treated with 2 μM of rotenone. We could not observe non-specific reactions of the anti-mouse secondary antibody (Fig. 3B), and the total protein levels in urine showed relatively lower levels than those of the rotenone-treated dSH or iDP-neurons (Fig. 3C). Therefore, we concluded that the concentrated urine sample was amenable for use in our established ELISA.
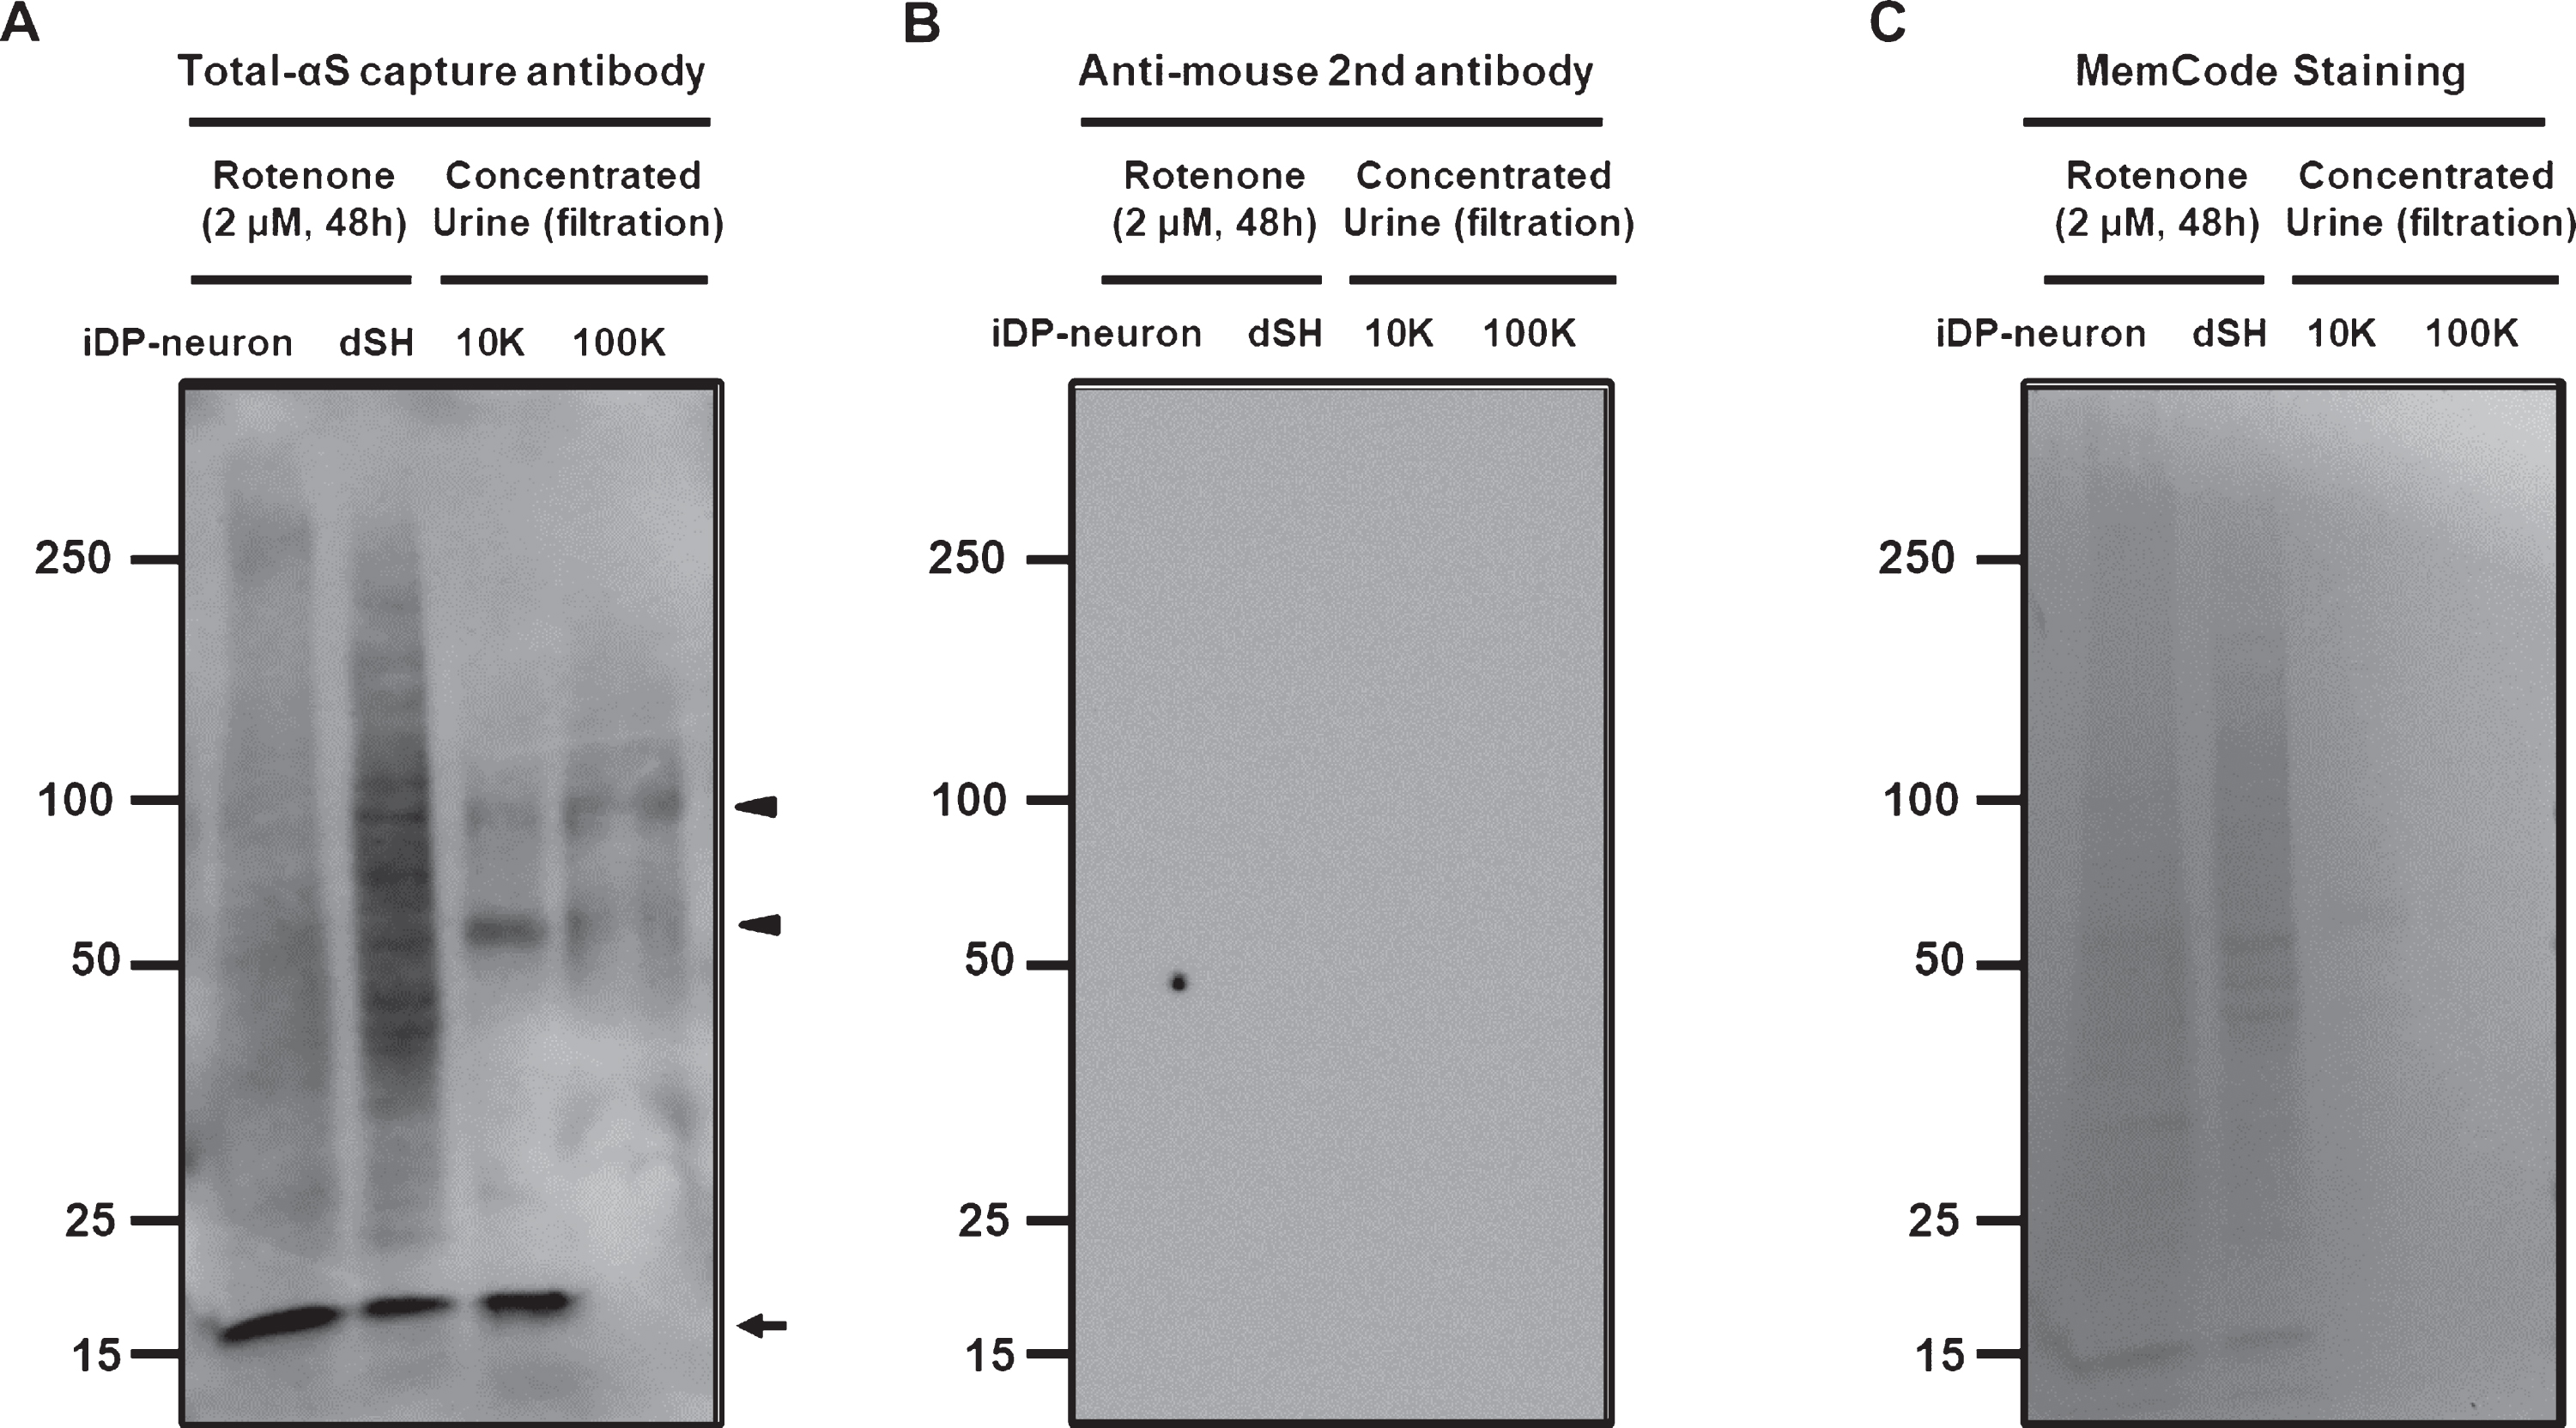
Detection of α-syn in human urine. A) Monomeric α-syn (arrow) in 10K-concentrated urine samples appeared at an identical size of approximately 18 kDa using the capture antibody of Total-αS ELISA. Both urine samples demonstrate the presence of oligomeric a-syn (arrowhead). B) The secondary antibody to detect Total-αS capture antibody did not show any detectable protein bands. C) MemCode staining validated the total amount of loaded protein.
Next, we tested 11 non-PD samples from non-related patients and 21 samples from PD patients. There was no difference in Total-αS levels between the two groups (Fig. 4A), but Fila-αS was significantly higher in PD patients’ urine (Fig. 4B). The correlation between Total-αS and Fila-αS in non-PD and PD patients was not significant following non-zero slope validation, but the slope in PD patients showed a weak association (p = 0.0569) (Fig. 4C, D). Interestingly, Total-αS levels increased with the H & Y stage of PD patients and the non-zero slope analysis was significant (p = 0.0321) (Fig. 4E). However, there was no significant association between Fila-αS levels in PD patients’ urine and H & Y stage (Fig. 4F). In addition, when αSyn levels in the blood were measured, the levels of Total- or Fila-αS in the serum were not related to those levels in the urine or the H & Y stage of the respective PD patients (Supplementary Figure 2). Taken together, only the levels of Fila-αS were significantly higher in PD patients’ urine than those in non-PD urine samples. Meanwhile, PD severity may be associated with Total-αS urine levels.
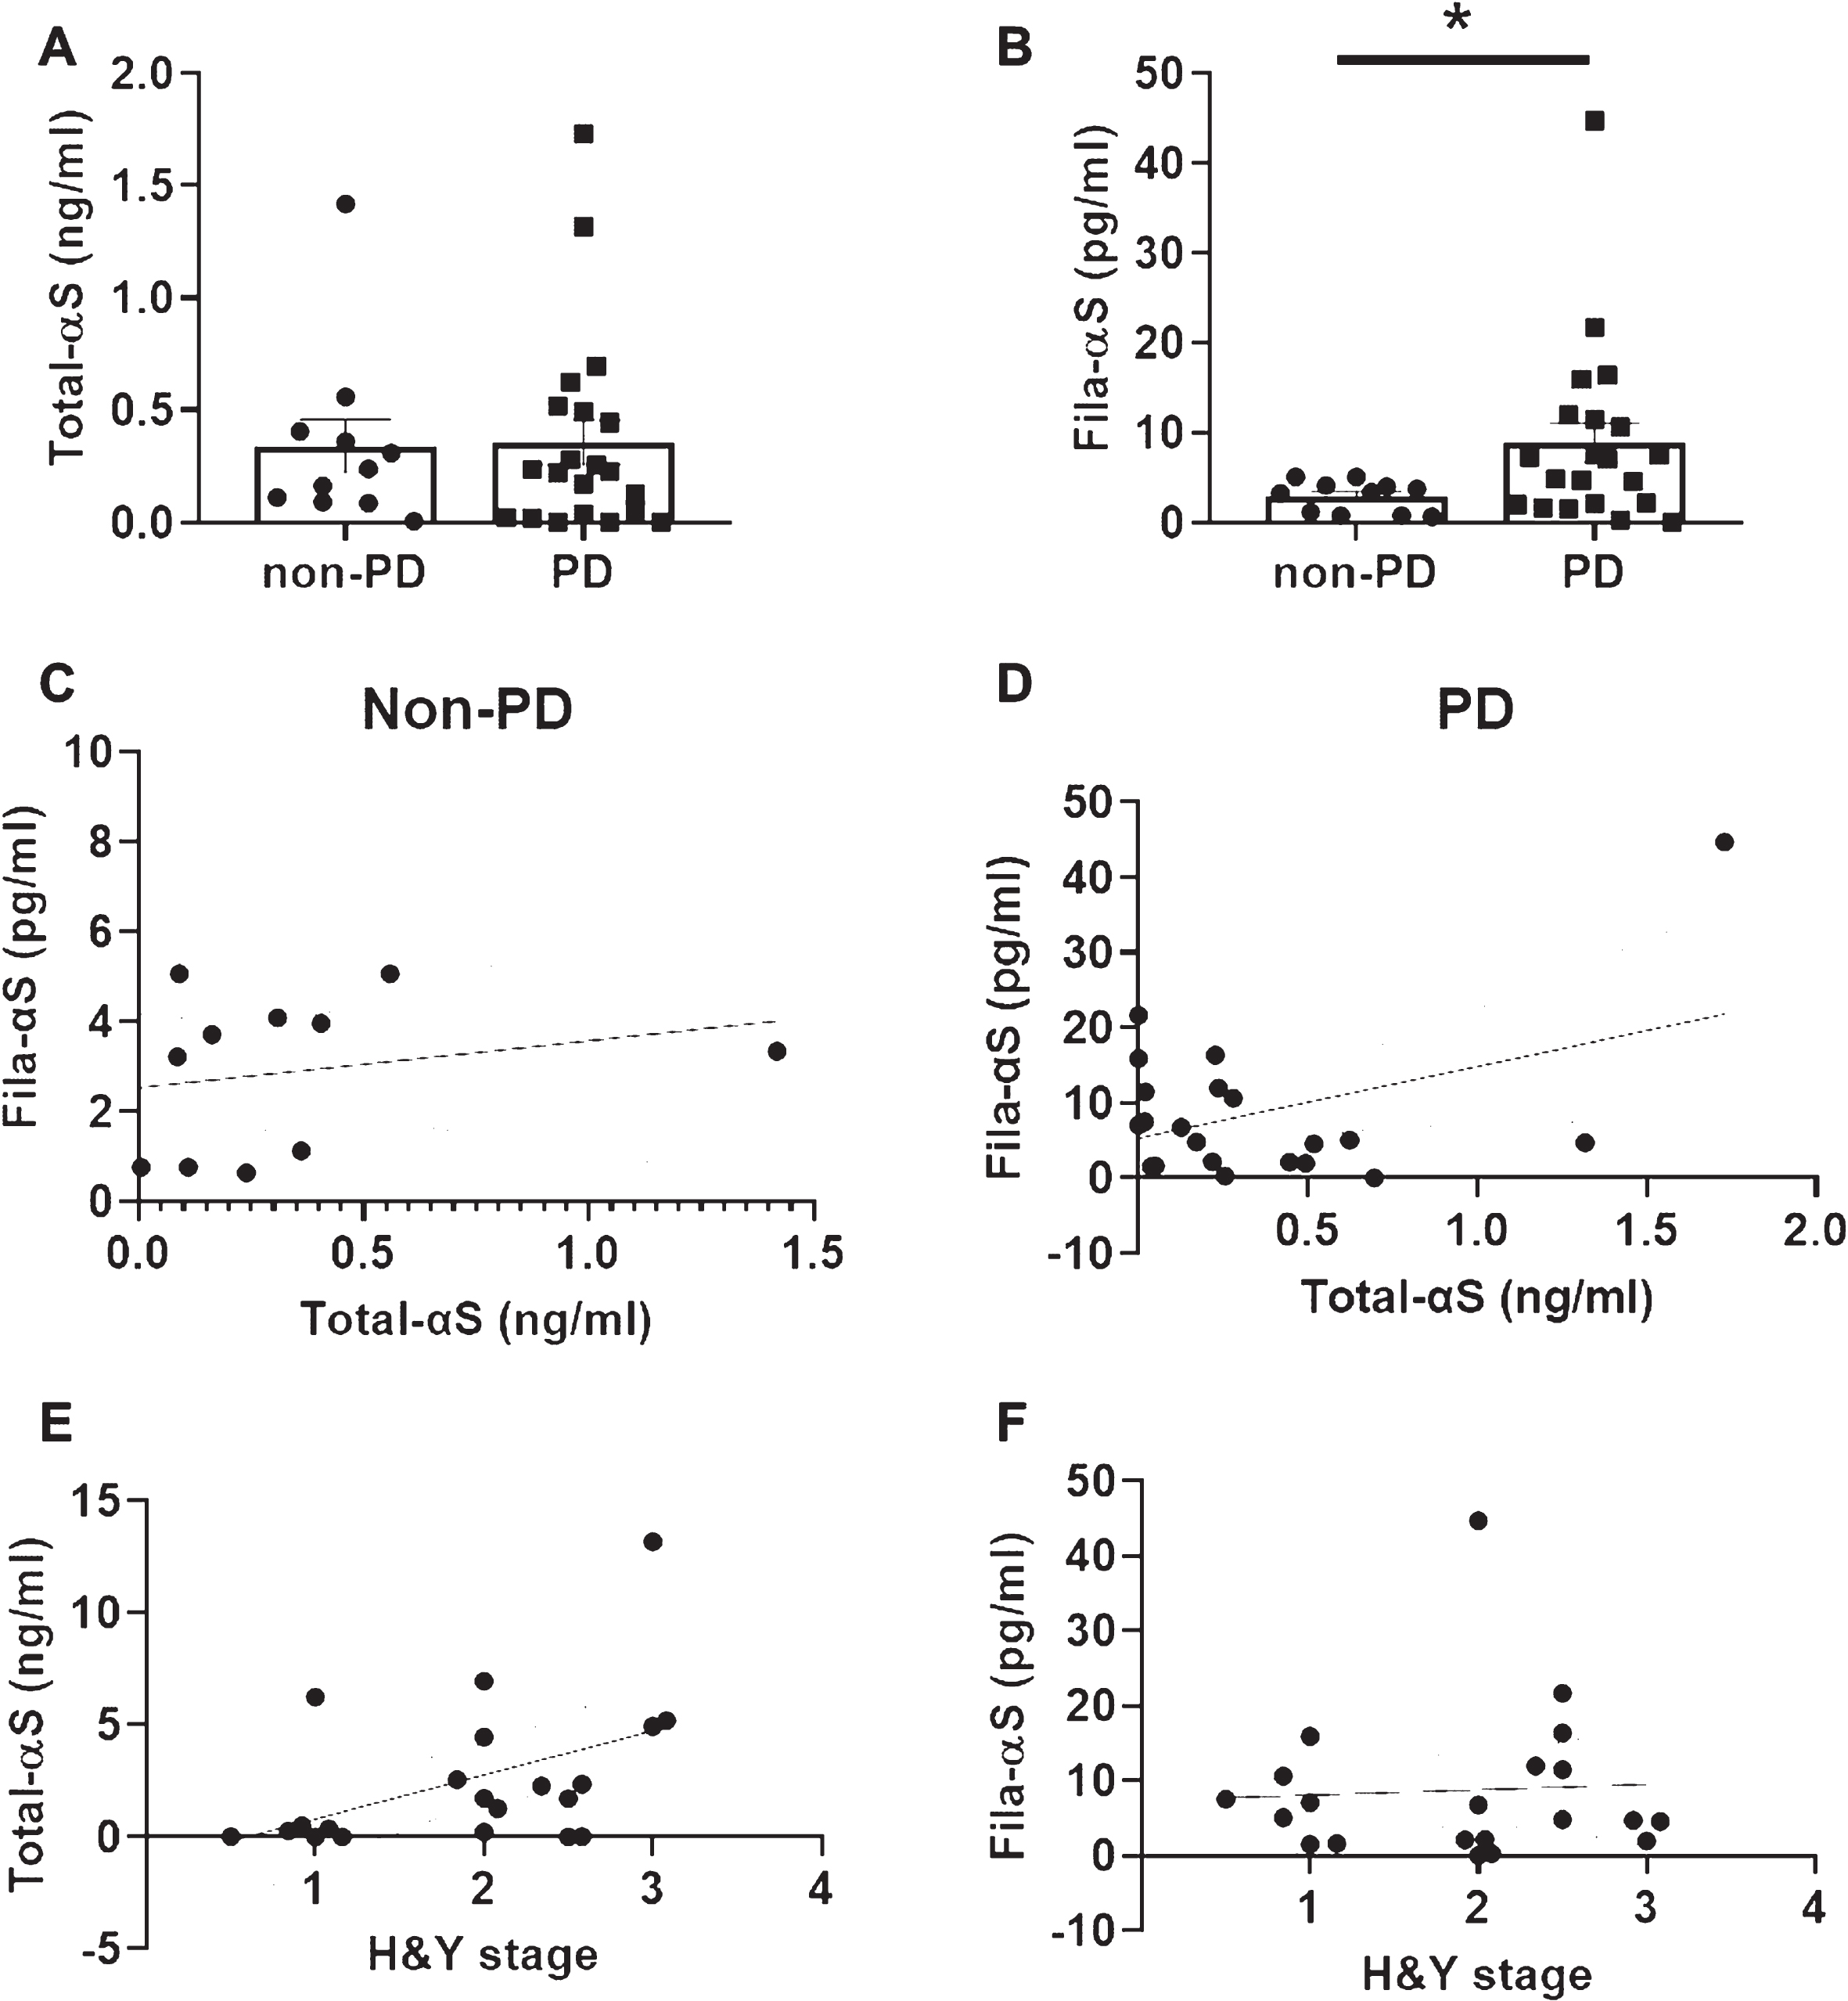
Analyses of urinary α-syn levels among non-PD and PD samples. Ten-fold concentrated urine samples were subjected to Total-αS ELISA (A) and Fila-αS ELISA (B). We analyzed the association between Total-αS levels and Fila-αS levels in non-PD (C) and PD (D) groups. The relationship between the H&Y stage and Total-αS levels (E) or Fila-αS levels (F) was also analyzed. A Student’s t-test was used for comparisons between the non-PD and PD groups. Non-zero slope significance was analyzed in XY curve graphs. * p < 0.05.
Levels of various oligomeric formations of α-syn in urine
The heterogeneity of oligomeric α-syn in biofluids is not yet fully understood. However, we cannot not exclude the possibility of the presence of different α-syn oligomers in the urine. Therefore, we analyzed the levels of different α-syn oligomers in urine using the ASyO5 antibody against distinct conformations of α-syn oligomers [21]. The ASyO5 antibody attached to the specific oligomer α-syn which showed a spherical ultra structure as seen with Atomic Force microscopy, but the fibrillar α-syn was not detected using the ASyO5 antibody. To avoid the detection of fibrillar α-syn, we choose ASyO5 as the capture antibody in our ELISA which is distinct α-syn. To prepare a standard for the oligomeric α-syn, we collected each cut and FT fraction using sequential filtration following low-temperature incubation of monomeric α-syn for 5 d (Fig. 5A) and used the 100 K-cut α-syn as an appropriate standard for oligomeric α-syn (Oligo5-αS) ELISA (Fig. 5B). Serial dilution of the 100 K-cut α-syn showed a gradual decrease in oligomeric (arrow) and monomeric α-syn (Fig. 5C) using the detection antibody in western blot assays and with the capture and detection antibody pairs for Oligo5-αS ELISA in dotblot assays (Fig. 5D). Linearity of the oligomeric standards using the 100 K-cut α-syn fractions was observed, but serial dilutions of 30 K-FT α-syn did not fit a linear curve (Fig. 5E), suggesting an absence of Oligo5-αS in the 30 K-FT. As the capture antibody, Oligo5-αS, exhibited a weak binding to the 30 K-FT (Fig. 5B), and a serial dilution of 30 K-FT showed extremely low absorbances in the Oligo5-αS ELISA (Fig. 5E). The detection of monomeric α-syn by Oligo5-αS ELISA was concluded to be negligible. The level of Oligo5-aS was lower in PD patients than that in non-PD patients (Fig. 5F), and there was no correlation between Oligo5-αS levels and H&Y stage in PD patients (Fig. 5G). The increase in Oligo5-αS levels was not related to Total-αS or Fila-αS levels (Fig. 5H–K). ELISA for Oligo5-αS showed absorbance below that of the standard at zero, so we could not analyze these data (data not shown). Moreover, we applied another oligomer α-syn specific antibody, a clone named Syn33, to our established ELISA and observed a similar result to the Oligo5-αS ELISA. However, the sensitivity using the Syn33 antibody was too low for urinary α-syn analysis (data not shown).
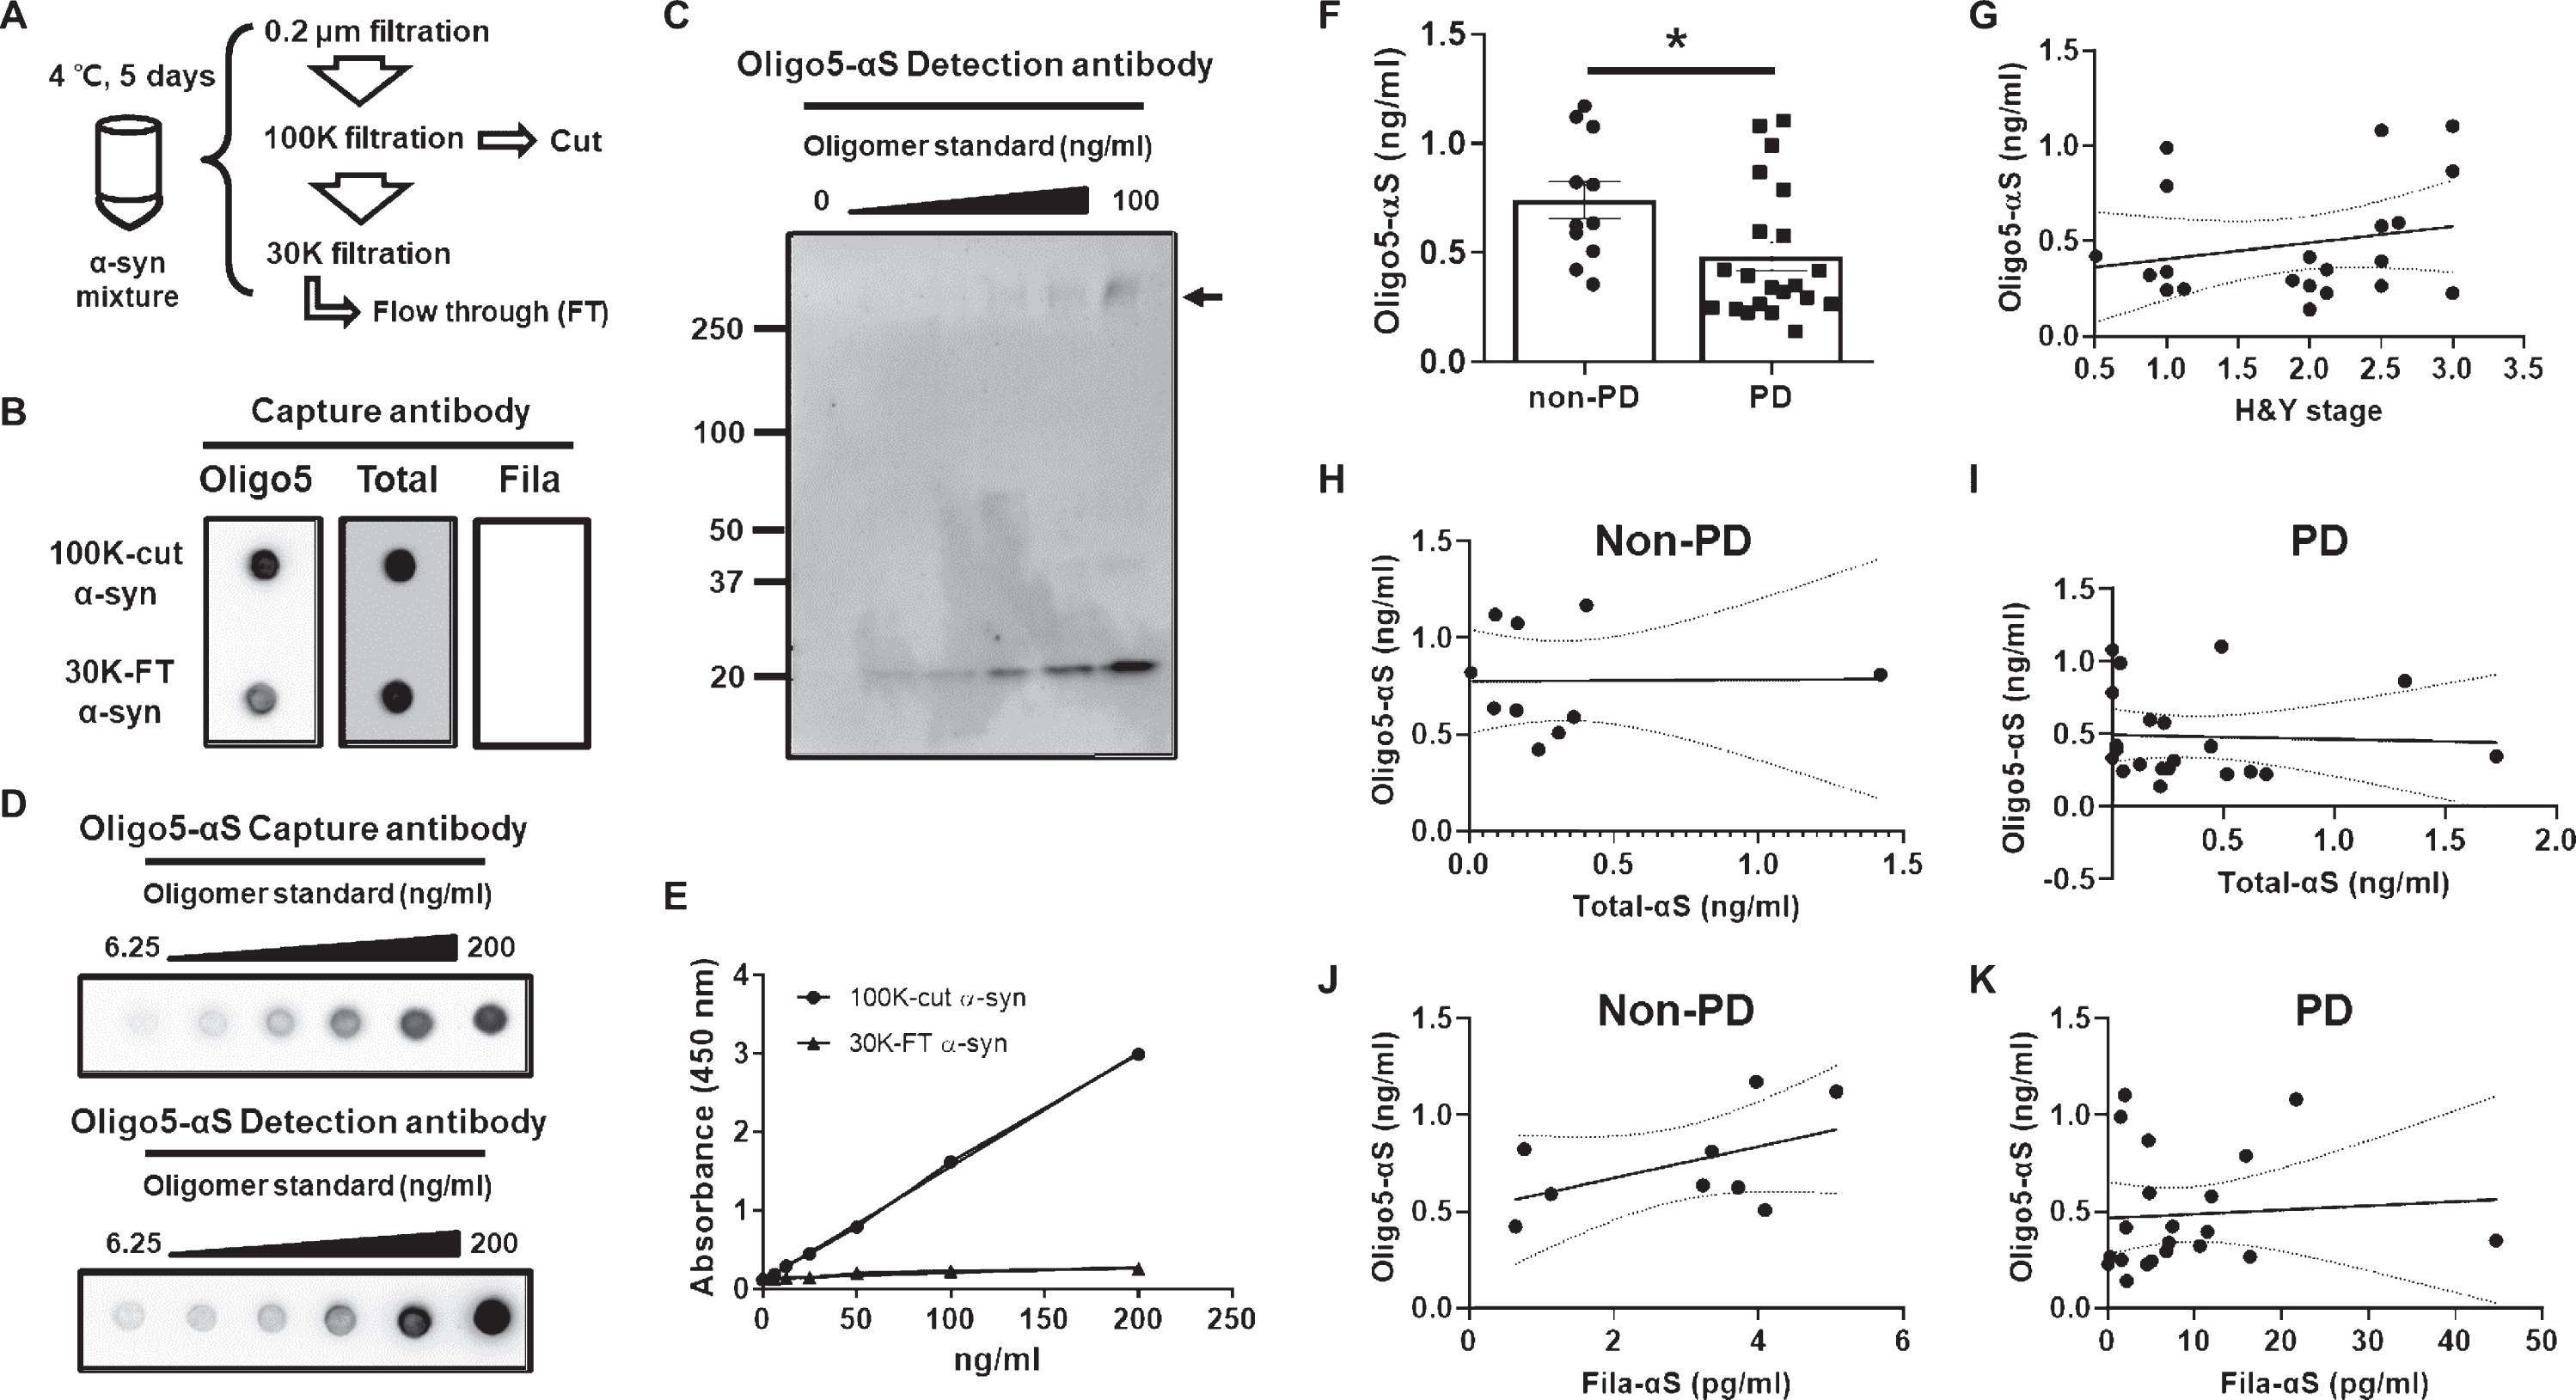
Analysis of the distinct conformations of α-syn oligomers. A) A scheme for the generation and isolation of oligomeric standards. B) Isolated α-syn oligomer in the 100 K-cut fraction was validated using three different capture antibodies. C) A serial dilution of oligomeric standards showed a dose-dependent presence of monomeric and oligomeric α-syn. The arrow indicates oligomeric α-syn. D) Dot-blot assay of the oligomeric standards for Oligo5-αS ELISA was consistent with the results of the western blot assay. E) Oligomeric standards made from the 100 K-cut fraction showed linearity, whereas the serial dilution of α-syn in the 30 K-FT fraction was not appropriate for oligomeric standards. F) Urine samples subjected to Oligo5-αS ELISA showed significantly lower levels in the PD group than in the non-PD group. G) Analysis of the association between Oligo5-αS levels and H & Y stage. Analysis of the correlation of Oligo5-αS levels with Total- αS levels in the non-PD (H) and PD (I) groups and Fila-αS levels in the non-PD (J) and PD (K) groups was also performed. A Student’s t-test and non-zero slope significance were used for the analyses. *p < 0.05.
DISCUSSION
Human urine has long been a vital specimen to enable the quantification of disease progression or severity, such as in cancer [22], psychiatric disorders [23–25], autoimmune disease [26], and neurodegeneration [27]. We previously described an increase in DJ-1 in urine exosomes and oxidized DJ-1 levels in the concentrated urine of Korean PD patients compared to non-PD patients [13, 14]. Another study reported an increase in the auto-phosphorylation of S1292 LRRK2 in the urine of PD patients [16].
Identification and measurement of α-syn oligomers have been investigated as diagnostic tools for PD [7]. Our previous studydetected no α-syn in urine exosomes using western blot, but the presence of oligomeric or total α-syn at below detectable levels could not be excluded [13]. Therefore, we developed a sensitive sandwich α-syn ELISA using various α-syn oligomers. We validated several α-syn ELISAs to detect the accumulation and release of α-syn oligomers (Figs. 1 and 2). Moreover, following a 10-fold concentration of urine via filtration with the addition of Tx-100, we succeeded in detecting α-syn using western blot (Fig. 3). With our developed α-syn ELISA method, we were able to measure differences in the levels of various α-syn oligomers in urine for the first time between PD and non-PD patients (Figs. 4 and 5).
The conformations of α-syn regulate the rate of oligomerization or fibrilization and determine their fate, and whether they progress into smaller oligomers, such as curvy filament or spherical, or halo structure, or larger sized aggregates that mature into α-syn fibrils [5]. The dynamics of α-syn in the human body remain elusive, but the β-sheet-rich property is critical for α-syn fibrilization, which leads to the formation of Lewy bodies or Lewy neurites in dopaminergic neurons. In addition, the random coil or α-helix structure is responsible for the generation of α-syn oligomers that may exhibit neuronal toxicity [28]. Some α-syn oligomers, which are remodeled by treatment with baicalein or epigallocatechin gallate, are non-toxic oligomers and inhibit the aggregation of α-syn [29, 30]. Therefore, the distinct conformation-derived effects accelerate (on) or prohibit (off) the progression (pathway) of aggregation of α-syn, thereby acting as an on/off-pathway switch for α-syn aggregation [2]. Our data show that the levels of oligomeric α-syn were distinct along with the conformational difference. On the other hand, the relationship between the H & Y scale and changes in the levels of oligomeric α-syn were weak (Figs. 4 and 5). Among the levels of three different ELISAs, the detection levels of urinary α-syn by Total- or Oligo5-αS ELISA were clustered in the ng/ml scale, but Fila-αS ELISA was decreased to the pg/ml scale (Figs. 4A, B and 5F). Furthermore, most α-synuclein was found in the 10K fraction following 100K filtration by western blot analysis (Fig. 3). These results indicate that the major form of α-synuclein in urine is that of a monomer or a small conformer, such as dimer, trimer, tetramer or tiny oligomers. A previous study reported that α-synuclein under physiological conditionsis a tetrameric conformer [31]. Our detection results could not elucidate the conformational identity in urine, but the presence of tetrameric α-syn in urine might be evaluated in further studies. In PD patients, Fila- or Oligo5-αS was clustered together in the low-level range of Total-αS (Figs. 4D and 5I). Moreover, the distribution of PD patients’ Oligo5-αS was mostly positioned in the low Fila-αS levels (Fig. 5K). These results might indicate that monomeric α-syn can easily undergo oligomerization, but only a few α-syn oligomers can turn into β-sheet-rich aggregation-prone oligomers. This also suggests that off-pathway oligomers retain their conformation, but on-pathway oligomers can attain the aggregation-prone property. Thus, the different levels between Oligo5-aS and Fila-aS in PD patients indicates that the aggregation kinetics of α-syn in PD patients may not be uniform. Recently, Lee SJ et al. reported distinct α-syn aggregations in PD patient brains using biochemical analyses [32]. However, we could not analyze the ultrastructure or biochemical property of oligomeric α-syn in the urine. Taken together, the identification of α-syn strains in individual subjects could be a critical step to classifying pathological α-syn strains in biofluids.
Total- or Fila-αS levels in serum were not associated with those in urine or the H&Y stage (Supplementary Figure 2). We were unable to measure the levels of Oligo5-αS in serum, because we used different antibodies for the oligomeric α-syn and analytical methods, our results do not correspond to previous studies that described an increase in oligomeric α-syn in the plasma of PD patients [33]. To verify the status of α-syn oligomers, we should increase the number of serum samples, which in this study was far fewer than that of the urine samples. Our serum data suggest that the proportion of oligomeric α-syn in human serum is different from that of urinary α-syn oligomers. To detect oligomeric α-synuclein in urine more precisely, the urine sampling process for ELISA should be investigated and improved in the future. A previous study reported that end-stage renal failure is associated with increased risk of PD [34]. In our preliminary test (data not shown), patients with proteinuria showed a dramatic increase in urinary α-syn. Despite the renal dysfunction among PD progression in cellular molecular levels is still elusive, the leakage or penetration of α-syn from blood to urine due to the abnormal renal function in PD might be a cause of presence of urinary α-syn. Eventually, advances in the methodological approach could justify urinary α-syn analysis, thereby providing an alternate analysis to α-syn in blood.
To address the lack of understanding of PD pathogenesis and its pathological markers during the disease period, future studies should consider longitudinal analyses that start at an early age with subjects in a healthy condition and end in post-mortem analysis. The broad spectrum of α-syn oligomerization in different organs and biofluids might provide clues to PD pathogenesis and diagnosis in its early stages.
In conclusion, we developed an ELISA method using three types of α-syn antibodies specific to certain configurations as capture antibodies, biochemically showed the presence of α-syn in human urine for the first time, and compared the levels of two different α-syn oligomers between non-PD and PD urine samples. Although we found an increase in the β-sheet-rich aggregation-prone α-syn oligomer along with a decrease in one distinct α-syn oligomer in the urine of PD patients, there were weak correlations with the index of PD progression. Herein, we propose that the pathway of α-syn aggregation is dependent on its conformational status. We need to increase the number of patients and compare other biofluids, including serum and cerebrospinal fluid, and further characterize the urinary α-syn oligomers.
CONFLICT OF INTEREST
The authors have no conflict of interest in this report.
Footnotes
ACKNOWLEDGMENTS
We thank the donors and staff of the Neurology Department in Boramae Hospital, who helped with the sample collection. This research was supported by grants from the National Research Foundation of Korea (2015M3A9C7030128) and KRIBB research initiative program funded by the Ministry of Science and ICT.We would like to thank Editage (![]() ) for English language editing.
) for English language editing.