
Abstract
Background/Objective:
Easily accessible biomarkers are crucial for disease-modifying clinical trials in patients with Parkinson’s disease (PD). We investigated integrated plasma and neuroimaging biomarkers correlating with motor and cognitive severity in PD patients.
Methods:
This cross-sectional study enrolled 170 participants (12 controls and 158 PD patients). Plasma α-synuclein and neurofilament light chain (NfL) level, and global and regional cortical thickness (CTh) on brain MRI were analyzed to predict advanced motor stage (Hoehn & Yahr stage ≥3), and PD dementia (PDD, MMSE score <26).
Results:
Plasma α-synuclein and NfL levels were higher in PD patients than controls (both P < 0.0001 for α-synuclein and NfL). Plasma NfL levels were significantly elevated in patients with advanced motor stage (P = 0.008) or PDD; α-synuclein was elevated in the advanced motor stage group. Global CTh was thinner in patients with PDD than controls (2.33±0.19 mm vs 2.43±0.14 mm, P = 0.06). Among PD patients, higher α-synuclein was associated with thinner limbic CTh, whereas higher NfL was associated with thinner temporal CTh and insular CTh. The accuracy of predicting advanced motor stage using age and sex alone (area under the curve [AUC] 0.63) was significantly improved by the addition of plasma α-synuclein and NfL, and temporal and insula CTh (full model, AUC 0.77, P = 0.004). The accuracy of predicting PDD using age and sex alone (AUC 0.82) increased by incorporating plasma α-synuclein and NfL, and temporal and insula CTh as full model (AUC 0.87, P = 0.047).
Conclusions:
Integrated plasma and neuroimaging biomarkers reflect both motor and cognitive aspects of PD severity.
INTRODUCTION
Parkinson’s disease (PD) is a common neurodegenerative disease featuring progressive decline of both motor and non-motor functions [1]. Cognitive decline is one of the most frequent and disabling non-motor symptoms [2]. Given the likely entry of several classes of mechanism-targeted therapies, such as those targeting the propagation of α-synuclein or LRRK2 kinase inhibitors, into early human clinical trials, the identification of easily accessible biomarkers that could reflect disease severity in PD is urgently needed.
PD is characterized by the presence of intra-neuronal α-synuclein aggregations, and pathological studies have also identified amyloid-β (Aβ) plaques and tau-containing neurofibrillary tangles, which are hallmark pathologies of Alzheimer’s disease (AD), in the post-mortem brains of patients with PD dementia (PDD) [3]. These neuropathology-related proteins are present in human body fluids, including cerebrospinal fluid (CSF) and blood plasma [4, 5]. Neurofilament light chain (NfL), which is a major component of the neuronal cytoskeleton, is also elevated in both the CSF and plasma of patients with chronic neurodegenerative disorders, including amyotrophic lateral sclerosis, multiple sclerosis, AD, and parkinsonian disorders [6–10], making it a possible surrogate biomarker of disease severity in PD [6]. Blood-based biomarker discovery in PD is of high priority given the ease of sample collection for follow-up study designs compared to CSF samples. In addition to biofluid markers, neuroimaging also provides powerful strategies for assessing neurodegenerative progression of PD in vivo. Neuroimaging studies have shown that cortical thinning and reduced gray matter volume, especially in the hippocampus and caudate, appear to be associated with disease duration and cognitive decline in PD [11–16]. However, results have been inconsistent regarding the contribution of biofluid or imaging features in the prediction of disease progression in PD [17].
In this study, we aimed to apply an integrated approach combing plasma-derived biomolecules, focusing on α-synuclein and NfL, and morphological changes in brain MRI features using a surface-based measurement of cortical thickness (CTh) among PD patients to investigate its potential to reflect disease severity in terms of both motor and cognitive functions in PD.
MATERIALS AND METHODS
Study participants
Patients with PD were recruited from the movement disorder clinics of National Taiwan University Hospital (NTUH), a tertiary medical center in Taiwan. PD was diagnosed according to United Kingdom PD Society Brain Bank clinical diagnostic criteria [18]. Patients with atypical or secondary parkinsonism syndromes, including multiple system atrophy, progressive supranuclear palsy, corticobasal ganglionic degeneration, vascular parkinsonism, and neuroleptic agent-related parkinsonism, were excluded. Patients from parental consanguineous marriage or who carried previously reported PD causative genetic mutations were also excluded. Healthy controls were neurologically normal participants and were friends or spouses of patients with PD. The research protocols were reviewed by the Institutional Research Board Committee at NTUH, and all methods were performed in accordance with the relevant guidelines and regulations. All participants provided informed consent before entering the study.
Clinical evaluation
The motor symptoms of PD patients were evaluated using the motor subscale of the Unified Parkinson’s Disease Rating Scale (UPDRS part III) [19] and Hoehn and Yahr (H-Y) staging [20], with higher score or stage indicating more severe motor symptoms. The duration of disease was recorded as years since first manifestation of classical parkinsonism motor symptoms. PD with mild cognitive impairment (PD-MCI) and PDD were diagnosed according to the criteria proposed by the Movement Disorder Society [21, 22]. PDD was diagnosed if a PD patient developed significant decline in global cognitive function severe enough to impair daily life [23]. PD-MCI referred to a transition state between PD with normal cognition and PDD, in which a PD patient had confirmed cognitive deficits that were not sufficient to interfere significantly with functional independence [22]. In the present study, patients’ global cognitive functions were assessed by the Mini-Mental State Examination (MMSE) [24]. We applied an MMSE score <26 as a diagnostic feature of PDD, 26 to 28 as possible PD-MCI, and ≥28 as PD with normal cognition (PD-NC), with reported sensitivity and specificity rates of 0.92 and 0.42, respectively [25].
Measurement of plasma α-synuclein and NfL
We collected 10 ml of venous blood from each participant. Blood samples were centrifuged (2500 g for 15 min) within 1 hour of collection. Plasma aliquots were stored in cryotubes at –80°C for less than 3 months before testing. Plasma levels of α-synuclein were measured by immunomagnetic reduction (IMR) using the α-synuclein kit (MF-ASC-0060, MagQu) as described previously [4, 5]. Plasma concentrations of NfL were measured using the Simoa platform with a homebrew kit (Quanterix; Lexington, MA) as described previously [26].
MRI acquisition and image analysis
All participants underwent brain MRI studies during enrollment. Brain MRI was performed using a single 1.5-T scanner with high-resolution T1-weighted volumetric MRI scans. All images were processed using FreeSurfer (http://surfer.nmr.mgh.harvard.edu) software, which can perform surface extraction, cortical parcellations, and thickness computation [27]. The CTh was derived for each patient from a surface-based pipeline consisting of several stages, including but not limited to: image registration via affine transformation to the Montreal Neurological Institute atlas, correction of intensity inhomogeneity, removal of the skull using a deformable template model, classification of voxels into white matter and non-white matter based on intensity, tessellation of gray-white matter boundaries, automated correction of topological defects, and surface reconstruction to delineate the gray matter-cerebrospinal fluid and gray matter-white matter borders. Finally, CTh was obtained at each vertex by computing the shortest distance between the above two surfaces (gray matter-cerebrospinal fluid and gray-white matter). We adopted the Desikan-Killiany atlas (lh.aparc.stats and rh.aparc.stats) in the FreeSurfer analysis suite, in which there were 34 predefined regions of interest in each cerebral hemisphere [28]. The CTh data were expressed in micrometers as global (whole brain) average and lobar (left and right thickness averaged for frontal, parietal, temporal, occipital, limbic, and insular lobes) average. The volumes of the hippocampus (left and right average) and caudate (left and right average) were quantified by the automatic segmentation method within the FreeSurfer analysis suite. Hippocampus and caudate volumes were further divided by total intracranial volume to adjusted for differences in the individual participant’s head size and expressed as ‰ of total intracranial volume.
Statistical analysis
Continuous variables were described as means and standard deviations (SDs), and categorical variables as numbers and percentages. Baseline characteristics between PD-NC, PD-MCI, and PDD were compared by Kruskal-Wallis test and chi-squared test when appropriate, and Bonferroni test was used for post-hoc pairwise comparison. Plasma α-synuclein and NfL levels were log-transformed to achieve normal distributions for further analysis. The lowest quartile of CTh was defined as ‘thinning’ (e.g., frontal thinning) and the lowest quartile of volume as ‘atrophy’ (e.g., hippocampus atrophy), whereas the highest quartile of plasma α-synuclein or NfL was defined as ‘high’ (e.g., high α-synuclein).
To investigate the relationship between plasma and neuroimaging biomarkers, Spearman’s rank sum test was first applied to determine the correlation between plasma biomarkers (α-synuclein and NfL) and CTh (global, frontal, temporal, parietal, occipital, limbic, and insular), and was partially adjusted for age and sex. A multivariable linear regression analysis was applied to test the effects of plasma α-synuclein and NfL levels on different regions of CTh, as well as hippocampus and caudate volume. The covariates included age, sex, disease duration, and MMSE scores due to their potential effects on brain morphology. The false discovery rate was used to correct for multiple comparisons between regional CTh.
In order to show the magnitude of the impact of plasma and neuroimaging markers on the motor and cognitive function of PD patients, plasma levels of α-synuclein and NfL, CTh, and gray matter volumes were then standardized by Z-transformation to achieve comparable scales. The standardized plasma and neuroimaging markers were then put into multilinear regression models as continuous variables using UPDRS part III and MMSE score as dependent variables, respectively. Logistic regression models were applied to determine the impact of individual biomarkers on advanced motor stage (defined as H-Y stage ≥3) and PDD (MMSE <26). The individual biomarkers put into the logistic regression were categorical variables, such as higher α-synuclein and NfL, cortical thinning, and volume atrophy. All models were adjusted for age, gender, and disease duration given their associations with outcomes.
Finally, we selected plasma and neuroimaging biomarkers associated with motor or cognition disease severity based on the results of logistic regression. The diagnostic performance of the models was quantified using the area under a receiver operating characteristic curve (AUC) to explore the ability of individual or combined biomarkers to predict the motor and cognitive status of PD. The predictive ability was determined using Nagelkerke’s R2 index, and we tested calibration using the Hosmer-Lemeshow test for goodness of fit. A P value <0.05 was considered to indicate significance. The statistical analyses were performed in SAS version 9.4 (SAS Institute Inc., Cary, NC, USA), and the figures were created in Prism 8 (GraphPad Software, La Jolla, CA, USA).
RESULTS
Basic clinical characteristics
A total of 170 participants, including 12 controls and 158 PD patients, were included in this study. Table 1 summarizes the clinical, plasma, and neuroimaging features of the study participants. Forty-seven patients were classified as having advanced motor severity (defined as H-Y stage ≥3), and their mean age, disease duration, and average levodopa-equivalent dose were higher than in the early H-Y stage group. Forty-two patients were classified as PD-NC, 66 as PD-MCI, and 50 as PDD according to their MMSE scores. The mean current age, disease duration, H-Y stage, and UPDRS part III scores (during “on” state) were significantly higher in the PDD group than the PD-NC and PD-MCI groups.
Basic characteristics of the study participants
aHippocampus and caudate volume were expressed as ‰ of total intracranial volume. bThe comparisons between each sub-group in patients with PD were performed using the Kruskal-Wallis test. Data are expressed as mean±standard deviation or n (%). CTh, cortical thickness; NfL, neurofilament light chain; UPDRS, Unified Parkinson’s Disease Rating Scale.
Comparisons of plasma and neuroimaging biomarkers between controls and PD patients with different motor and cognition severity
Consistent with our previous studies [5, 29], the log-transformed plasma levels of α-synuclein and NfL were significantly higher in patients with PD than those in controls (α-synuclein: –0.38±1.31 vs. –2.64±0.34, P < 0.0001; NfL: 2.76±0.64 vs. 2.09±0.40, P < 0.0001; Fig. 1A, B). Among PD patients, the log-transformed plasma levels of α-synuclein and NfL were both higher in the advanced H-Y stage group compared to the early H-Y stage group (α-synuclein: 0.14±1.03 vs. –0.53±1.37, P = 0.009; NfL: 3.01±0.69 vs. 2.68±0.57, P = 0.008 by Kruskal-Wallis test; Fig. 1A, B). Similarly, plasma NfL levels were also increased in PDD (3.07±0.62) compared to PD-MCI (2.73±0.54) and PD-NC (2.47±0.64; both P < 0.05 by Dunn’s post-hoc analysis of the Kruskal-Wallis test; Fig. 1B). The level of α-synuclein were not significantly different between the three cognitive groups (PD-NC: –0.59±1.31, PD-MCI: –0.40±1.42, PDD: –0.12±1.14, overall P = 0.27).
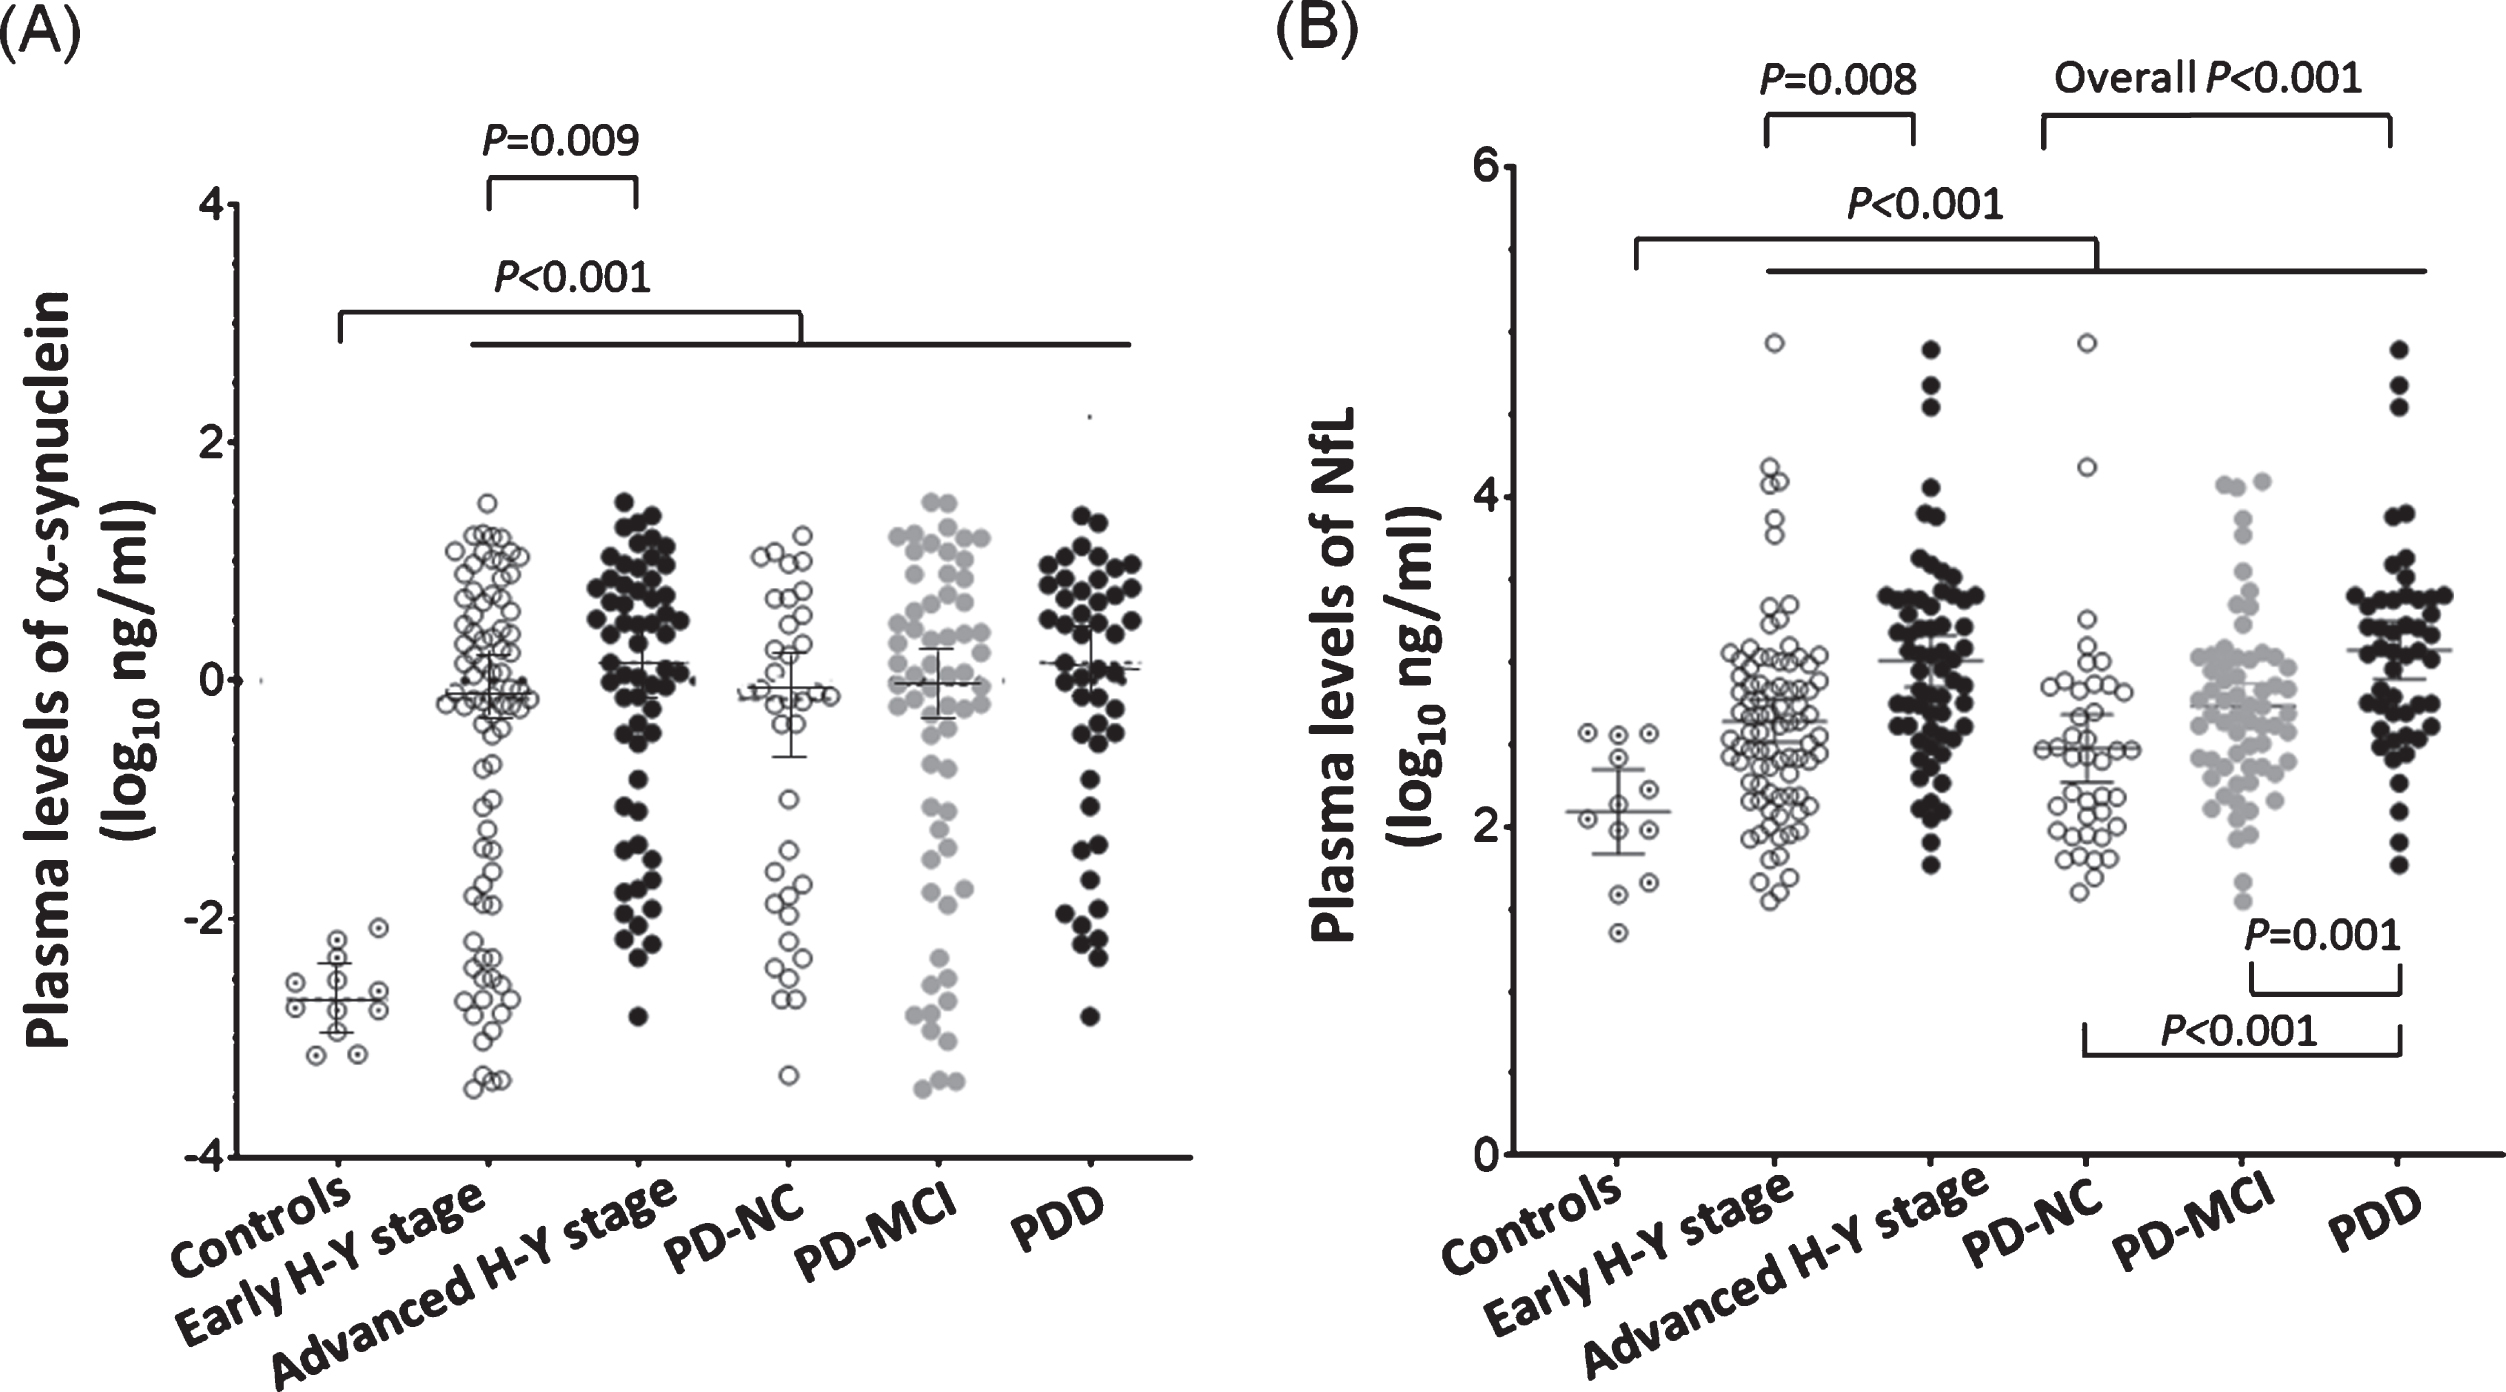
Distribution of plasma α-synuclein and NfL levels in study participants according to their motor or cognitive status. (A) Plasma levels of α-synuclein were higher in PD than the controls (P < 0.0001). Among PD patients, plasma levels of α-synuclein were higher in the advanced motor stage (Hoehn-Yahr stage 3–5) group (P = 0.01). (B) Plasma levels of NfL were higher in PD than the controls (P < 0.0001). Among PD patients, plasma levels of NfL were higher in the advanced motor stage group (P = 0.01) and more severe cognitive status group (overall P < 0.001; PD-NC vs. PDD: P < 0.001; PD-MCI vs. PDD: P = 0.001).
The global CTh was thinner in patients with PDD than in controls (2.33±0.19 mm vs 2.43±0.14 mm, P = 0.06) or PD patients with normal cognition (2.33±0.19 mm vs 2.50±0.12 mm, P < 0.001; Table 1). Among PD patients, the global CTh and CTh of most lobar areas, except the occipital lobe, were thinner and hippocampus volume smaller in the advanced H-Y stage group and PDD group (Table 1). Caudate volume did not differ significantly with different motor or cognitive status. Hippocampal volume was significantly smaller in patients with PDD (2.31±0.31‰ of total intracranial volume) than PD-MCI (2.49±0.36‰) and PD-NC (2.58±0.26‰, overall P < 0.01 by Kruskal-Wallis test, Table 1).
Correlations between plasma and neuroimaging biomarkers
With regards to the possible influence of age on plasma concentrations of α-synuclein and NfL, we examined participants of varying age. Consistent with previous studies [5, 29], we did not find any significant correlations between age and plasma α-synuclein level (Spearman’s rank correlation coefficient ρ= –0.08, 95% CI –0.17 –0.15, P = 0.92 by Spearman correlation analysis; Supplementary Figure 1A). However, plasma NfL concentration correlated with age in patients with PD (ρ= 0.56, 95% CI 0.44 –0.66, P < 0.001; Supplementary Figure 1B), which is in line with a previous study [30]. No significant correlation was found between plasma α-synuclein and NfL (ρ= –0.05, 95% CI –0.21 –0.11, P = 0.54).
Next, we examined the correlations between plasma α-synuclein or NfL levels and the CTh of individual brain regions in PD patients. Plasma α-synuclein level negatively correlated with limbic CTh after adjusting for age and sex (ρ= –0.18, 95% CI –0.34 ––0.01, P = 0.04). Plasma NfL levels negatively correlated with global, frontal, temporal, parietal, and insula CTh and hippocampus volume after adjusting for age and sex (adjusted ρ ranged from –0.21 to –0.26, P < 0.05; Table 2). Furthermore, in linear regression models adjusted for age, sex, disease duration, and MMSE scores, higher α-synuclein was associated with thinner limbic CTh (β= –0.02, 95% CI –0.05 ––0.0005, P = 0.046) and higher NfL was associated with thinner temporal (β= –0.06, 95% CI –0.11 ––0.01, P = 0.02) and insular CTh (β= –0.09, 95% CI –0.15 ––0.03, P = 0.01; Table 2).
Correlations between plasma and neuroimaging biomarkers
aρ is Spearman’s rank correlation coefficient and was partially adjusted for age and sex. bThe β coefficient indicates the changes in CTh or volume by increasing one unit of plasma biomarkers after adjustment of age, sex, disease duration, and MMSE score in the linear regression models. Numbers in bold indicate significant (P < 0.05) results.
Associations between plasma and neuroimaging features on motor and cognitive status of PD
We examined whether plasma and neuroimaging markers correlated with disease severity in terms of motor or cognitive symptoms in PD patients. When tested individually, plasma α-synuclein and NfL levels and global, frontal, temporal, parietal, and insular CTh, and hippocampus volume were all associated with UPDRS part III motor scores (Table 3). The magnitude of score change per unit of standardized biomarkers ranged from 1.73 to 3.73. Similarly, standardized plasma α-synuclein and NfL levels and global, frontal, temporal, parietal, and insular CTh were independently associated with MMSE scores (Table 3).
Multiple linear regression analysis between biomarkers and motor severity or cognitive function
aIn the linear regression models, all biomarkers were Z-transformed to achieve similar scales on the interested outcomes. The β coefficient was the change in the score of UPDRS part III or MMSE by increasing one unit of standardized plasma or neuroimaging markers. bIn the logistic models, the independent variables were quartile biomarkers of the most advanced degeneration (i.e., highest quartile of plasma biomarkers, lowest quartile of CTh or volume). All models (linear and logistic) were adjusted for age, sex, and disease duration. Numbers in bold indicate significant (P < 0.05) results.
In logistic regression models with advanced H-Y stages or PDD as dependent variables using age, sex, disease duration, and the quartiles of plasma or neuroimaging markers, we found that higher plasma α-synuclein and NfL levels, temporal thinning, and insular thinning were associated with an increased risk of advanced H-Y stage (OR ranged from 2.74 to 2.97, respectively; Table 3 and Fig. 2), whereas high plasma NfL level and temporal thinning were independently associated with an increased risk of PDD (OR 2.81 and 4.47, respectively; Table 3 and Fig. 2).
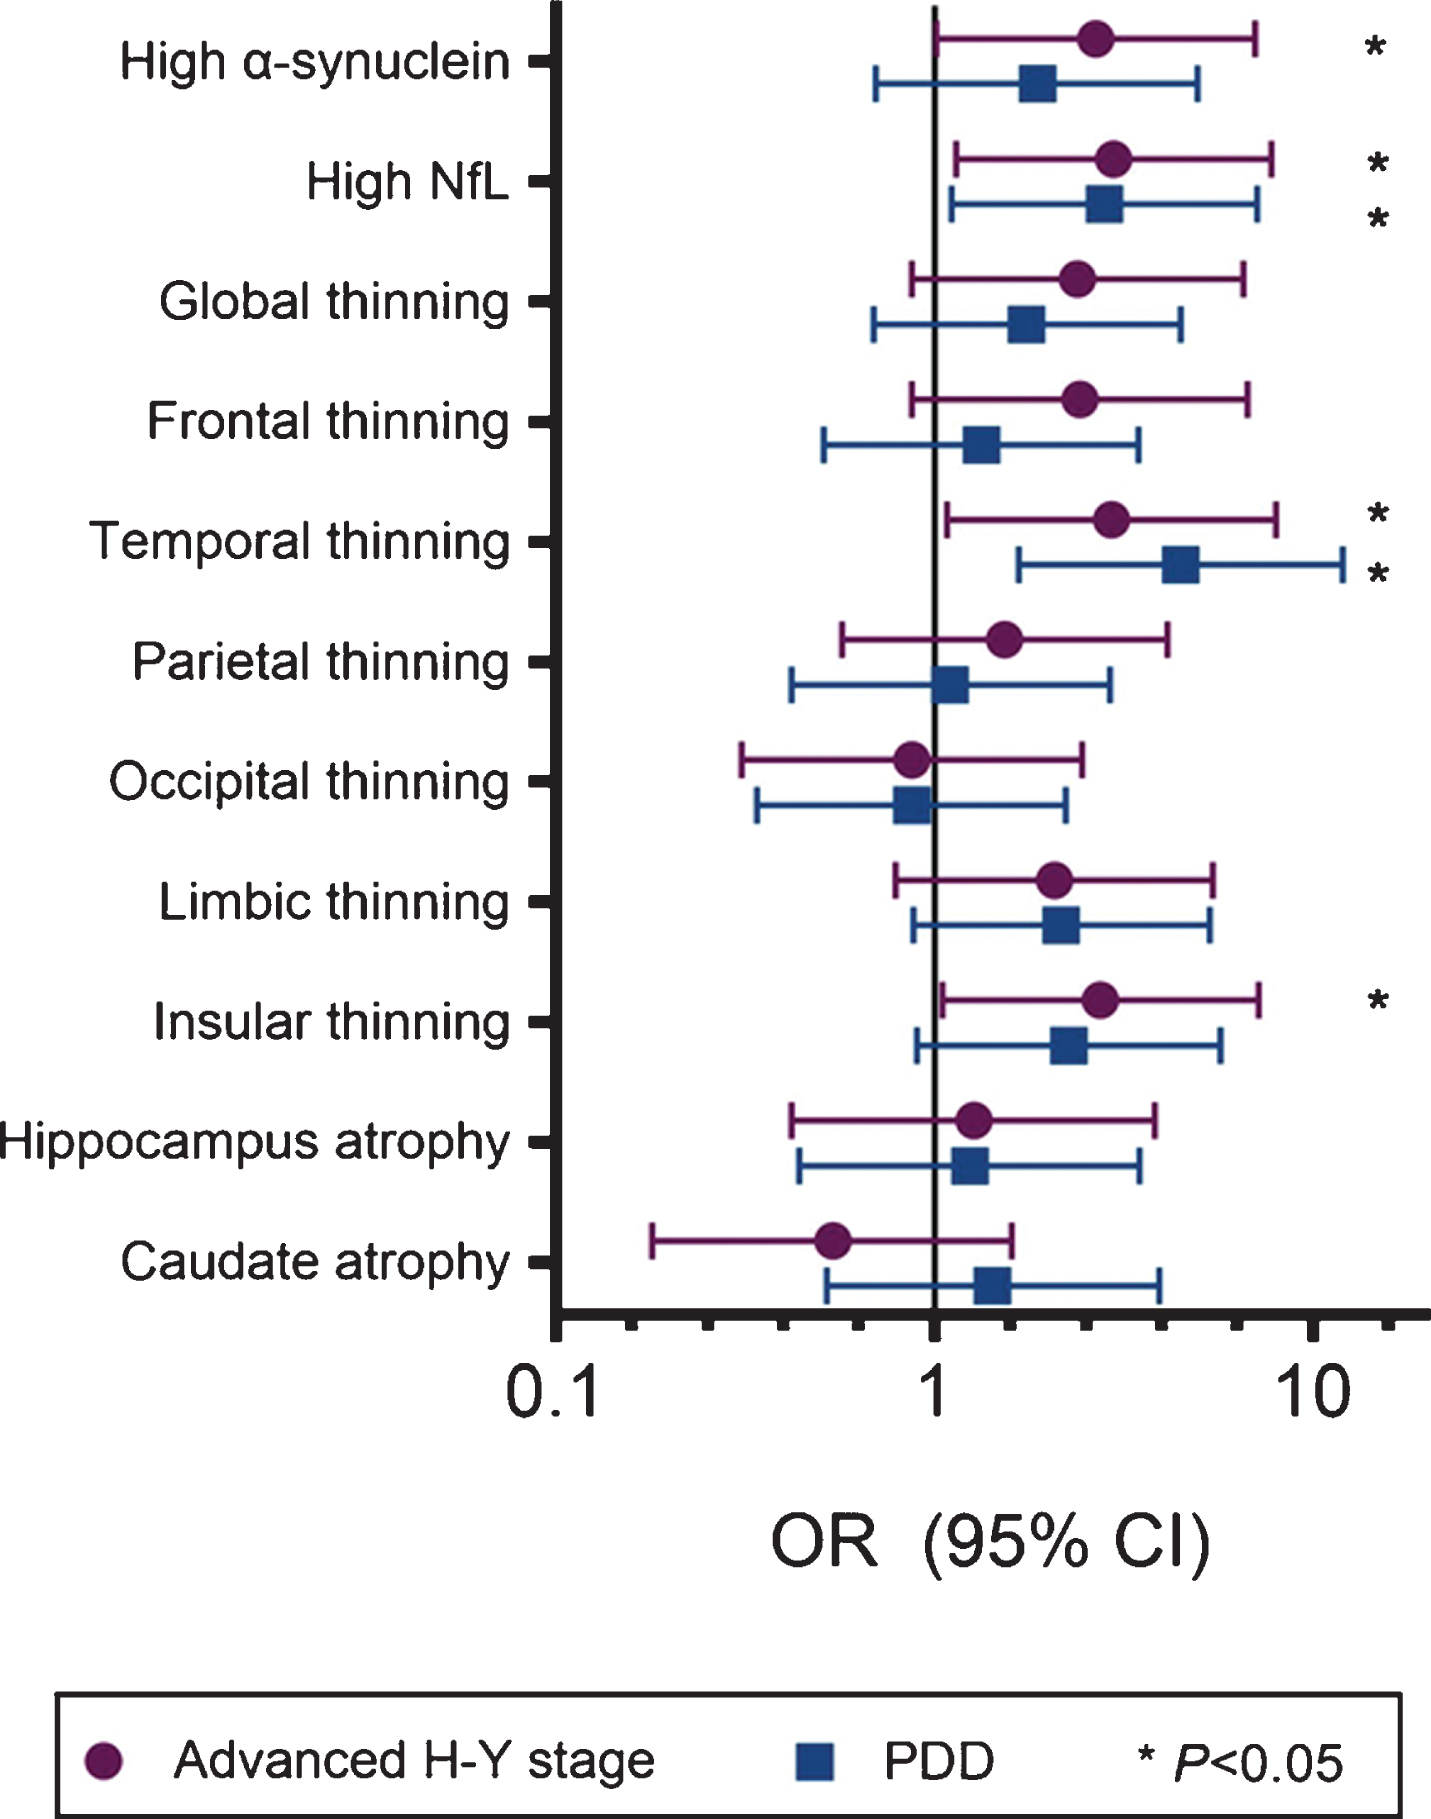
Forest plot of the odds ratio (OR) of biomarkers of motor or cognitive severity in enrolled PD patients. “High α-synuclein and NfL” was defined as the highest quartile of the plasma concentrations of individual markers. Cortex ‘thinning’ was defined as the lowest quartile of cortical thickness of corresponding regions. ‘Atrophy’ of gray matter indicated the lowest quartile of volume of individual brain regions.
Combined clinical, plasma, and neuroimaging biomarkers for prediction of motor and cognitive severity in PD
Based on the above findings, plasma α-synuclein and NfL levels, temporal CTh, and insular CTh were consistently associated with an increased risk of advanced motor and cognitive severity in PD. We further built a logistic regression analysis combining age, sex, and the aforementioned significant plasma and neuroimaging biomarkers to predict the occurrence of advanced motor stage or PDD, expressing the prediction accuracy as AUC. We used continuous variables as raw data of cortical thickness and log-transformed plasma biomarkers into the logistic models.
Predicting the occurrence of advanced motor severity, the prediction accuracy increased gradually from the basic model (age and sex only, AUC = 0.63, 95% CI 0.52 –0.74) to basic characteristics combined with the neuroimaging biomarkers temporal and insular CTh (AUC = 0.73, 95% CI 0.62 –0.83, P = 0.03). The prediction accuracy further increased with models using basic characteristics combined with plasma biomarkers α-synuclein and NfL (AUC = 0.73, 95% CI 0.63 –0.83, P = 0.01), to a full model incorporating age, sex, temporal and insula CTh, and plasma α-synuclein and NfL levels (AUC = 0.77, 95% CI 0.67 –0.87, P = 0.004; Table 4 and Fig. 3A).
Receiver operative characteristic association statistics for predicting late H-Y stage and Parkinson’s disease dementia (PDD)
The independent variables used in the models included continuous variables of age, log-transformed α-synuclein and NfL, and temporal and insular CTh, and the categorical variable of sex. aFull model indicated basic variables in addition to corresponding plasma and neuroimaging biomarkers.
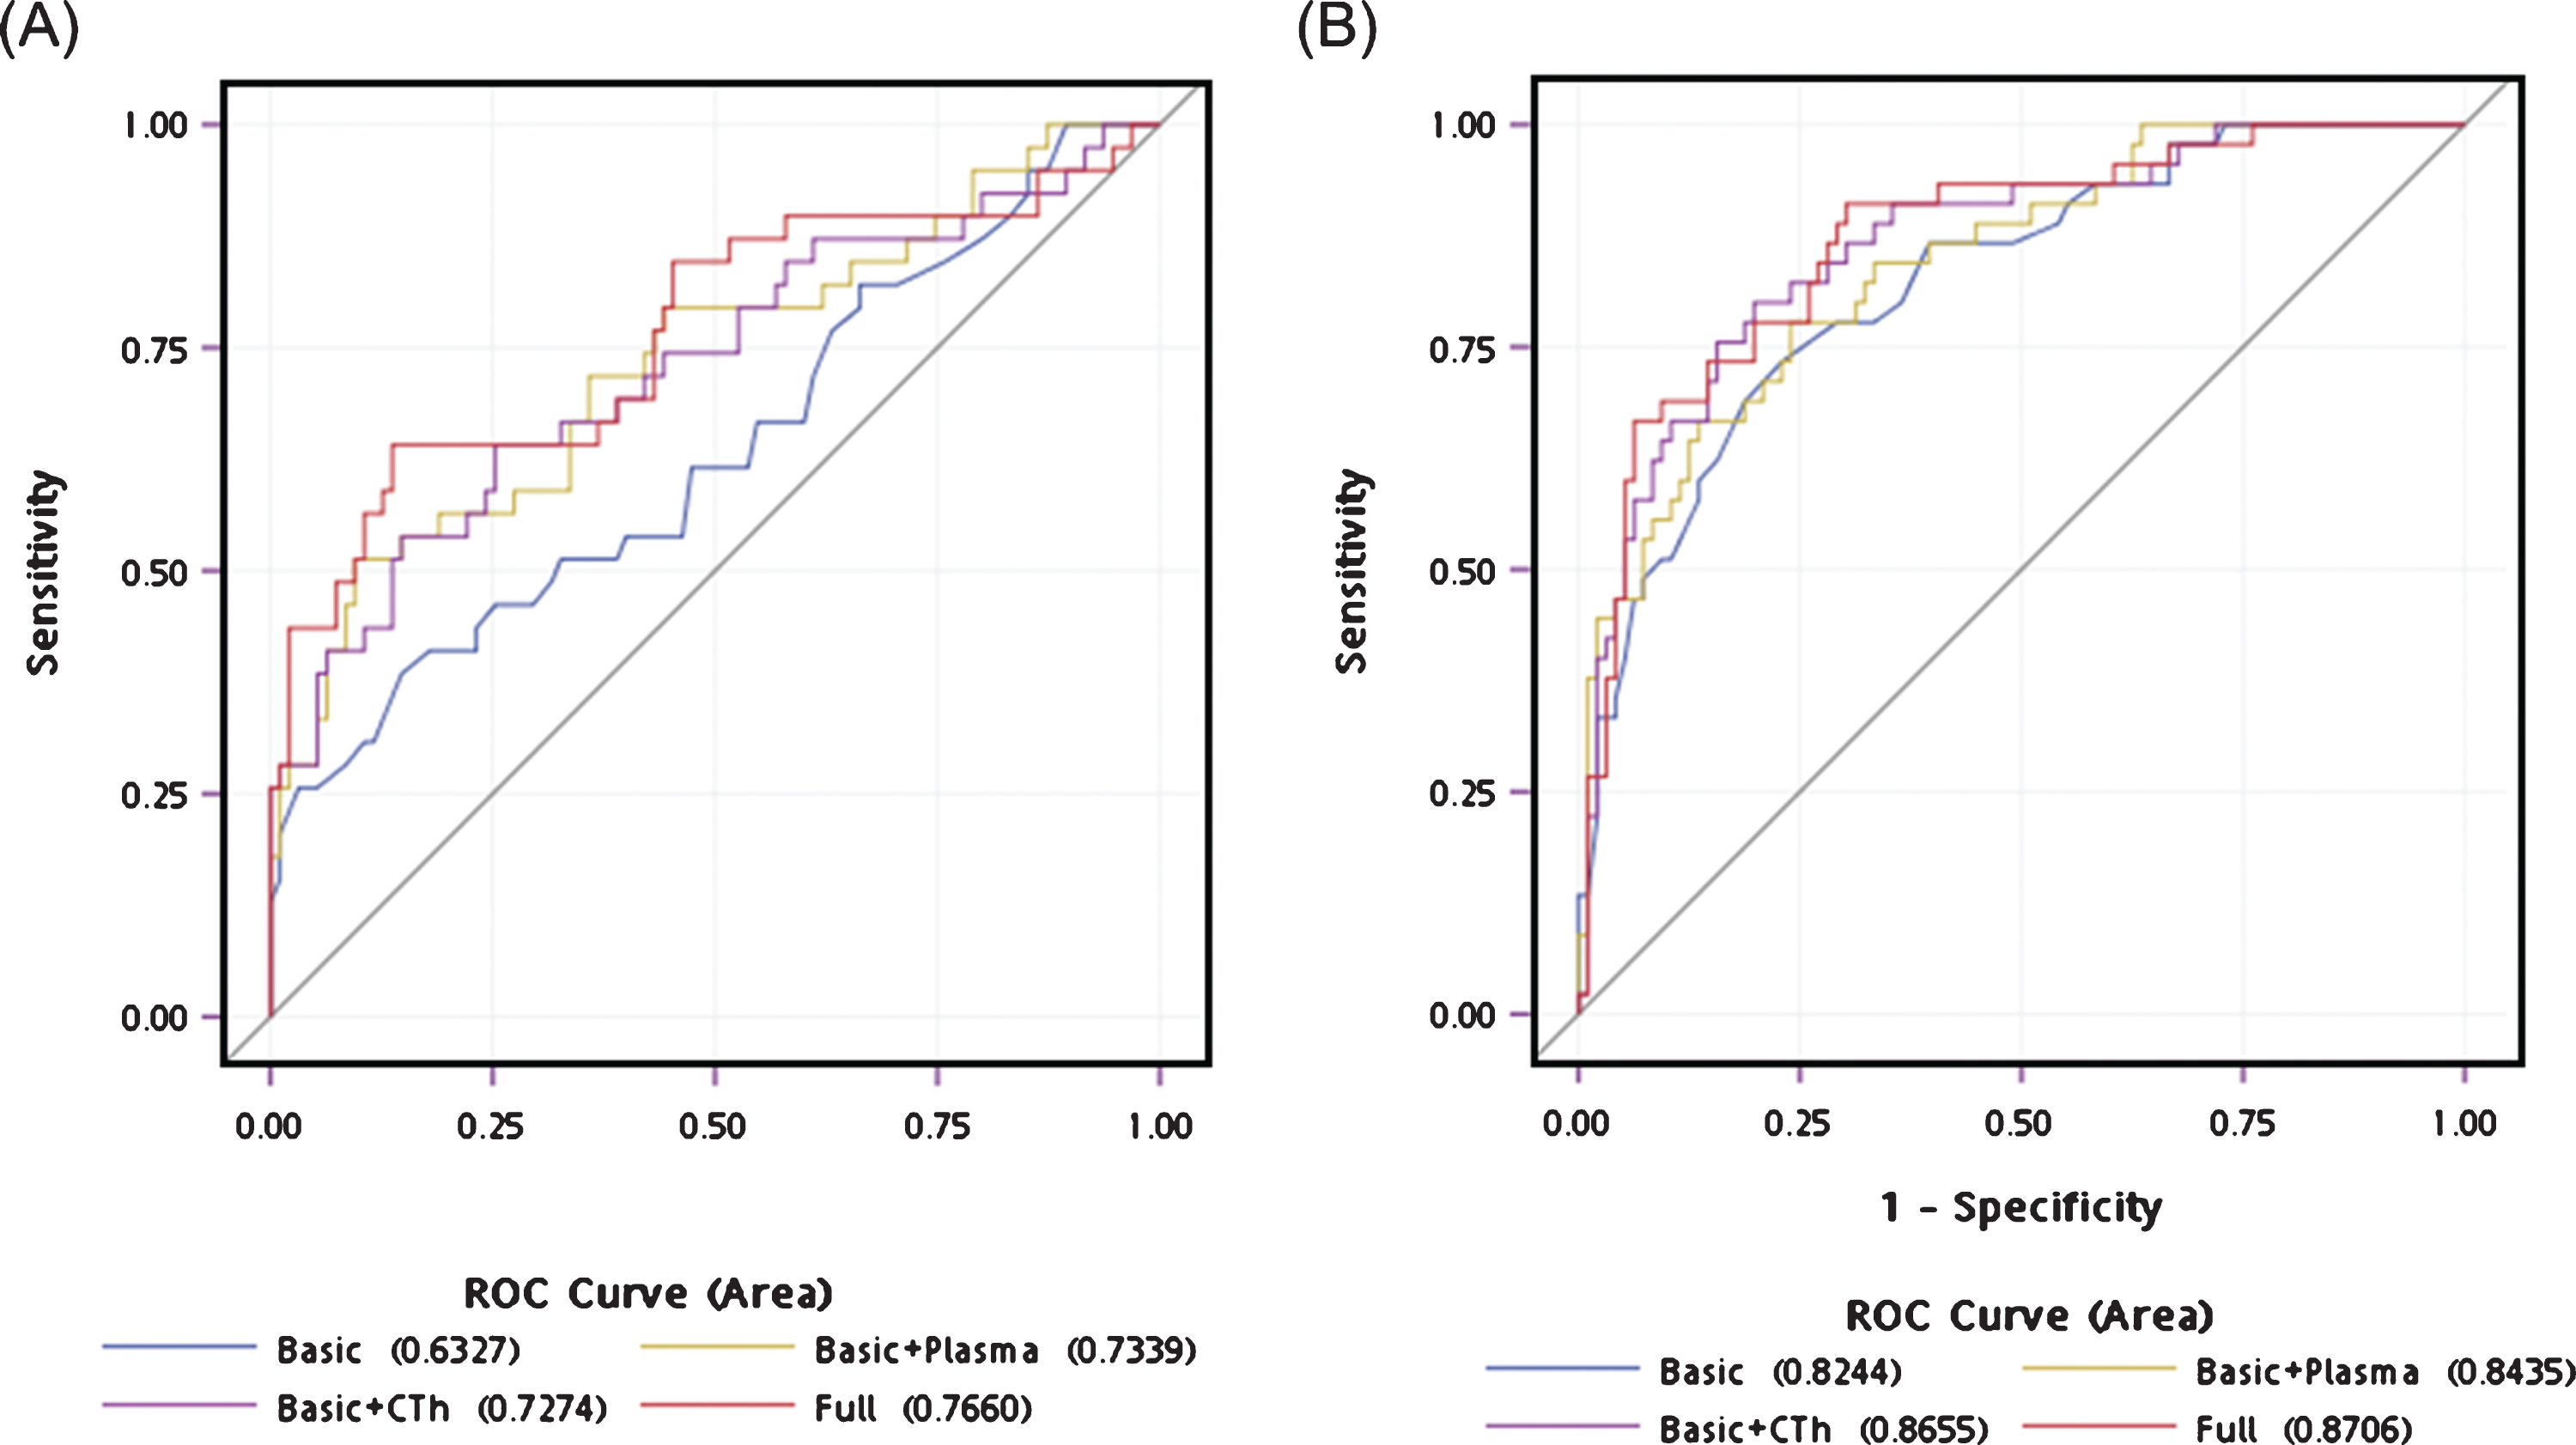
Receiver operating characteristic curves for predicting disease in participants. (A) The accuracy of predicting advanced motor stage using age and sex alone (area under curve [AUC] = 0.63) significantly improved by adding plasma α-synuclein and NfL levels and temporal and insula CTh (AUC = 0.76, P = 0.004). (B) The accuracy of predicting the occurrence of PDD using age and sex alone (AUC = 0.82) increased in a full model incorporating temporal CTh and plasma NfL levels (AUC = 0.87, P = 0.047).
For predicting the occurrence of PDD, the prediction accuracy slightly increased from the basic model (age and sex, AUC = 0.82, 95% CI 0.75 –0.90) to basic combined with plasma biomarkers α-synuclein and NfL (AUC = 0.84, 95% CI 0.78 –0.91, P = 0.23). The diagnostic accuracy further increased to basic characteristics combined with neuroimaging marker of temporal and insular CTh (AUC = 0.87, 95% CI 0.80 –0.93, P = 0.03) and the full model incorporating age, sex, temporal and insular CTh, and plasma α-synuclein and NfL level (AUC = 0.87, 95% CI 0.81 –0.93, P = 0.047; Table 4 and Fig. 3B). The Nagelkerke’s R2 index of the full model was 0.31 and 0.48 for predicting advanced H-Y stage and PDD, respectively.
DISCUSSION
In this study, we identified integrated plasma and brain MRI biomarkers that reflect PD severity in terms of both motor and cognition symptoms. We found that a higher plasma α-synuclein level is associated with a thinner limbic CTh, whereas a higher plasma NfL level is associated with thinner temporal and insular CTh. Advanced motor severity of PD correlated with the integrated model including age, sex, increased plasma levels of α-synuclein and NfL, and thinning of the temporal and insular cortex. PDD was associated with age, sex, thinning of the temporal cortex, and the plasma level of NfL.
Our findings show that both plasma α-synuclein and NfL was significantly elevated in patients in advanced motor groups compared to patients in the early motor stages. This finding is in line with a previous study in another independent cohort of PD patients showing that plasma α-synuclein levels are higher in PD patients with a higher H-Y stage [5], Consistent with our findings, plasma exosomal levels of α-synuclein measured via Western blot, Luminex assay, and mass spectrometry were previously reported to be substantially increased in PD patients compared to controls and correlated with disease severity [31]. The diagnostic sensitivity and specificity achieved by plasma exosomal α-synuclein (70 and 52%, respectively) was comparable to CSF α-synuclein [31]. On the other hand, for cognitive symptoms, plasma levels of α-synuclein only tended to be increased in patients with PDD compared to patients with normal cognition (P = 0.08). A possible explanation may come from the pathology findings in patients with PDD, which include both α-synuclein-containing Lewy body depositions, and mixed deposition with Aβ42 and tau proteins [3]. This heterogeneous post-mortem pathology could also explain our finding that α-synuclein is not a dominant contributor in the final diagnostic model for PDD when simultaneously considering other covariates, such as age, sex, and CTh changes on brain images. In addition to the PD-specific α-synuclein protein, we also examined the plasma levels of NfL, which is a sensitive but not disease-specific neurodegenerative marker [6–10]. Our finding that plasma NfL levels were significantly higher in patients with advanced motor stages or PDD than in patients with early motor stage or normal cognition are consistent with a previous study in a mixed British and Swedish cohort [11]. A recent study also showed that plasma NfL levels are increased in patients with PDD compared to normal cognitive PD patients, and that higher levels of NfL correlate with poor cognitive performance on neuropsychological tests [8]. Therefore, plasma levels of NfL contributed to both final models of advanced motor stages and PDD in our study. The diagnostic accuracy of the final models improved after adding blood NfL levels, and the blood NfL levels could be used as a surrogate indicator reflecting the neurodegenerative progression of the disease. Taken together, the results indicate that combining the disease-specific α-synuclein protein and general neurodegenerative marker NfL, in addition to age, sex, and related imaging markers, could improve the diagnostic accuracy for advanced motor severity and PDD.
This study shows that the cerebral cortex is regionally affected across different severities of PD, which may reflect disease progression. Patients with PDD or in the advanced motor stages demonstrate remarkable cortical thinning of the temporal cortex. Furthermore, adding the temporal CTh to the diagnostic model incorporating age, sex, and plasma biomarkers improves the diagnostic accuracy for both advanced motor severity and PDD. Temporal thinning in advanced PD stages is in line with many previous studies [32, 33]. This is further supported by a significant negative correlation between CTh in the temporal cortex and MMSE score, as well as disease stage [33], showing that as the disease advances, cortical degeneration extends further, and that the sequence of this extension is generally consistent with Braak’s hypothesis of PD pathological progression [34]. As the disease progresses, the pathology encroaches upon the cerebral cortex, mainly the anteromedial temporal mesocortex directly connected with the prefrontal cortex, posterior cingulate, and high order sensory association areas. Involvement of the temporal mesocortex is followed by the spread of lesions to the high order association fields of the neocortex [34]. In contrast to previous studies [33, 35], we did not find a significant role of caudate volume in the prediction model of advanced motor stage in PD patients. Regarding motor severity as measured by the H-Y stage and UPDRS part III motor scores, we found no correlation with the volumes of subcortical (basal ganglia) structures in our study, which is consistent with a previous study [36]. In addition to cortical thinning of the temporal cortex, we also identified a significant association between insular thinning and an increased risk of advanced motor severity, and a trend of increased risk of PDD. Furthermore, the diagnostic accuracy for advanced motor severity improved after adding insula CTh into the final model predicting motor severity. The insula is considered to be an integrating hub linking several functional systems involved in nigral-striatal-frontal motor, cognitive, affective, and sensory processes [37]. Though deposition of α-synuclein in the insula can directly impair receptor function and synaptic activity in this region [34], the degeneration of dopaminergic, cholinergic, and serotonergic projecting neurons to the insula may also significantly disrupt its functional integrity [38]. The subsequent loss of neurotransmitter modulation in the insula could affect information processing through heavy interconnections between the insula and different cortical regions (i.e., frontal, temporal, parietal, cingulate cortex) and basal ganglia [38]. Our neuroimaging findings are in line with the pathology findings of insula involvement in the disease process underlying PD. Our study suggests the importance of the insula in PD, acting as a hub for processing critical information related to the motor state and for integrating cognitive information.
The major strength of the present study was that we simultaneously assessed the diagnostic value of plasma and neuroimaging biomarkers combined with basic characteristics that could reflect the disease severity of PD using minimally invasive blood-based samples and brain MRI findings. We used both a disease-specific marker and widely acceptable non-disease-specific plasma biomarker combined with CTh data from brain MRI, which is a commonly prevalent structural imaging study. These combinations of biomarkers could be easily translated into widespread use in the clinical setting for longitudinal follow-up studies. However, our study has some limitations. First, the number of controls enrolled in the present was limited. However, our previous studies have demonstrated that plasma level of α-synuclein and NfL were significantly higher in patients with PD than ethnicity matched healthy control [5, 29], and a recent study of the same ethnicity also showed that plasma level of NfL were elevated in patients with PD dementia than controls [8]. Therefore, we aimed to extended further to find an integrated approach combing plasma and neuroimaging biomarkers to predict motor and cognitive severity among PD patients in the current study. Second, the clinical diagnosis was not confirmed neuropathologically and, therefore, is susceptible to misdiagnosis, especially for patients with PDD. However, the final diagnosis was based on thorough clinical and ancillary investigations, including nuclear imaging and complete neuropsychological assessment, after extensive clinical follow-up and according to international consensus criteria in a movement disorder clinic. Second, the relatively few patients with PD enrolled in the study and cross-sectional study design may limit the extent to which our data can be extrapolated to all patients with PD. Future large-scale collaborative studies utilizing stringent protocols for patient characterization and specimen collection with a long follow-up period are needed to validate our results.
In summary, our findings suggest that integrated plasma levels of α-synuclein and NfL combined with neuroimaging biomarkers and basic clinical features could provide a practical model for PD severity. Well-designed longitudinal studies with serial biomarker assays are needed to evaluate the plausibility of these integrated plasma and imaging markers in disease progression in terms of both motor and cognitive decline.
CONFLICT OF INTEREST
The authors declare no competing interests.
Footnotes
ACKNOWLEDGMENTS
We thank all the participants that participated in this study. We are grateful to the National Taiwan University Hospital (NTUH 107-S3747 and NTUH 107-N3983) for supporting this work. We also thank the staff of the Second and Third Core Labs, Department of Medical Research, National Taiwan University Hospital for technical support in the study.