
Abstract
Background:
Technology-based objective measures (TOMs) recently gained relevance to support clinicians in the assessment of motor function in Parkinson’s disease (PD), although limited data are available in the early phases.
Objective:
To assess motor performances of a population of newly diagnosed, drug free PD patients using wearable inertial sensors and to compare them to healthy controls (HC) and differentiate different PD subtypes [tremor dominant (TD), postural instability gait disability (PIGD), and mixed phenotype (MP)].
Methods:
We enrolled 65 subjects, 36 newly diagnosed, drug-free PD patients and 29 HCs. PD patients were clinically defined as tremor dominant, postural instability-gait difficulties or mixed phenotype. All 65 subjects performed seven MDS-UPDRS III motor tasks wearing inertial sensors: rest tremor, postural tremor, rapid alternating hand movement, foot tapping, heel-to-toe tapping, Timed-Up-and-Go test (TUG) and pull test. The most relevant motor tasks were found combining ReliefF ranking and Kruskal– Wallis feature-selection methods. We used these features, linked to the relevant motor tasks, to highlight differences between PD from HC, by means of Support Vector Machine (SVM) classifier. Furthermore, we adopted SVM to support the relevance of each motor task on the classification accuracy, excluding one task at time.
Results:
Motion analysis distinguished PD from HC with an accuracy as high as 97%, based on SVM performed with measured features from tremor and bradykinesia items, pull test and TUG. Heel-to-toe test was the most relevant, followed by TUG and Pull Test.
Conclusions:
In this pilot study, we demonstrate that the SVM algorithm successfully distinguishes de novo drug-free PD patients from HC. Surprisingly, pull test and TUG tests provided relevant features for obtaining high SVM classification accuracy, differing from the report of the experienced examiner. The use of TOMs may improve diagnostic accuracy for these patients.
Keywords
INTRODUCTION
A correct diagnosis of Parkinson’s disease (PD) is relevant both for prognostic and therapeutic purposes. To date, the diagnosis is still mainly based on clinical evaluation, with severity-rating that may vary depending upon the clinical expertise and patient self-reporting symptoms. Additionally, diagnostic accuracy varies considerably according to disease duration (lower on first visit than after longer follow-up), and the expertise of the clinician [1]. This is partly due to the heterogeneity of PD, featuring variable clinical phenotypes and natural history [2]. Indeed, between 5% and 25% of patients diagnosed with parkinsonism by experts do not have their diagnosis confirmed on autopsy as PD [3, 4].
Clinical evaluation mostly relies on the Movement Disorders Society Unified Parkinson’s Disease Rating Scale (MDS-UPDRS) part III, a worldwide adopted rating scale [5]. Despite its common utilization, the MDS-UPDRS has some limitations such as inter-rater and intra-rater score variability, subjectively assigned by the examiners [5]. Therefore, increasing interest has been focused on technology-based assessment of motor function in PD patients. Indeed, technology-based objective measures (TOMs) of motor performances have been proposed in order to support early diagnosis and identification of subtle motor impairment, to identify prognostic biomarkers and to monitor response to therapy and patients’ activities [6, 7]. Parkinsonian tremor has been measured by means of electromyography and/or wearable inertial sensors, focusing on differentiating to other tremor syndromes or on quantifying tremor response to therapy [8–10]. In particular, wearable sensors allowed body motion analysis either in a laboratory setting, to assess upper and lower limb bradykinesia [11, 12], or in patients’ home environment, to detect postural and gait disturbances [13, 14] and later motor complications, such as freezing of gait or dyskinesia [15–19].
However, wearable sensors-based studies have been mainly focused on advanced stages of PD, when motor impairments are more evident, whereas less attention has been paid to the early phases of the disease, when subtle motor changes can negatively influence a correct diagnosis.
In this pilot study, we extend our analysis to early PD patients, with the specific aim to detect early, subtle but measurable differences in motor capabilities between PD patients and healthy subjects. Furthermore, we also analyze the different motion profiles of the three clinically determined PD subtypes, tremor dominant (TD), postural instability-gait disability (PIGD) and mixed one (MP) [2], in order to find TOMs able to differentiate them.
MATERIALS AND METHODS
Subjects
A number of 36 newly diagnosed PD patients and 29 healthy controls (HC) were recruited at the Movement Disorders outpatient clinic, at Tor Vergata University Hospital, Rome, Italy. Idiopathic PD was diagnosed according to the MDS clinical diagnostic criteria for PD [20] and confirmed by (123)I-FP-CIT SPECT (DaT-Scan); HC were healthy age-matched control subjects recruited from non-blood relatives of PD patients who did not show any sign at general neurological examination. Their cognitive functions were also screened by means of Mini-Mental Status Examination (MMSE), being an exclusion criteria a score <24.
Exclusion criteria were age (younger than 30 or older than 80), dementia (MMSE, score <24), orthopedic comorbidities, other neurological disorders, therapy with drugs possibly interfering with motor function (e.g., antipsychotics).
The study was conducted in agreement with ethical principles of Helsinki declaration. Informed consent was obtained from each participant (RS 34/17).
Clinical evaluation
All patients were evaluated by a movement disorder specialist, with general neurological examination and clinical scales such as MDS Unified Parkinson’s Disease Rating Scale (MDS-UPDRS) section II and III, Hoehn and Yahr scale (H&Y), Non-Motor Symptoms scale (NMS) and MMSE. Patients were clinically divided according to their motor phenotype in tremor-dominant (TD), postural instability-gait difficulties (PIGD) or mixed phenotype [2].
Electronic measurement system
We adopted a wearable motion tracking device, named Movit (Captiks Srl, Rome Italy), previously validated [21–24], which on-board houses a 3-axis accelerometer (±8 g) and a 3-axis gyroscope (±2000°/s). For each motor task, we adopted a different number of Movit sensors, as evidenced in Fig. 1. Measured data were sampled at 50 Hz, whereas adequate accuracy and resolution of the device were guaranteed by a manufacture’s modified Kalman filter, useful for on-purpose reductions of noise and drift problems of the sensors [21]. Our measurements were carried on using a network of up to 9 Movit located on different body segments, according to the different motor tasks. A receiver connected to a personal computer (CPU i5 by Intel, 8 MB Ram) synchronizes the data stream, and an application, named Captiks Motion Studio (Captiks Srl, Rome, Italy), stores and uses data to animate an avatar which replicates the human movements in real-time.
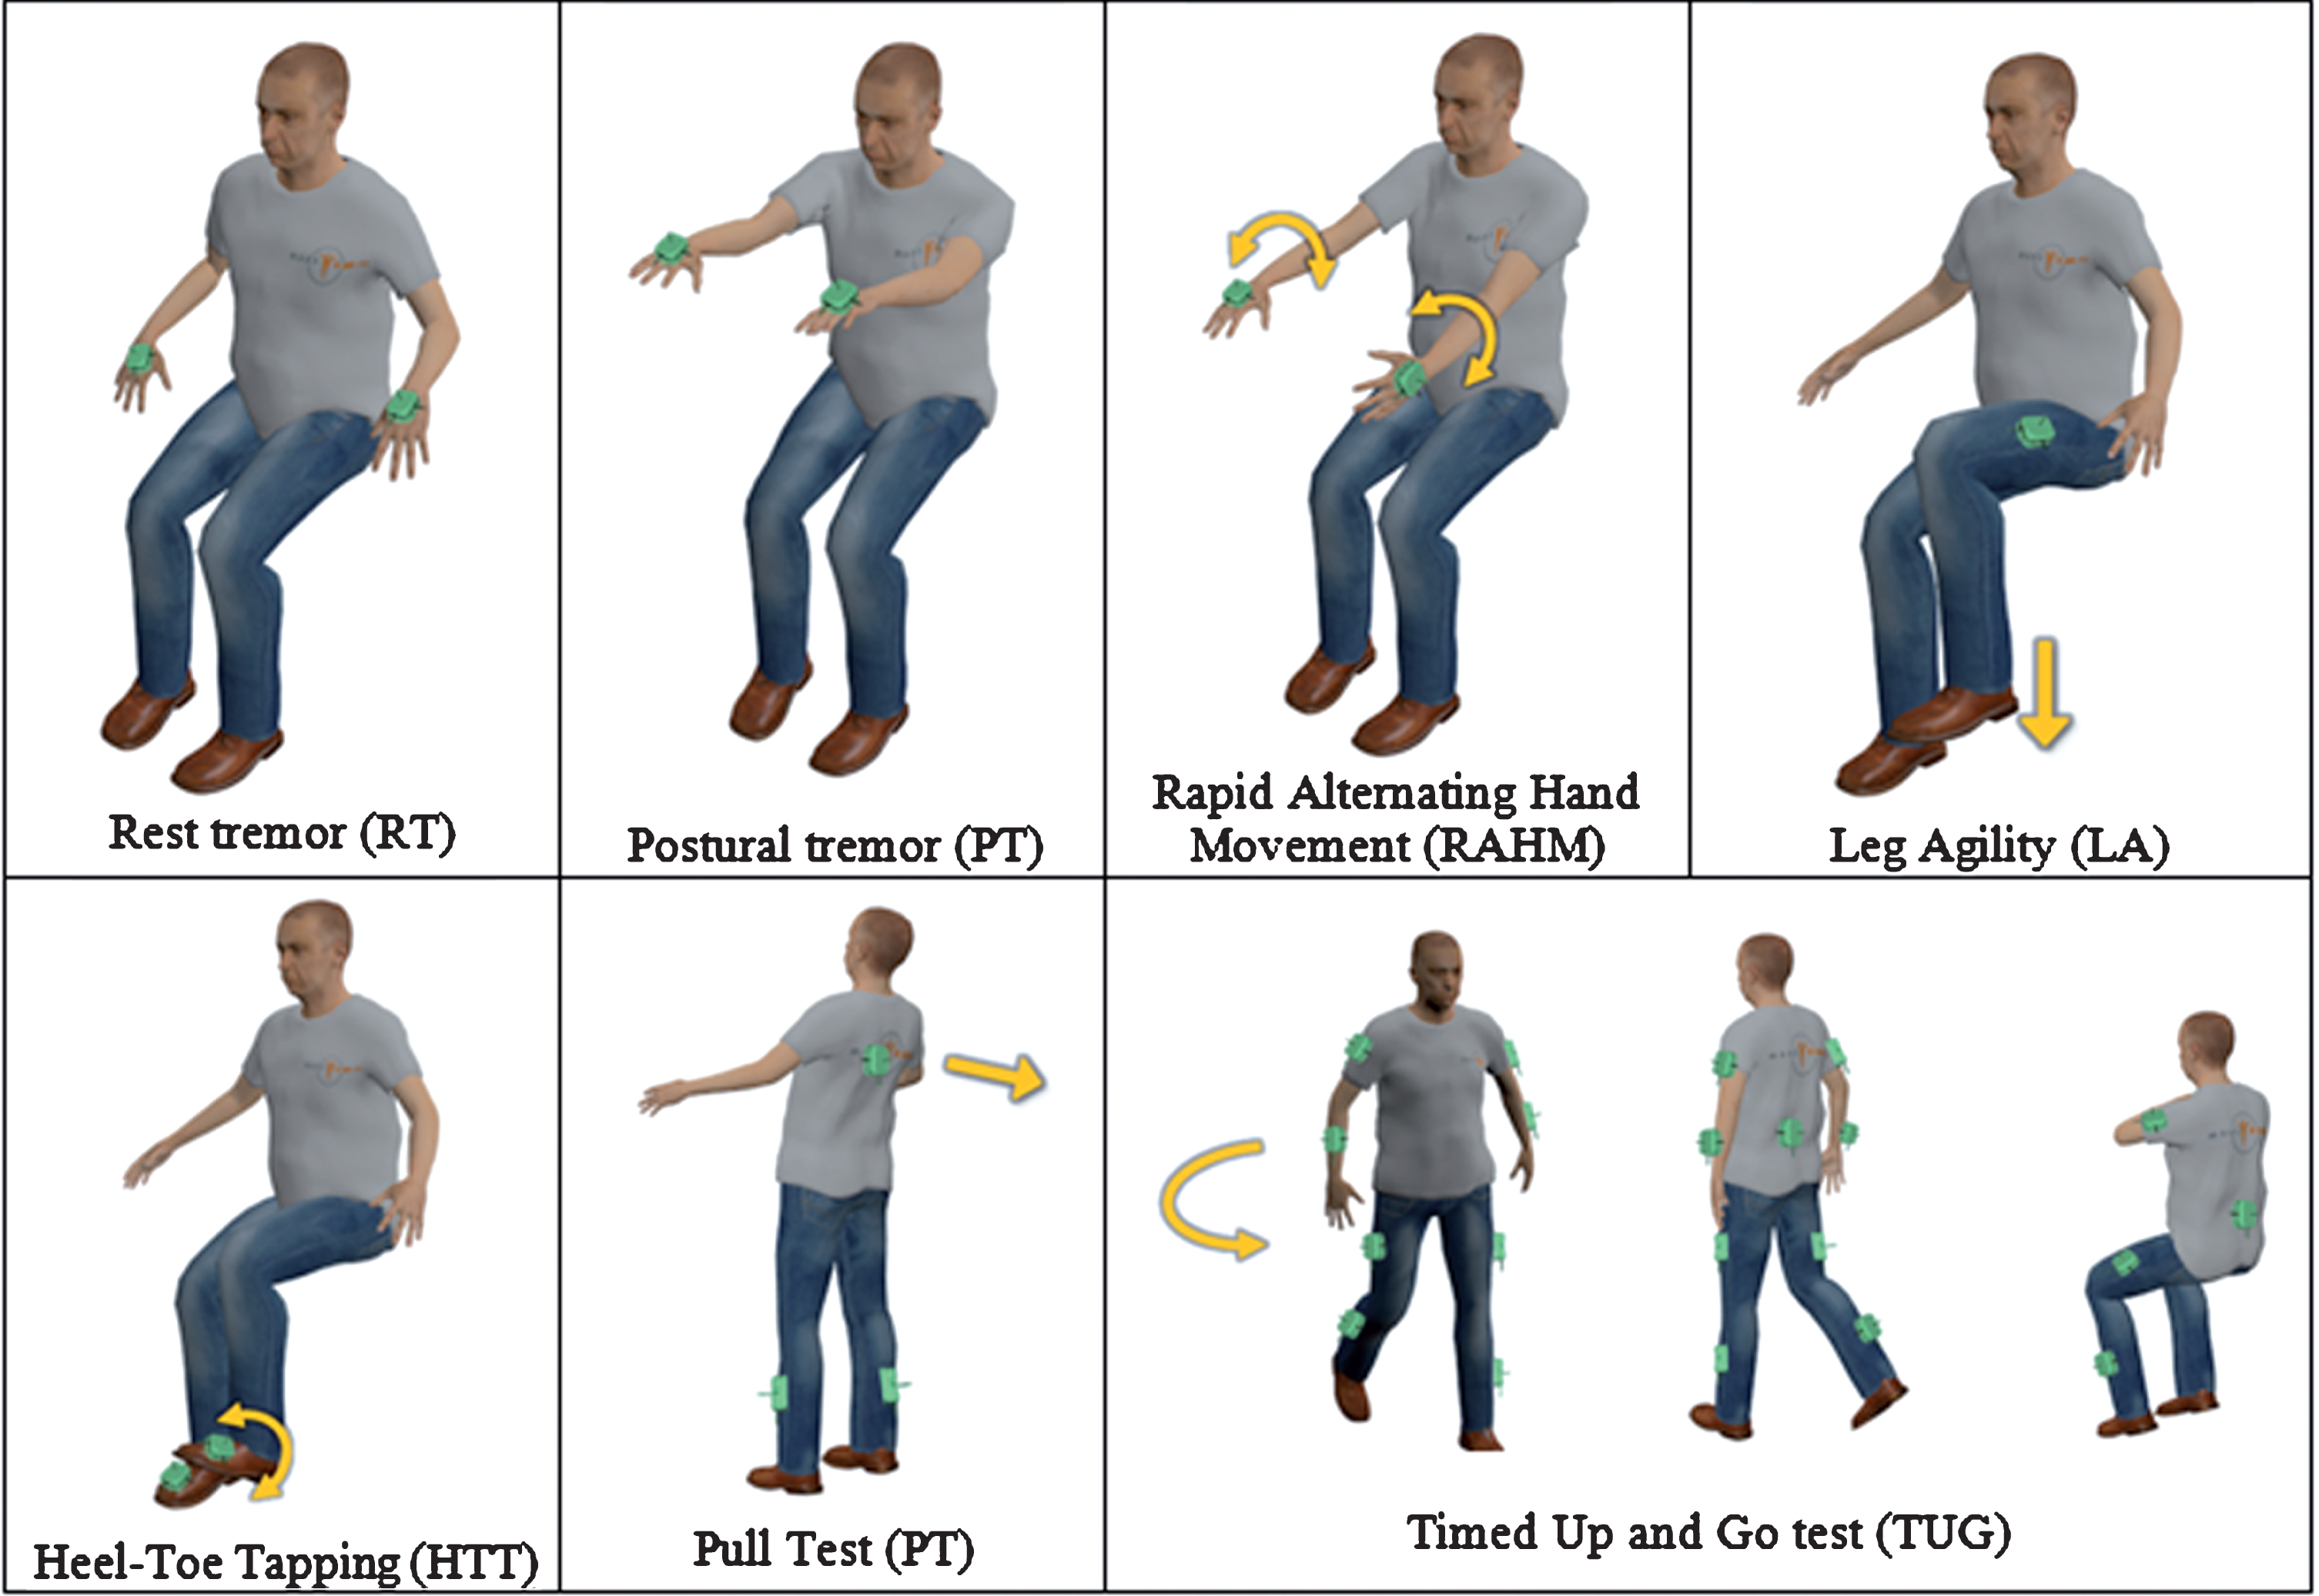
Sensor number and placement during each task. The sensors are represented in green and are placed on the hands in tremor and RAHM tasks, on the thighs in LA, feet in HTT, calves and trunk in PT and on legs, arms and trunk in TUG test.
Motor tasks
We requested each participant to perform seven motor tasks, which, according to clinic standards, are relevant for a comprehensive evaluation of tremor, bradykinesia, gait and postural disturbances: Rest Tremor (RT), Postural tremor (PosT), Rapid Alternating Hand Movement (RAHM), Leg Agility (LA), Heel-Toe Tapping (HTT), Pull Test (PT) and Timed Up and Go test (TUG). In particular, RT, PosT, RAHM, LA and PT correspond to the items 3.17, 3.15, 3.6, 3.8 and 3.12 of MDS-UPDRS III, respectively; HTT is to assess lower limb agility and coordination; TUG is a clinical test commonly used to assess mobility and gait (Fig. 1).
Specifically:
Rest tremor (RT)
The subject sits comfortably with his/her hands on the armrests of the chair for at least 30 s, while no cognitive tasks are performed. The sensors are placed on the backs of the hands.
Postural tremor (PosT)
The patient stretches the arms forward with the palms facing down for 30 s. The wrist must be straight, and the fingers open comfortably, so that they do not touch each other. The sensors are placed on the backs of the hands.
Rapid alternating hand movement (RAHM)
The subject, comfortably seated, raises arms forward (to about shoulder height), and for 15 s pronates/supinates hands [25, 26], with rotations as fast and complete as possible. One sensor is placed on the dorsum of each hand.
Leg agility (LA)
The subject, seating on a straight-backed chair with armrests, alternatively and rhythmically raises-lowers the feet “heavily” on the floor, as high and as fast as possible, for 15 s. The sensors are placed on the thighs to gather rotational velocity around the medial-lateral axis of the limb.
Heel-Toe Tapping (HTT)
The subject, seating as in LA test, rhythmically taps alternating heel-toe on the floor, as fast as possible with a rotation of the ankle as a complete as possible, for 15 s. The sensors are placed on the insteps to gather angular velocity around the medial-lateral axis trough the gyroscopes.
Pull test (PT)
The subject, comfortably standing upright with the shoulders to the examiner, is rapidly and vigorously backward pushed on his/her shoulders so to be forced to make one, or more, steps backwards for recovering his/her balance. The sensors were placed on the trunk and the ankles.
Timed Up and Go test (TUG)
The subject starts seated on a straight-backed chair with arms across the chest, gets up, walks 6 meters in a straight line, turns around, walks back and sits down to the initial posture. The sensors were placed on the patient’s pelvis, trunk, thighs, ankles, arms and forearms.
Features
For each task we considered the features as reported in Table 1.
Description of the features extracted from each motor task. The features selected by the classifier for PD-HC discrimination are in bold
RT and PosT
In order to detect tremor, the angular velocity signals from each axis of the sensors were analyzed separately. We computed the power spectral density (PSD) within 3-12 Hz. As criteria to identify if tremor was present and the main rotation axis, we calculated the area of PSD from 3 to 12 Hz (which represent the frequency band where tremor occurs) and then divided it by the total power of the signal (that covers all the frequencies of the signal). For the detection, we consider that tremor occurs when the ratio is larger than 0.7 as threshold. The threshold was set empirically to 0.7 by comparing the sensor results to the clinical evaluation. Then, features Power (area of PSD from 3 to 12 Hz) and Amplitude (amplitude of the PSD corresponding to the fundamental frequency) were computed.
RAHM, LA and HTT
The movement repetitions were segmented, in correspondence of the peaks/valleys of the angular velocity around the main rotational axis, into single movements [22]. Then, we considered seven features. The Amp (amplitude) is the mean peak of the angular velocity, normalized by the number of peaks. CV is the coefficient of variation of the periods between two consecutive repetitions whereas Amp_CV is the coefficient of variation of the amplitude of the peaks of the angular velocity. The Asym, underlines asymmetry movements between the hands, especially reported in the early stage of PD disease. It is the difference in peak angular velocity between the faster and slower hand, normalized to the larger value in percentage. The Amp_Decr (amplitude reduction over time), is the ratio between the mean angular rate of repetitions in the first third and the last third. The Power is the maximum value of the power spectral density of the signal and the Asym Power is the difference in maximum power spectral density between the faster and the slower hand, normalized at its larger value in percentage.
PT
We considered twelve features. The #steps is the number of steps following the push. The six features, named Range, are the ranges of the accelerations and angular velocities in the three directions. The ROM is used to assess the trunk mobility by means of its angular range of motion. The Jerk is the time derivative of acceleration in medial lateral and anterior posterior directions. The Sway_Area considers the ellipse that encompasses 95% of the values of medial lateral and anterior posterior acceleration related to their mean values).
TUG
TUG task is segmented into its main four phases, according to data from the sensor placed on the hip, that are, sit-to-stand, walking, turning and sitting. The start and the end of the turning and the sit-to-stand/sitting phase were defined by thresholds applied on the data extracted from the sensor placed on the hip, using the method described in [22].
We considered 38 features, described in Table 1, which consist of: Temporal parameters of the gait such as number of steps, cadence, stance, swing and double support. Upper/lower body movements related features such as the range of motion of arms and legs (Flex Arm, Flex Leg), the average angular velocity (Average Vel) of arms, forearms and thighs, and the asymmetry between right and left limbs (Asym Arm, Asym Leg). Turning parameters such as the angular velocity of the trunk (Peak Turning Vel), the turning velocity (Turning Vel) and number of steps (Steps Turning). Trunk mobility parameters such as the angular range of motion of the trunk during the walking (ROM_trunk) and the sit-to-stand phase (Flex Trunk SitStand).
Statistical and classification methods
In order to correctly discriminate PD patients with respect to healthy subjects, we found, among all the measured features, the most relevant lower-dimensional subset, in terms of accuracy in assessing tremor, bradykinesia, gait and postural impairment, combining ReliefF ranking [27] and Kruskal– Wallis [28] feature-selection methods. In particular, ReliefF algorithm selects features estimating their capability of distinguishing between instances that are near to each other, as successfully adopted for human movements [29, 30]. Kruskal– Wallis regards a non-parametric test to determine the significant features between two or more classes. The subset was used for implementing classifications by means of Support Vector Machine (SVM) classifier to distinguish PD from HC. The SVM classifier was chosen because it proved to achieve the best performances in term of discriminating PD [22]. The classifier was trained using leave-one-out cross-validation. Then, to evaluate the importance of each task in the discrimination of PD, we performed the SVM classification analysis, leaving out one task at a time.
Finally, one-way ANOVA was first performed to detect statistically significant differences between PD phenotypes (TD, PIGD and MP subtypes) for each motor feature. Then, we analyzed the differences between TD and PIGD subtypes in order to find the most relevant features to describe the different aspects of the parkinsonian syndrome.
RESULTS
In agreement with the early disease stage, patients had a mean MDS-UPDRS III score of 22.3±9.1 and mean H&Y stage 1.8 ±0.6 (Table 2). 11/36 patients exhibited at baseline a clinical TD phenotype, 16/36 a PIGD phenotype, and 9/36 a mixed one (MP); there were no statistically significant differences in age and sex between HC and PD and between PIGD, TD and MP patients. Even if TD patients reported a longer symptoms duration (3.6±3.5 years vs 1.5±1.3 years, p = 0.003), their total MDS-UPDRS II and III and H&Y scores did not differ significantly (Table 2). On the other hand, accordingly with the different phenotype, PIGD patients had higher scores in bradykinesia and rigidity items and lower in tremor items when compared to TD patients (Table 3).
Clinical data of PD patients and HC and of TD, PIGD and MP patients. y, years; M, male; F, female. Age, Symptom duration, H&Y, MDS-UPDRS II and III values are expressed as “mean±standard deviation (range min-max)
MDS-UPDRS III scores of PD patients considered together and divided accordingly to their phenotype (TD, PIGD and MP). Items 3.1 to 3.18 are grouped in main clinical domains and are listed into brackets. Values are expressed as “mean±standard deviation (range min-max)”
For PD-HC classification, 19 features from all the tasks were selected combining ReliefF and Kruskal– Wallis feature-selection methods by the classifier (Table 1). In particular: Power asymmetry, motion amplitude, time variability (CV) and the asymmetry were selected from RAHM; Power, speed variability and amplitude decrement from HTT; Motion amplitude from LA; Power of tremor was considered from RT and PosT; Number of steps, the jerk and the range of motion along the medial-lateral axis were the feature selected from PT; Average speed of legs and forearms, range of motion of arms, number of steps during turning, the average turning speed and the turning time from TUG.
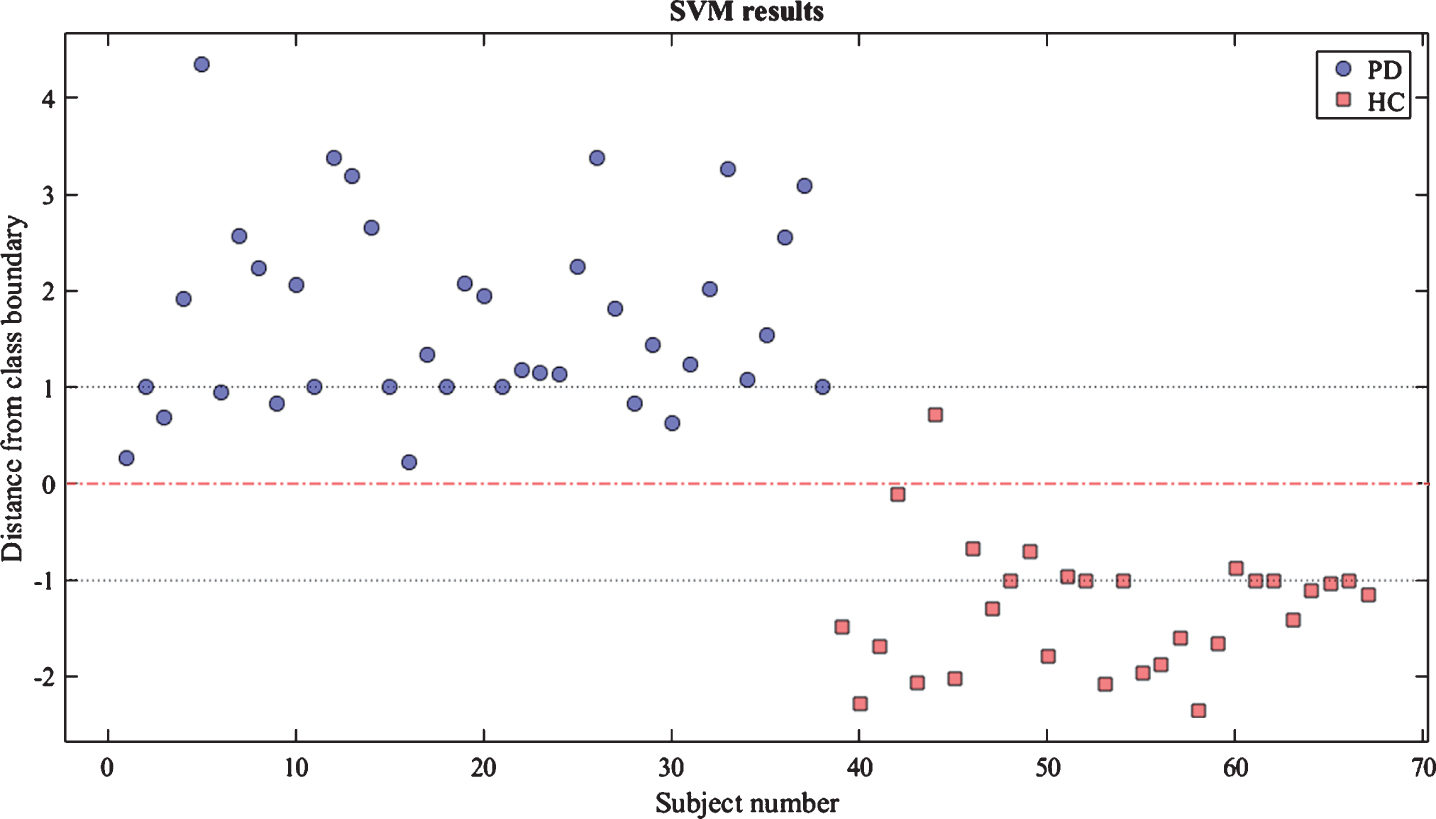
Considering all the tasks, the SVM classifier performed with an accuracy as high as 97% in discriminating the two groups (Fig. 2).
PD-HC classification results: each dot represents a subject and its position with respect to the class boundary. Subjects with values > 0 are classified as patients while the ones with values <0 are classified as healthy.
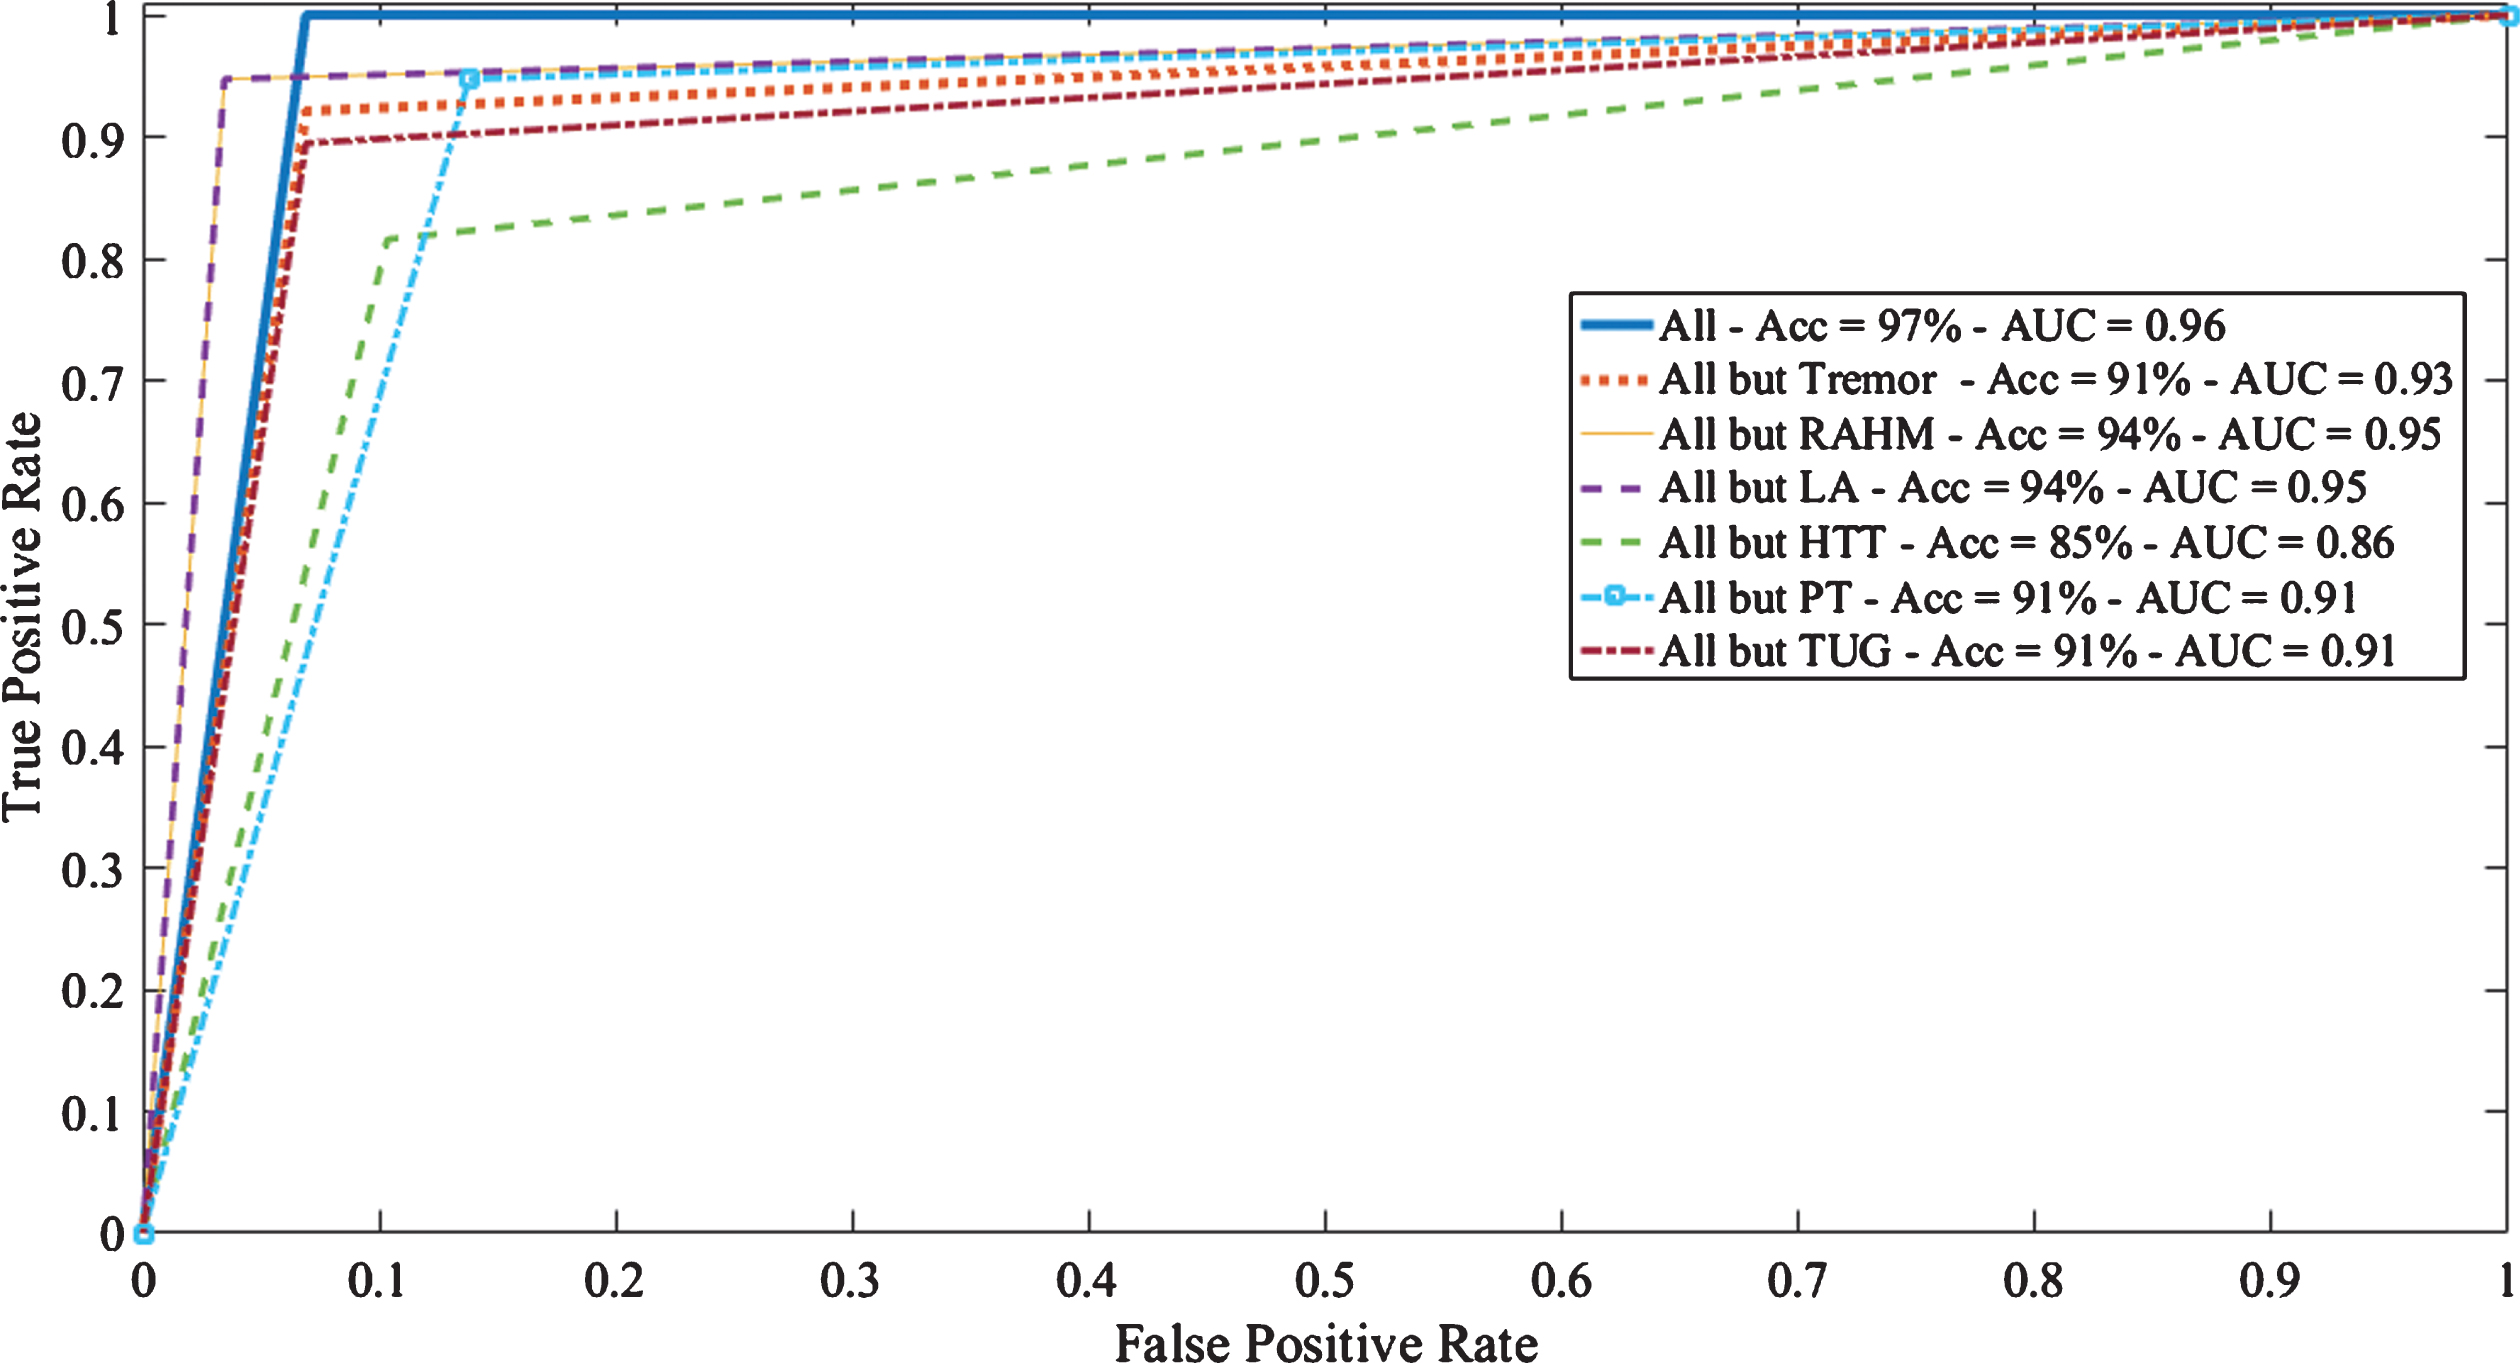
Leaving out features from one task at time, the accuracy dropped to 94% without considering RAHM or LA tasks, to 91% without tremor tasks or TUG or PT, and to 85% without HTT, respectively. The accuracy values for SVM classifier considering the entire set of tasks and excluding one task at time are reported in Fig. 3.
Area Under the Curve (AUC) for the support Vector Machine (SVM) classifier between PD and HC including all tasks and excluding one task at a time. Accuracy and AUC values are reported for each curve.
In supplementary Tables 1–7 are reported mean and standard deviation values of each motor feature of RT, PosT, RAHM, LA, HTT, PT and TUG task for TD, PIGD and mixed subtype and control subjects for comparison. As expected, TD patients perform with a higher value of the Power in both tremor tasks (RT and PosT). Low numbers of features from bradykinesia related tasks (RAHM, LA, HTT) are statistically different between the two groups: PIGD patients show reduced amplitude of movement (Power in RAHM and Amp in HTT) with the respect to TD counterpart. Three features from PT resulted particularly relevant in PIGD patients with respect to the TD counterpart, i.e., the number of steps, the jerk and the acceleration range in the direction of the push (Range_Acc_AP).
Ten features resulted statistically significant to differentiate TD vs. PIGD. These features are related to gait metric (Stance, Swing, Double Support and their CV) and upper body movements (ROM_ML, Flex Arm, Average_Vel_Forearm, Average_Vel_Arm).
DISCUSSION
Our results demonstrate that wearable devices help discriminating parkinsonism vs HC, particularly in the early disease phase. In particular, wearable sensors offer interesting insights on the range of relevant and detectable motor abnormalities, as compared to clinical evaluation.
According to the revised MDS clinical diagnostic criteria for PD, parkinsonism is defined as the combination of bradykinesia and either tremor, rigidity or both [20]. Axial signs as postural instability or gait abnormalities are not even part of the supporting criteria. Indeed, those features are usually reported in later stages of classical PD [31]. Accordingly, most of our patients scored 0 in PT and gait and posture MDS-UPDRS items. In contrast, among the nineteen features here selected for the classification analysis, nine belong to PT and TUG test, demonstrating that subclinical alterations in postural responses and gait abnormalities are key elements in discriminating early PD patients with respect to HC. Such a result is in accordance to a recent work, showing better “sensitivity” of wearable sensors in detecting early axial sign in PD patients with respect to the visual examination [22].
To further support this finding, we performed the classification analysis excluding one task at time and found that PT and TUG test added each a 6%, for a summing 12%. Surprisingly, only considering PosT and RT features together reached the same relevance in supporting classification accuracy as TUG or PT. With regard to bradykinesia, the key clinical feature for defining parkinsonism, the only task displaying consistency more than TUG and PT, was HTT. Indeed, without HTT, accuracy dropped to 85%; on the other hand, both RAHM and LA contributed only for a final 3% increase in the accuracy. Due to the physical characteristics of our device, we could not assess finger tapping task with sensors. They would have probably improved further the detection accuracy of parkinsonian features, even if, at some degree, they would have overlapped with the other bradykinesia items.
These results provide evidence for TOMs as an integrative and complementary way to assess PD patients. Indeed, detection of motor alterations that otherwise could be considered normal might be of support in the early identification of distinct phenotypes. For instance, in our sample, patients with a TD phenotype, known to be a benign phenotype, had less marked alterations in PT and TUG test when compared to PIGD patients. We could then speculate that subclinical postural alterations could be an early biomarker of progression in PD, although further studies with a longer follow-up are mandatory, to confirm this hypothesis.
This novel, global, non-invasive and inexpensive wearable technology-based approach allowed us to differentiate parkinsonism from HC subjects with an excellent accuracy, delineating a possible objective instrument to support the diagnosis of PD in the early stages of the disease. Furthermore, it may allow clinicians to have a detailed characterization of each patient’s motor phenotype in order to perform an instrumental follow-up, calibrating therapeutic interventions to a valid and measurable outcome.
Despite these considerations, a note of caution should be acknowledged. First, longitudinal data are needed to further support our findings and confirm the validity of TOM as early biomarkers of disease progression. Secondly, we did not use a test-retest design, so we cannot exclude variability due to participants’ physical or mental condition. To minimize this effect, we performed the study at the same time of the day for HC and parkinsonian patients. Furthermore, no dopaminergic therapy was dispensed to the patients, no fluctuations due to dopaminergic drug intake can be advocated. Since we excluded patients with cognitive impairment and orthopedical comorbidities, we can exclude that these conditions influenced our kinematic analysis of motion in our sample. Finally, another limitation is that the whole assessment as performed in this study is time consuming, and consequently it cannot be part of an ordinary visit in an outpatient clinic [32, 33]. In fact, these are preliminary data aimed at selecting the most relevant features to then design shorter assessments with easier setups, excluding the less relevant features from the analysis. Indeed, further studies, on larger cohorts, are warranted in order to standardize these measures and test their reproducibility.
Conclusions
The opportunity to objectively detect parkinsonian features in an initial phase of the disease, when neurologic signs are milder, is crucial for supporting clinical evaluation, which has many shortcomings including low intra-rater and inter-rater consistency and discriminative power, false-positive and false-negative predictions, and lack of sensitivity to small changes in balance control over time.
We found an excellent accuracy in the classification of parkinsonian patients with respect to HC. In particular, we highlighted which motor tasks are more relevant for classification purposes. Our approach also proved to be useful in phenotyping patients’ motor performances, uncovering subclinical postural responses and gait abnormalities. The adopted TOMs might thus provide a reliable tool to support clinicians in diagnosis, identifications of patients with poorer prognosis, and a more objective evaluation of the response to pharmacological therapy.
FUNDING STATEMENT
This research did not receive any specific grant from funding agencies in the public, commercial, or not-for-profit sectors.
CONFLICTS OF INTEREST
GS and FG owe 6% each of Captiks srl. The other authors declare no conflicts of interests.
DATA AVAILABILITY
The data used to support the findings of this study are included within the article.