
Abstract
Background:
Individuals experiencing apathy in Parkinson’s disease (PD) have a lack of emotion and motivation. Apathy often overlaps with comorbidities such as depression, and is sometimes difficult to detect.
Objective:
To examine diagnostic accuracy of apathy-screening tools compared with a gold standard (clinician diagnosis) among adult outpatients with PD.
Methods:
A systematic review was conducted. Six research databases were searched to May 23, 2018. Diagnostic accuracy measures, including sensitivity and specificity were gathered.
Results:
1,007 full-text articles were reviewed with seven full-text articles included. The gold standard was considered a clinician diagnosis as apathy is not defined in the DSM/ICD. Diagnostic accuracy measures were reported for the Lille Apathy Rating Scale (LARS) both informant- and observer-rated, Unified Parkinson’s Disease Rating Scale (UPDRS), Apathy Scale (AS), Apathy Evaluation Scale (AES), Non-Motor Symptoms Questionnaire (NMS-Q), and Dimensional Apathy Scale (DAS). The AES had the best reported sensitivity and specificity values, both 90%. The AS had the highest reported specificity at 100%, with 66% sensitivity. Pooled prevalence of apathy was 29.1% (95% CI 21.5%–36.6%).
Conclusions:
While 18 screening tools exist to screen for apathy in PD, only six have been validated against clinician diagnosis. The AES had the highest reported sensitivity and specificity and is a brief, easy to use tool. The AS was designed specifically for use in PD populations and has the highest reported specificity. Future research should focus on the development of an accepted gold standard, to further understand accuracy measures of all available apathy screening tools.
INTRODUCTION
Individuals experiencing apathy in Parkinson’s disease (PD) have a lack of emotion, passion, and motivation [1–3]. It is reported 40% of individual’s with PD experience apathy [4]. These individuals have greater cognitive impairment, disease progression, and disability [5–8]; caregiver burden is also amplified, as apathy may be difficult to understand [9, 10].
Apathy often overlaps with other comorbidities such as depression, and is sometimes difficult to detect or distinguish [11]. Symptom overlap between apathy and depression may also result in the use of depression treatments to manage apathy, however treatment approaches between apathy and depression vary [12]. A crucial first step towards the development of improved management is the ability to accurately detect apathy.
The use of apathy screening tools can aid in the detection process. There have been 18 screening tools identified for detecting apathy in PD [13]. These tools offer health care practitioners the ability to identify apathy as a symptom and syndrome of PD. When using a broad tool such as the neuropsychiatric inventory (NPI), apathy is considered a symptom [14]. When using an apathy specific tool, it can be considered a syndrome, comprised of a number of symptoms that characterize its presentation [14].
It is important to understand the validity of these screening tools such that the most accurate tool can be recommend for use in practice. The objective of this study was to assess diagnostic accuracy of screening tools for apathy in outpatients with PD, to aid in the diagnostic process associated with apathy.
METHODS
The study protocol was created and registered a priori with PROSPERO (CRD42018085441). We used the Preferred Reporting Items for Systematic Reviews and Meta-Analyses (PRISMA) Protocols statement to aid protocol development [15].
Search strategies and literature sources
A comprehensive search strategy was developed in conjunction with an experienced librarian as per the Peer Review of Electronic Search Strategies (PRESS) guidelines [16]. Six key medical databases were searched to May 23, 2018, including MEDLINE, EMBASE, PsycINFO, Cochrane Database of Systematic Reviews, Cochrane Central Register of Control Trials and CINAHL. The main clusters used were PD, apathy, and diagnostic accuracy terms. These clusters were combined using “and”. Keywords, within main clusters, including Medical Subject Headings, EMTRTEE, PsychINFO, and Cochrane terms were combined using “or” (Table 1). A previously conducted systematic review utilized a comprehensive grey literature search that employed the CADTH Grey Matters tool [13]. The grey literature search as per CADTH Grey Matters was updated for the present study, and as per CADTH Grey Matters relevant Parkinson’s disease specific websites were searched for grey literature.
Systematic review search strategy
Study screening and selection
Two authors individually reviewed all citations, abstracts, and full texts (B.M. and D.M.). If disagreement occurred at the abstract stage this was resolved through inclusion of full-text or by discussion with a third reviewer (Z.G.). The abstract stage included any study that discussed apathy in PD populations. The full text stage included studies if they reported diagnostic accuracy measurements including sensitivity and specificity values of tools for detecting apathy, in outpatient PD populations. As there is currently no widely accepted gold standard comparator for the diagnosis of apathy, we included studies that used clinician diagnosis which in some cases was guided by existing criteria-based diagnosis (e.g., Robert et al., 2009), to generate diagnostic accuracy measurements [11, 17] or a more broadly described clinical interview. The kappa statistic, calculated at the full-text screening stage was used to measure agreement between the two authors.
Risk of bias and methodologic quality assessment
Risk of bias was assessed using the Quality Assessment of Diagnostic Accuracy Studies (QUADAS-2) tool [18]. The 24-item scale provides four domains to assess: patient selection, use of an index test, use of a reference standard, and flow and timing of the study. Two authors (B.M. and D.M.) independently completed the tool, with any disagreement resolved through discussion and involvement of a third author; however, this latter step was not required.
Data extraction
Predefined data items were outlined in a data dictionary, developed by one reviewer (B.M.) (Table 2). One study author extracted all data (D.M). A second author (B.M.), then independently verified data. Reviewing studies again or discussion with a third author (Z.G.) solved any extraction discrepancies. Participant demographics such as age, gender, and study setting were collected. Additionally, apathy prevalence, sensitivity, specificity, positive and negative predictive values, positive and negative likelihood ratios (LRs), and area under the curve were recorded where available. Inquiries were sent to authors of studies where data was missing. The aforementioned values were extracted to calculate pooled prevalence of all included studies and diagnostic accuracy of apathy screening tools.
Included study characteristics
*Indicates studies that applied an apathy assessment instrument assessing apathy as a symptom opposed to syndrome.
Pooled prevalence
The prevalence of apathy within the included study populations was pooled using the Mantel Haenszel-weighted DerSimonian and Laird models [19]. The heterogeneity across study populations was evaluated using the I2 statistic and Cochran Q statistic with p value of 0.05 considered significant. Heterogeneity levels range from 0%–40%, 30%–60%, and 50–90% which represent low, moderate, and substantial heterogeneity, respectively [20].
Meta-analysis of diagnostic accuracy: Sensitivity, specificity, and LRs
We collected all data required to calculate 2 by 2 contingency tables, which include sensitivity, specificity, positive and negative LRs, positive and negative predictive values, and prevalence. However, the required values were not consistently reported across included studies thus we were unable to do meta-analysis.
RESULTS
Our search of the database search strategy returned 4,484 citations; after de-duplication, there were 16 570 records screened; 1,007 full-text articles were reviewed. Seven full-text articles were included for qualitative synthesis and meta-analysis of apathy prevalence. These articles provided diagnostic accuracy measures for six apathy assessment instruments. Screening agreement between raters for inclusion of studies at the full-text stage was 98.2% (κ 0.72, 95% confidence interval [CI] 0.66–0.78). All exclusion criteria are listed in Fig. 1. The main reasons for exclusion included no diagnostic accuracy measures being reported or no gold standard applied (n = 532), unobtainable/abstract only studies (n = 323), and non-original research (n = 140).
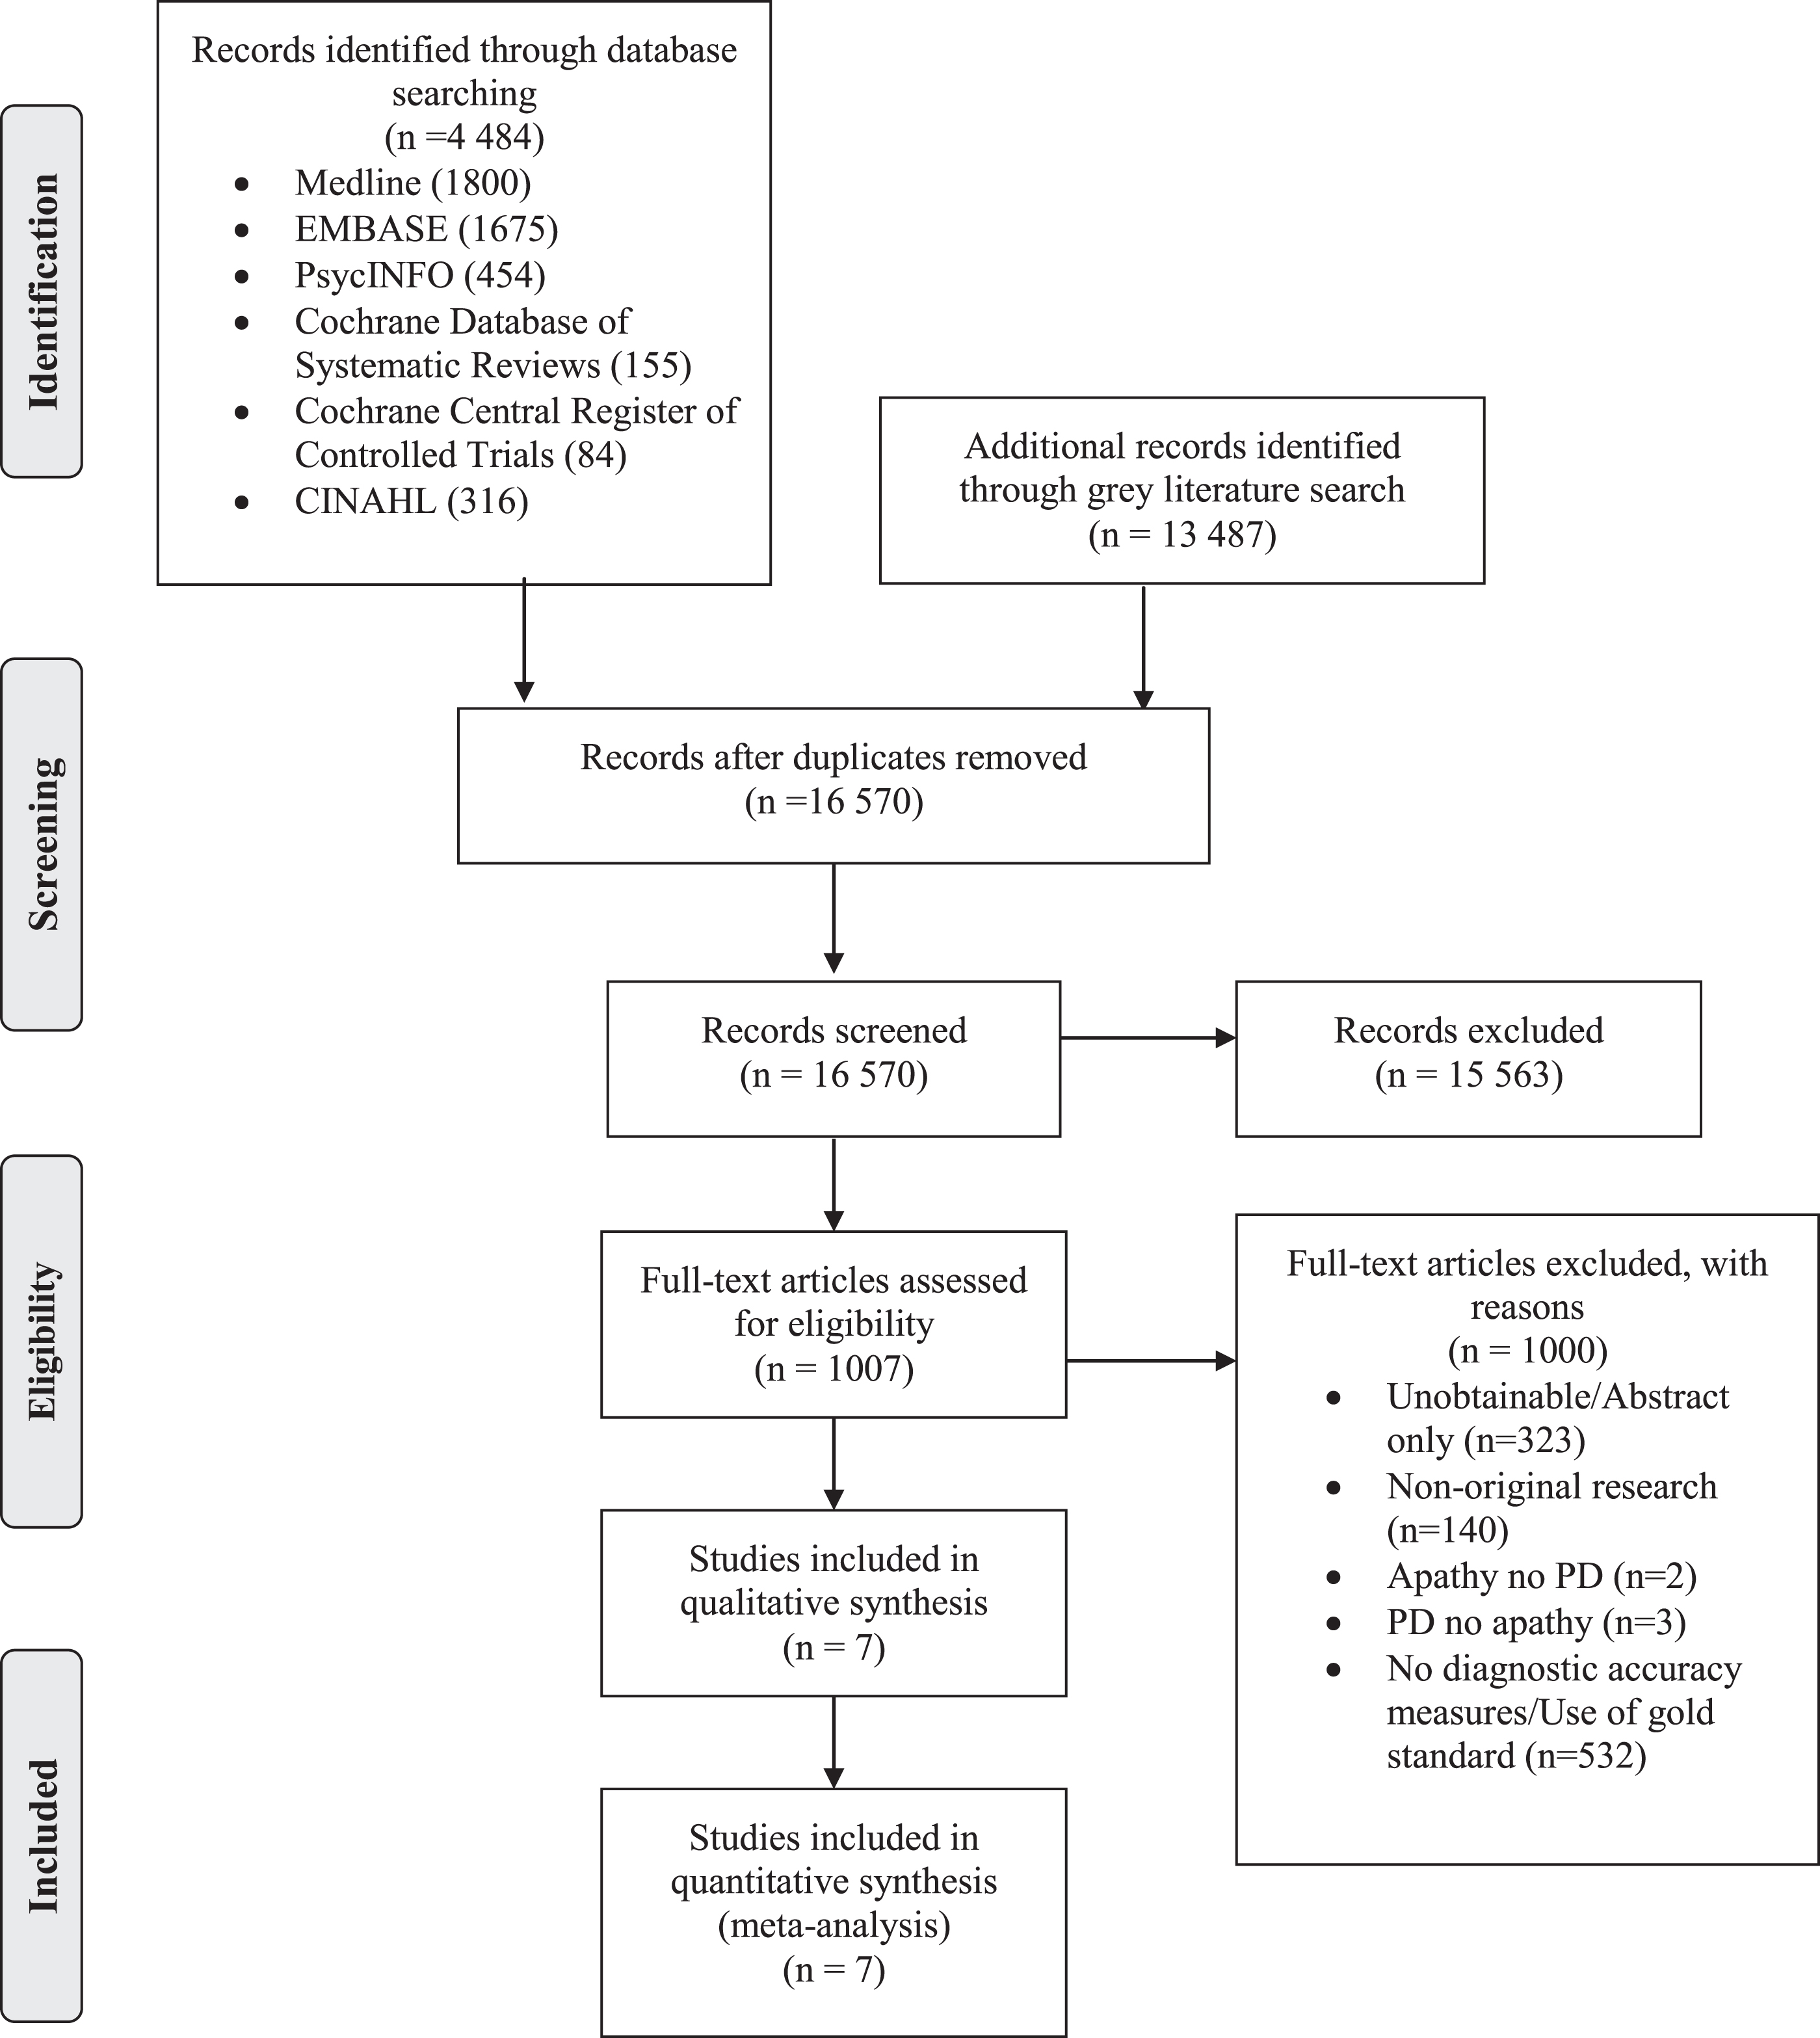
Preferred Reporting items for systematic reviews and meta-analysis flow diagram [15].
Risk of bias assessment
None of the seven included studies were considered poor enough to be excluded from the study (Table 3). Two of the seven studies were case-control design, which may have introduced bias in index test results [21, 22]. Unclear reporting of the timing between clinician evaluation and administration of the apathy test were the primary concern (n = 6) [21–26].
Quality Assessment of Diagnostic Accuracy Studies (QUADAS-2) tool assessment
Description of included apathy tools
Summary of included studies
Included studies were all written in English and published between 1992 and 2017 [21–27]. Five countries were represented, including Argentina, Canada, France, Italy, and the United States. The mean age of included study populations ranged from 63 to 67 years. All studies included community dwelling adults accessing outpatient movement disorder or neurology clinics. All diagnosis of PD were made using the International Criteria or United Kingdom Brain Bank Criteria [28, 29]. Seven unique study populations were included, with a total of 196 persons with PD and apathy. The prevalence of apathy within the included samples ranged from a minimum of 12.0% to a maximum 46.0%, however not all study excluded depression from the prevalence estimates. The reference standard in all included studies was clinician diagnosis of apathy. We aimed to collect information on disease severity, cognitive function, and medication use but these outcomes were too heterogeneously reported.
Prevalence of Apathy
The pooled prevalence of clinician diagnosed apathy, from the seven unique study populations was 29.1% (95% CI 21.5%–36.6%). There was significant heterogeneity associated with this value (I2 = 79.6%; p =<0.01). If the article included prevalence of apathy and apathy with depression, the prevalence of apathy only was extracted and used in the calculation. It is important to note, however, that only two studies described their apathy prevalence as isolated from depression.
Diagnostic accuracy of tools in included studies
Diagnostic accuracy measures were provided for six apathy assessment instruments; the Lille Apathy Rating Scale (LARS) both the informant- and observer-rated, the Unified Parkinson’s Disease Rating Scale (UPDRS), Apathy Scale (AS), the Apathy Evaluation Scale (AES), the Non-Motor Symptoms Questionnaire (NMS-Q), and the Dimensional Apathy Scale (DAS). Diagnostic accuracy values reported for the scale, from their respective studies are provided in Table 2. The AES reported both the highest sensitivity and specificity values, both with a value of 90% [23]. The UPDRS reported the lowest combined sensitivity and specificity values of 73% and 65%, respectively [27].
DISCUSSION
We identified seven studies that assessed diagnostic accuracy of six different apathy assessment instruments compared to a clinician diagnosis of apathy. The majority of studies excluded at the full-text stage examined the prevalence of apathy with an apathy tool and looked at diagnostic accuracy without comparison to a clinician diagnosis of apathy. Other studies excluded looked at accuracy by comparing two apathy tools. These were not included as there was no gold standard comparator. Currently, only two gold standard definitions are considered within the broader apathy literature, which are either clinician diagnosis or criteria developed by Robert and colleagues [17, 30–32].
Our reported apathy prevalence value of 29.1% (95% CI 21.5%–36.6%) is lower than the 40% (95% CI 34.6%–45.0%) prevalence reported in a previous systematic review and meta-analysis [4]. This is likely because our reported estimate is based on clinician diagnoses and not solely on tool estimates. The variety of prevalence estimates of apathy in PD reflects clinical reality given there are a variety of apathy assessment scales that can be utilized, that are either self- or informant-rated. Overall clinicians may wish to familiarize themselves with the available validated tools, and choose the one that fits into their practice best.
Two of the six included tools, the NMS-Q and the UPDRS simply capture apathy as a symptom as part of a broader battery of global non-motor symptoms, rather than capturing apathy as a syndrome [14, 34]. Research has demonstrated single item assessment of apathy as a symptom, provides limited opportunity to recognize these symptoms and should be used for initial screening only [11, 35]. Therefore it is important for research to focus on apathy specific tools, which are designed to assess apathy as a syndrome and offer a more thorough assessment [14].
den Brok and colleagues [4] were able to stratify results by presence of depression and cognitive impairment. When considering only those individuals with apathy and no depression or cognitive impairment, the prevalence was 22.6% (95% CI 515.2%–29.9%). This estimate is closer to the value presented within this study. However, only two studies, validating the LARS and AS, included within this research presented prevalence values for those with apathy and no depression [21, 24]. The remaining five studies did not specify if apathy was isolated from depression or cognitive impairment. This is a major concern to clinicians, as a key barrier to making a diagnosis is a tools ability to separate symptoms [36] and distinguish or disentangle apathy and depression. Distinguishing factors between apathy and depression that may inform clinicians include those with the syndrome apathy may present with lack of effort and initiation, and lack of emotion, versus those with the syndrome of depression may present with worthlessness, irritability, self-dislike, and sadness [37–41].
PD severity and cognitive function were too heterogeneously reported to comment on the applicability of these findings within the broader context of PD populations. To better understand the severity of symptoms and cognitive status of those individuals with apathy and PD, future research should more rigorously assess for these measures. Age ranged from 63 to 67 years; further research is required to better understand apathy as a symptom within both younger and older PD populations. This is an important area for further investigation as currently there is disagreement within the literature as to whether apathy is associated with older age and stage of disease, or if it is a prodromal symptom [42, 43].
Four of the six screening tools, including the AES, AS, DAS, and LARS were developed specifically for the assessment of apathy. Of these four tools, the AES self rated version, with a cutoff of 37 had the best reported balance of 90% sensitivity and specificity [23]. Positive and negative likelihood ratios were also good (+LR = 9.00) and (–LR = 0.11), indicating the tools ability to rule in and out apathy, respectively. However, they did not clearly screen for or exclude those with depression [23]. The AES was the first apathy tool developed to quantify levels of apathy in adult populations, assessing behavioral, cognitive, and emotional components of apathy. It is an 18-item tool developed for use within elderly populations as well as populations with Alzheimer’s disease, major depression, and stroke [44].
The self-rated version of the LARS with a cut-off of ≥16 had similar validity measures to the AES, with a sensitivity of 89% and a specificity of 92% [21]. The LARS was developed to address concerns that administration of existing apathy tools lacked standardization and consistent representation across study populations; this included the AES and neuropsychiatric inventory [21]. The LARS assesses four components including: intellectual curiosity, self-awareness, emotion, and action initiation [21]. The LARS informant rated version (LARS-i), demonstrated lower sensitivity (86%) and specificity (85%) values [25]. The lower diagnostic accuracy measures reported for the informant version of the LARS versus what was reported for the self-rated version of the LARS, may suggest that self-reported measures are more accurate. This may be due to reports that apathy is one of the most burdensome symptoms for caregivers, thus making them likely to over report apathy severity [45–48]. However, where persons with PD also have cognitive decline with deficits in awareness, informant rated scales may provide better estimates of apathy due to caregivers’ increased awareness of apathy symptoms, and the loss of insight, or anosognosia, on the part of the cognitively impaired person with PD.
Due to the limited number of studies included in this research we were unable to stratify by self versus informant reported scale. Thus, it is important that further studies are conducted to compare the validity associated with self versus informant rated scales. These studies should also assess how the validity of self versus informant tools is associated with cognitive function in those with PD. It may be that informant rated scales have more utility when persons with PD are experiencing cognitive decline with deficits in awareness, as this may affect their ability to self-report apathy symptoms. This may limit the reliability of self-reported apathy symptoms, thus self-awareness should be considered when deciding what apathy-screening instrument to employ. Differences between self versus informant rated scale may also explain the high heterogeneity associated with our prevalence estimate.
The AS had the lowest sensitivity (66%) but the highest specificity (100%) [24]. This tool is self-rated and is an adapted and shortened version of the AES and was designed specifically for use within PD populations. Given that this tool is the briefest to administer of all the apathy specific tools, was developed for use specifically within PD populations, and provides 100% specificity it may be beneficial for use within study populations. However, given the low sensitivity, use for screening is not ideal as cases of apathy may be missed due to a high false negative rate.
The DAS is self-rated, and the only apathy specific tool designed to account for the effects of motor dysfunction observed in PD populations [49]. This tool is made up of three components including: executive, emotional, and behavioural/cognitive initiation. The reported sensitivity (69%) and specificity (92%) are moderate and this tool may be beneficial in PD for use within PD populations with more severe motor symptoms [22].
The other two tools included in this study are comprised of a number of questions assessing various symptoms specific to PD populations [26, 27]. The UPDRS, Item 4 has a sensitivity of 73% and specificity of 65%. This tool was developed by the Movement Disorder Society, and is a general PD scale with one question specific to the assessment of apathy [33]. The NMS-Quest had the lowest sensitivity (48%) of all tools, with a specificity of (87%). This tool was developed to provide a comprehensive assessment of the non-motor symptoms in PD populations [34]. While such tools may increase awareness of the spectrum of non-motor symptoms in PD, it is important for clinicians to also employ tools specific to the non-motor symptoms of interest given that the non-apathy specific tools had the lowest reported diagnostic accuracy values of all included studies.
Currently the AS is the only tool recommended for use by experts in PD populations [11]. This tool is brief to administer and provided the highest specificity values of all tools used within included studies, however does have a low sensitivity measure (66%) [24]. The UPDRS has also been recommended by experts, however with the suggestion that further assessment take place, as it only provides one question specific to apathy [11].
In the absence of an accepted gold standard, and to best frame our prevalence estimates, we ensured all included studies verified the index test against the same reference standard and utilized error free reference standard classification, defined as clinician diagnosis; this is currently applied within the literature in lieu of a widely accepted gold standard [32, 50].
Interestingly, Robert and colleagues recently published updated criteria for defining apathy in brain disorders [51]. They conclude it is important to validate their criteria within disease specific populations. Our work is an important step towards synthesizing currently available diagnostic accuracy measures for apathy in PD. Future research may also wish to directly compare several apathy tools to a gold standard in one study, this may provide insights as to what tools are best at identifying apathy.
While there currently exists a systematic review assessing psychometric properties of apathy scales in PD populations [52], our study serves as a complement to this systematic review, by focussing on understanding which of the available apathy tools were validated against clinician diagnosis. This fundamental difference is important because while psychometric properties offer understandings of reliability and validity of tools (generally in comparison to one another), diagnostic accuracy measures provide clinicians with an understanding of a tool’s ability to correctly identify or rule out a disease [53, 54]. Given the current state of our understandings of apathy, specifically that apathy may have overlapping symptoms with depression, the identification of a tool that can accurately detect apathy, as a syndrome is important. Moreover, given the heterogeneity associated with current prevalence estimates, providing clinicians with a synthesis of diagnostic accuracy may encourage the use of a consistent tool across studies, allowing for a more homogeneous assessment of prevalence.
Our systematic review utilized an extensive search strategy developed in tandem with a research librarian allowing us to identify two additional sources of literature [26, 27]. We also employed the use of the PRISMA at both the protocol and manuscript stages of our research [15, 55]. Our review attempted to mitigate concerns regarding the current lack of gold standard criteria by including only studies validating apathy assessment instruments against clinician diagnosis, as it is currently considered a gold standard proxy within the literature [32].
To account for the potential risk of missing literature we developed our search with a research librarian, and ensured search terms were database specific. Two independent reviewers screened all abstracts and full-texts. The references of all included texts were also screened. It is unclear as to whether the populations included in these studies are representative of the general PD population, as measures assessing duration of disease and symptom severity were heterogeneously reported. This review has a small number of included studies used to calculate the prevalence value; however, this is the result of applying rigorous inclusion criteria to ensure a reference standard was applied across all studies due to the current lack of a widely accepted gold standard for apathy.
Apathy is a common and burdensome symptom in PD populations. The current lack of gold standard criteria limits the literature available on the assessment of diagnostic accuracy measures for apathy screening tools. The AES provided the best balance between sensitivity and specificity; however, the AS has been recommended for use and has the highest specificity value of all included tools at the cost of low sensitivity. Future studies must focus on the assessment of which tool is most appropriate for use within PD populations with a range of disease duration and motor severity. Additionally, all tools will need to be re-validated once gold-standard criteria are accepted within the broader literature.
CONFLICT OF INTEREST
The authors have no conflict of interest to report.