
Abstract
Background:
The diagnostic potential of multimodal MRI approaches to discriminate among progressive supranuclear palsy (PSP), Parkinson variant of multiple system atrophy (MSA-P) and Parkinson’s disease (PD) has not been well investigated.
Objective:
To identify disease-specific neurodegenerative patterns and evaluate the diagnostic accuracy of dedicated MRI, iron concentration (R2*), microstructural integrity (mean diffusivity; MD and fractional anisotropy; FA) as well as volumes were analyzed in patients with PSP, MSA-P and PD.
Methods:
3T MRI of 18 PSP and 16 MSA-P patients were compared with 16 PD patients matched for age and disease duration as well as 21 healthy controls. Statistical parametric mapping (SPM) was applied to objectively identify focal MRI changes throughout the whole-brain. Following dimensionality reduction of significant and multiple comparison-corrected SPM clusters through principal component analysis (PCA), stepwise receiver-operating characteristic curve analysis (ROC) was applied to determine the diagnostic potential of multimodal MRI parameters.
Results:
PCA revealed two components involving multiple regions identified from SPM analysis. The first component was primarily composed of the mean MD value of the thalamus and the mean MD and FA values of the dentatorubrothalamic tract and the corpus callosum. The second component mainly consisted of mean MD and FA values of the middle cerebellar peduncle. ROC analysis showed 92% of PSP patients were differentiated correctly from MSA-P and PD and 80% of MSA-P patients could be distinguished from PD.
Conclusion:
Multimodal MRI improved the detection of disease-specific neurodegenerative patterns in PSP and MSA-P and highlights its potential to improve the diagnostic accuracy of atypical parkinsonian disorders.
Keywords
INTRODUCTION
Progressive supranuclear palsy (PSP) and multiple system atrophy (MSA) may mimic Parkinson’s disease (PD) particularly in the early stage of the disease and error rates in initial clinical diagnosis can be substantial [1, 2] highlighting the need for additional diagnostic markers. Advances in the development of novel MRI sequences such as diffusion tensor imaging (DTI) and MR relaxometry and subsequent automated image analysis provide insights into different aspects of neurodegeneration. Previous studies have evaluated their potential as diagnostic markers for different types of degenerative parkinsonism [3–6]. DTI signal changes in the putamen and middle cerebellar peduncle were shown to differentiate the Parkinson variant of MSA (MSA-P) from PD with high diagnostic accuracy [3, 4], whereas those of the superior cerebellar peduncle and corpus callosum improved the discrimination of PSP from PD [5, 6]. Likewise, increased iron content in the caudate nucleus, putamen, globus pallidus, and thalamus [7, 8] have provided evidence for the diagnostic potential in separating MSA and PSP, respectively, from PD. When applying region of interest (ROI)-based or whole-brain voxel-based approaches to multimodal MRI, the combination of MRI parameters from different MRI sequences was recently reported to distinguish MSA from PD with high accuracy [9, 10]. However, until now, studies investigating those markers in more than two patient groups are scarce and the diagnostic potential of multimodal MRI parameters to differentiate PSP from other parkinsonian disorders such as MSA-P and PD has not been formally investigated.
Voxel-based analysis methods such as statistical parametric mapping enable to perform categorical analyses of diffusivity metrics, relaxometry and grey and white matter volumetry throughout the entire brain without having to make a priori hypothesis as to their location [11, 12]. In the present study we have applied whole-brain voxel-based analysis to multimodal MRI data comprising R2* (measure of iron concentration), DTI including mean diffusivity (MD) and fractional anisotropy (FA) and volumetric measures of the grey and white matter compartments, i) to characterize patterns of neurodegeneration in patients with early-stage PSP, MSA-P and PD, ii) to examine the association between characteristic MRI changes and clinical parameters and iii) to evaluate the potential of identified MRI parameters to differentiate among PSP, MSA-P and PD.
METHODS
Subjects
Eighteen patients with PSP, 16 patients with MSA-P, and 16 patients with PD matched for age, gender and disease duration were consecutively recruited at our centre. For their baseline (= first visit) scans to be included in this study patients had to meet consensus operational criteria of probable PSP, MSA-P and PD as assessed by 2 movement disorders specialists after clinical follow-up of at least 24 months [13–15]. Further inclusion criteria, all anchored on the time of MRI included i) disease duration of less than 7 years after symptom onset, ii) age of 50–75 years, iii) availability of Unified Parkinson’s Disease Rating Scale (UPDRS) part III ratings and Hoehn & Yahr staging and iv) presence of presynaptic nigrostriatal dopaminergic dysfunction confirmed by either dopamine transporter SPECT or [18F]-dopa PET. MRI was performed within 1 month of the initial clinical examination. Twenty-one healthy individuals with no signs of central nervous system disorders and a Mini-Mental State Examination score of >28 served as age-matched control group. Participants with white matter lesions of grade 2 and 3, vascular or space-occupying lesions within the cerebrum, or motion artefacts were excluded [16]. Due to marked distortions DTI acquisitions of two patients with PSP were excluded. The study was approved by the Ethics Committee of the Medical University of Innsbruck. The subjects’ written informed consent was obtained according to the Declaration of Helsinki.
MRI data acquisition
All MRI measurements were performed on a 3.0 Tesla whole-body MR scanner (Magnetom Verio, Siemens Erlangen, Germany) equipped with a twelve-channel head coil. All participants underwent the same MRI protocol, including whole-brain T1-weighted, fluid-attenuated inversion-recovery, T2 and proton density-weighted, DTI as well as T2*-weighted sequences. MRI acquisition time was 27minutes and 36 seconds. The MRI parameters for coronal T1-weighted 3D magnetization prepared rapid gradient echo (3D-MPRAGE) were TR 1800 ms; TE 2.18 ms; inversion time, 900 ms; slice thickness, 1.2 mm; matrix, 256×204 pixels; number of excitations, 1; flip angle, 9°; field of view 220×165 mm. The DTI data were acquired using spin-echo echo-planar imaging (echo time/repetition time = 83/8200 ms, bandwidth = 1596 Hz/pixel; matrix size 116×116; 45 axial slices; voxel size, 2×2×3 mm3) with 20 diffusion gradient directions with a b-value of 1000 s/mm2 and one reference image with b = 0. For the T2* quantification, a transversal 2D multi-slice, multi-echo gradient echo sequence was used covering the whole-brain volume (TR = 200 ms; TE = 2.58, 4.81, 7.04, 9.27, 11.5, 13.73, 15.96 and 18.19 ms; flip angle, 20°; bandwidth = 810 Hz/pixel; matrix size 128×128; 43 axial slices; voxel size, 1.7×1.7×3.0 mm3). R2* maps (R2* = 1/T2*) were calculated by pixel-wise fitting with a mono-exponential model using a custom-written ImageJ plugin (Wayne Rasband, U.S. National Institutes of Health, Bethesda, MD, USA).
Image post processing
To avoid a priori assumptions through ROI analysis on brain areas of potential interests, grey and white matter volume, MD, FA, and R2* measures were subjected to statistical parametric mapping (SPM, Wellcome Department of Cognitive Neurology, London, UK; [11]). The software package SPM12 implemented in Matlab 7.8 (Mathsworks Inc., Sherborn, MA) was used to preprocess and analyze MRI data. To compensate for eddy currents, DTI images were registered to a reference image without diffusion weighting. Registered DTI were visually verified for correct calculation and reconstruction for every subject. In order to avoid cerebrospinal fluid (CSF) contamination and partial volume effect derived from small cystic lesions, MD and FA maps were masked by voxel values that were below a threshold of mean CSF MD values minus 2 standard deviation (SD) and respectively above a threshold of mean CSF FA values minus 2 SD, determined for each individual subject [3, 18]. To achieve accurate spatial normalization for MD, FA and R2* images, previously coregistered T1-weighted images were normalized onto the T1 template in MNI space, and the resulting transformation parameters were applied to the participant’s corresponding MD, FA and R2* images. A Gaussian kernel of 8×8×8 mm was then convolved with the spatially normalized parametric images of MD and FA to smooth them in order to accommodate inter-individual anatomic variability and to improve signal to noise ratios for the statistical analysis. A Gaussian kernel of 4×4×4 mm was applied to lower resolution R2* images to account for statistical considerations mentioned above, without jeopardizing accurate localization of anatomical structures. Due to artefacts in the posterior fossa the cerebellum was excluded for R2* analysis. Voxel based morphometry (VBM) of the grey and white matter compartment was performed by using the standard version of the diffeomorphic anatomical registration using exponentiated lie algebra toolbox (DARTEL) implemented in SPM12 to have a high-dimensional normalization protocol [12]. Segmented and modulated images were transformed from the study-specific diffeomorphic anatomical registration space into Montreal Neurological Institute (MNI) space and smoothed by a Gaussian kernel of 8×8×8 mm. For VBM analysis, age and total intracranial volume were entered as covariates. For MD, FA and R2* analysis, age was included as a covariate. A masking threshold of approximately 10% of the lower image signal was applied to reduce signal noise.
Statistical analysis
Demographic data are presented as frequencies, means±standard deviations, or median (interquartile range) according to data distribution. The binominal test was applied to test for the distribution of gender. The Gaussian distribution was confirmed by the Kolmogorov-Smirnov test. Group differences of normally distributed data (i.e., age, disease duration and UPDRS part III) were analyzed by parametric tests (one-way analysis of variance [ANOVA]) and non-Gaussian distributed variables (i.e., Hoehn & Yahr stage and Mini-Mental State Examination) by nonparametric tests (Kruskal-Wallis test). Bonferroni correction for multiple testing was applied for post hoc testing. Between-group comparisons of grey and white matter segments, as well as MD, FA and R2* maps were assessed using one-way ANOVA design with p < 0.001 as level of significance. The family-wise error (FWE) at a threshold of p < 0.05 was applied to correct for multiple comparisons at the voxel-cluster level. For correlation analysis of the clinical assessments comprising UPDRS part III, Hoehn & Yahr staging and disease duration, the MRI values of 20 clusters obtained from the contrasts between patients’ and control groups were extracted by means of the MarsBar region of interest toolbox [19]. The relationship between clinical assessments and MRI parameters was investigated using Pearson’s correlation statistics for normally distributed data or Spearman’s rank correlation statistics for categorical data and not Gaussian distributed parameters. Furthermore, principal component analysis (PCA) was applied to those MRI parameters with significant differences between patients’ and healthy control groups to identify the uncorrelated variables (i.e., principal components) that account for the maximum amount of variance of the data. Axes yielding an eigenvalue greater than one were retained (Varimax-Kaiser rule [20]). A least squares regression approach was used to predict a factor score for each individual case followed by a stepwise receiver-operating characteristic curve (ROC) analysis and the corresponding area-under-the-curve (AUC) calculation. In the first step, we evaluated the ability to discriminate PSP patients from MSA-P/PD patients. As the second step of a step wise ROC analysis, we determined the diagnostic ability to differentiate between MSA-P and PD patients. Data were tabulated and analyzed using commercial software packages (JMP version 11.0.0; SAS Institute, Tokyo and SPSS version 24, Chicago).
RESULTS
The demographic and clinical characteristics of patients and healthy controls (HCs) are shown in Table 1. There was no significant difference in gender ratio, age and disease duration among the four groups (PSP, MSA-P, PD, and HC).
Comparison of clinical characteristics among patients with progressive supranuclear palsy (PSP), Parkinson variant of multiple system atrophy (MSA-P), or Parkinson’s disease (PD) and healthy controls
*p < 0.0001 versus HC. †p < 0.01; ††p < 0.001; †††p < 0.0001 versus PD. ∫p < 0.01 versus PSP. IQR, interquartile range; NA, not applicable; MMSE, Mini-Mental State Examination; UPDRS, Unified Parkinson’s Disease Rating Scale.
Group analysis, PSP (Fig. 1)
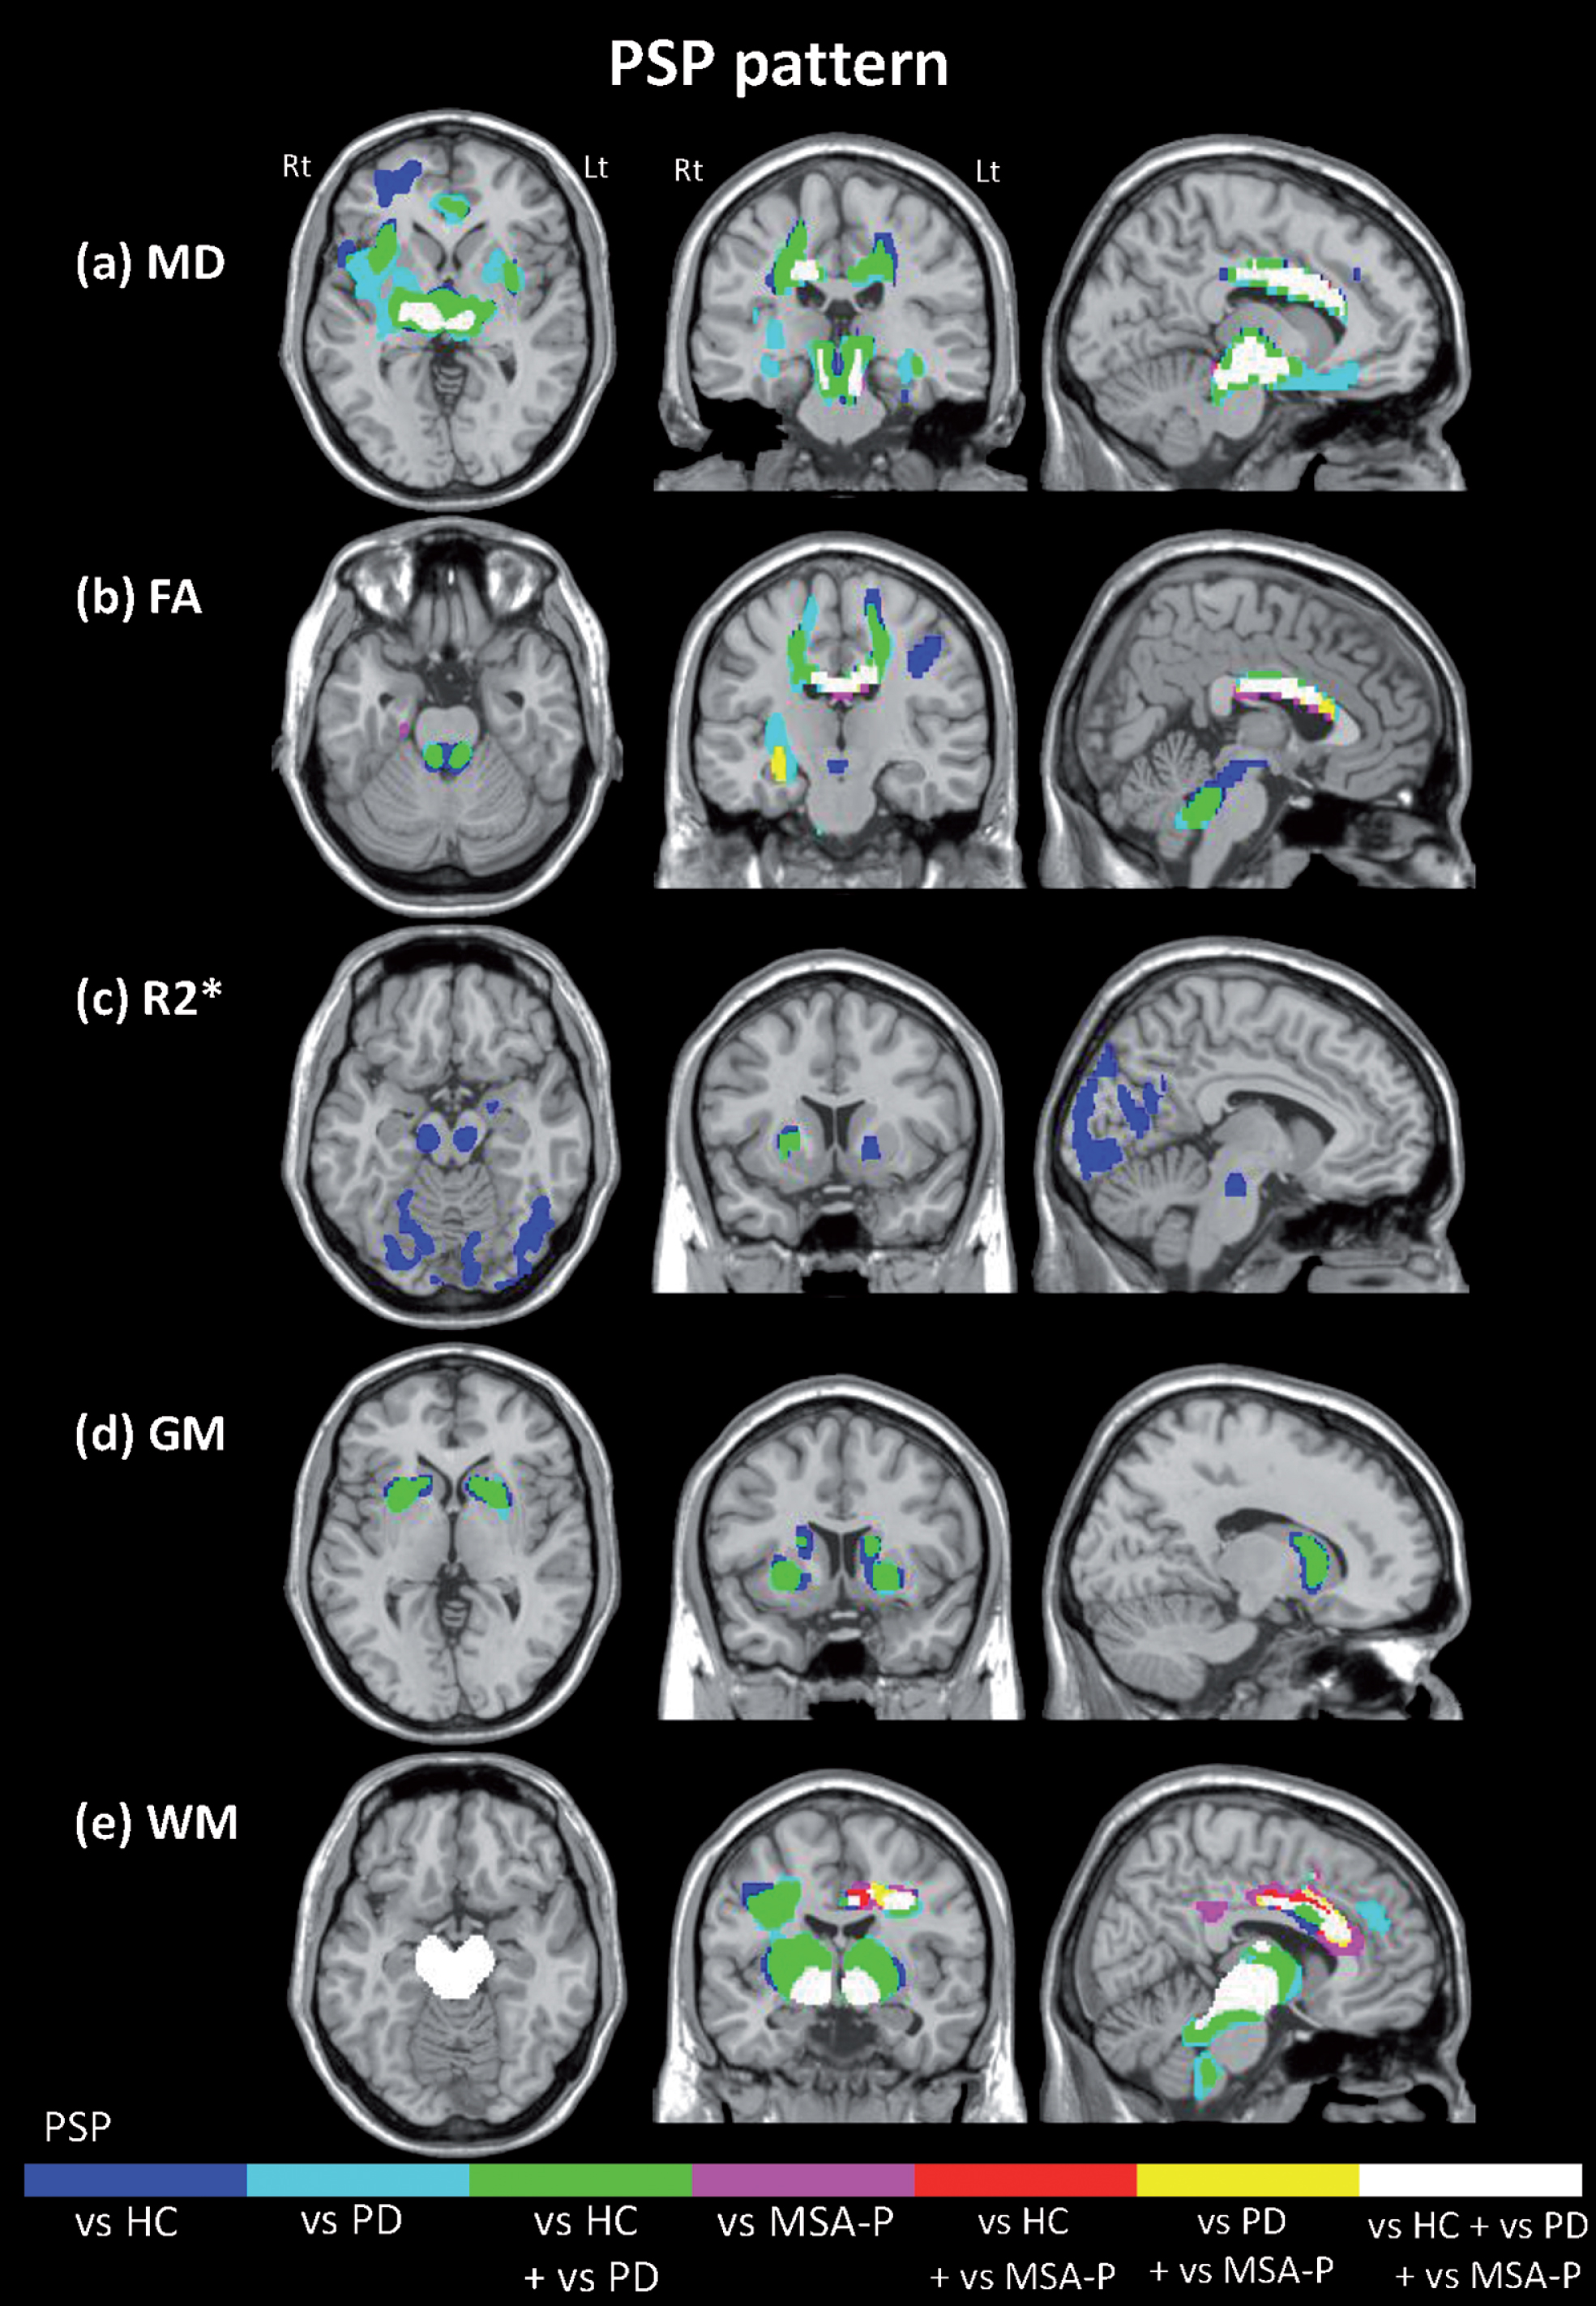
Neurodegenerative pattern of progressive supranulcear palsy (PSP) assessed by multimodal MRI. The images represent the regions that showed significant higher mean diffusivity (a), lower fractional anisotropy (b), increased R2* values (c), decreased grey and white matter (d, e), respectively, in PSP patients. Differences in the comparison with healthy controls (HCs), Parkinson’s disease (PD) and Parkinson variant of multiple system atrophy (MSA-P) are shown in blue, light blue, pink, respectively. Likewise, regions which showed significant differences in PSP patients compared both with HCs and with PD, both HCs and MSA-P and both PD and MSA-P are labeled in green, red and yellow, respectively. Regions in white had significantly different values in PSP relative to all other groups. HC, healthy controls; MSA-P, Parkinson variant of multiple system atrophy; PD, Parkinson’s disease; PSP, progressive supranuclear palsy.
Compared to the MSA-P, PD and the HC groups, the PSP group showed significantly increased MD values in the midbrain extending bilaterally into the ventrolateral thalamus, the superior cerebellar peduncles (SCPs), the trunk of the corpus callosum, the adjacent cingulum and the right globus pallidus as well as significant FA decreases in the corpus callosum. Significantly increased MD values in the frontal white matter (WM), left pallidum and right putamen, and reduced FA values bilaterally in the SCP and the frontal WM were found when comparing the PSP group to the PD and HC groups (Supplementary Tables 1 and 2).
In the PSP group R2* values were significantly increased bilaterally in the substantia nigra and red nucleus compared to the HC group as well as in the bilateral pallidum and the right putamen compared to the PD and HC groups. The PSP group also showed significantly higher R2* values in the occipital lobe when compared to the HC group (Supplementary Table 3).
Grey matter (GM) volume was significantly decreased bilaterally in the caudate nucleus and putamen compared to the PD and HC groups and there were significant WM reductions in the midbrain, the SCP, the bilateral thalamus, the trunk of the corpus callosum and the adjacent cingulum as well as the frontal WM compared to the MSA-P, PD and the HC groups. In addition, WM volume was significantly decreased in the dorsal area of the pons compared to the PD and HC (Supplementary Tables 4 and 5).
Group analysis, MSA-P (Fig. 2)
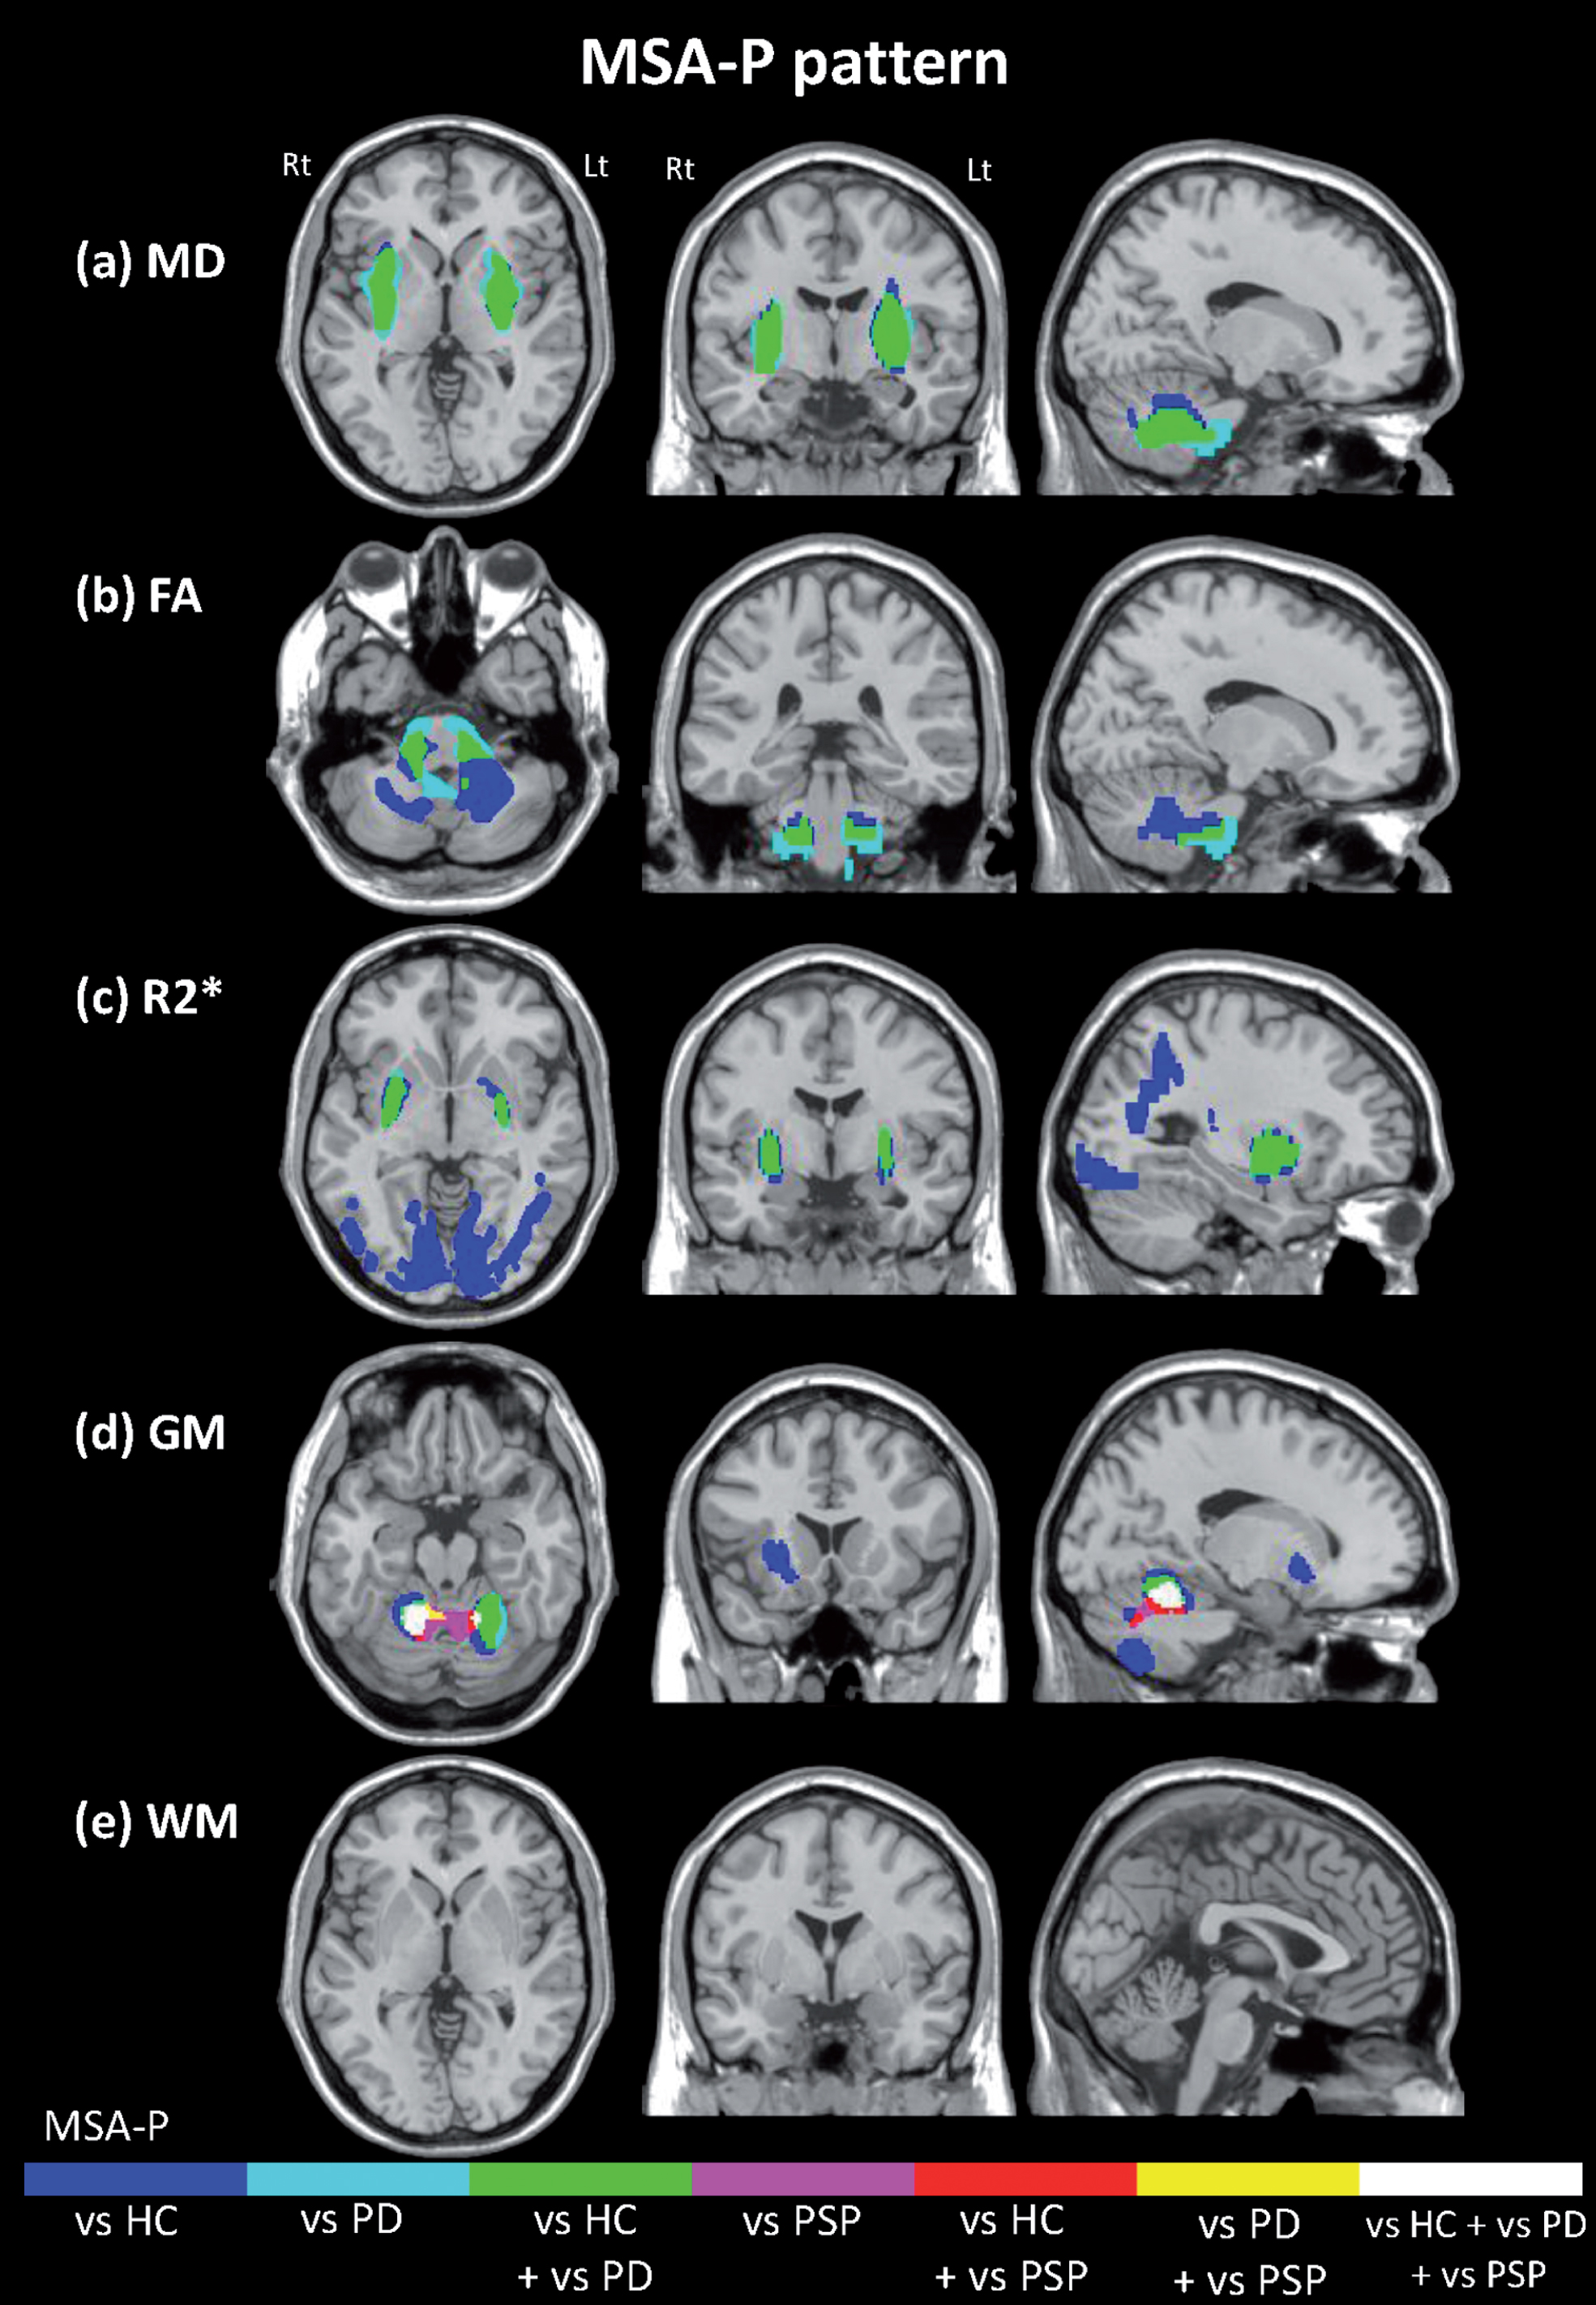
Neurodegenerative pattern in Parkinson variant of multiple system atrophy (MSA-P) assessed by multimodal MRI. The images represent the regions that showed significant higher mean diffusivity (a), lower fractional anisotropy (b), increased R2* values (c), decreased grey and white matter (d, e), respectively, in MSA-P patients. Differences in the comparison with healthy controls (HCs), Parkinson’s disease (PD) and progressive supranuclear palsy (PSP) are shown in blue, light blue, pink, respectively. Likewise, regions which showed significant differences in MSA-P patients compared both with HCs and with PD, both HCs and PSP and both PD and PSP are labeled in green, red and yellow, respectively. Regions in white had significantly different values in MSA-P relative to all other groups. HC, healthy controls; MSA-P, Parkinson variant of multiple system atrophy; PD, Parkinson’s disease; PSP, progressive supranuclear palsy.
Compared to the PD and HC groups, the MSA-P group showed significantly increased MD values in the putamen bilaterally, the pons extending to the bilateral middle cerebellar peduncles (MCPs) and cerebellar WM as well as significantly decreased FA values in the pons, both MCPs and cerebellar WM (Supplementary Tables 1 and 2).
R2* values were significantly increased bilaterally in the dorso-lateral putamen, the occipital WM and cortex and the precuneus (Supplementary Table 3).
Significant GM reduction was evident in the bilateral cerebellar cortex compared to the PSP, PD and the HC groups and was also found in the right putamen and the caudate nucleus when compared to the HC group (Supplementary Table 4).
Group analysis, PD (Supplementary Figure 1)
In the PD group, R2* values were significantly increased in the left substantia nigra compared to the HC group (Supplementary Table 3). The PD group showed significant bilateral GM loss in the precuneus compared to the PSP, MSA-P and the HC groups (Supplementary Table 4). No significant alterations of WM and DTI values were evident in PD compared to all other groups.
Correlation of MRI parameters and clinical assessments (Supplementary Figure 2)
In the PSP group, FA decreases and MD increases in the area of the dentatorubrothalamic tract correlated significantly with Hoehn & Yahr staging (FA; rs = –0.51, p < 0.05, MD; rs = 0.55, p < 0.05) and FA decreases in the dentatorubrothalamic tract negatively correlated with the UPDRS part III score (rs = –0.56, p < 0.05) and disease duration (rs = –0.64, p < 0.01). Additionally in the PSP group, FA decreases and MD increases of the trunk of the corpus callosum correlated significantly with the UPDRS part III score (FA; rs = –0.77, p < 0.001, MD; rs = 0.74, p < 0.005) and FA decreases in the trunk of the corpus callosum correlated negatively with Hoehn and Yahr staging (FA; rs = –0.62, p < 0,05). In the PD group, a significant positive correlation was found between R2* increases of left substantia nigra and the UPDRS part III score (r = 0.50, p < 0.05).
Principal component analysis and prediction accuracy of aggregated MRI parameters (Fig. 3)
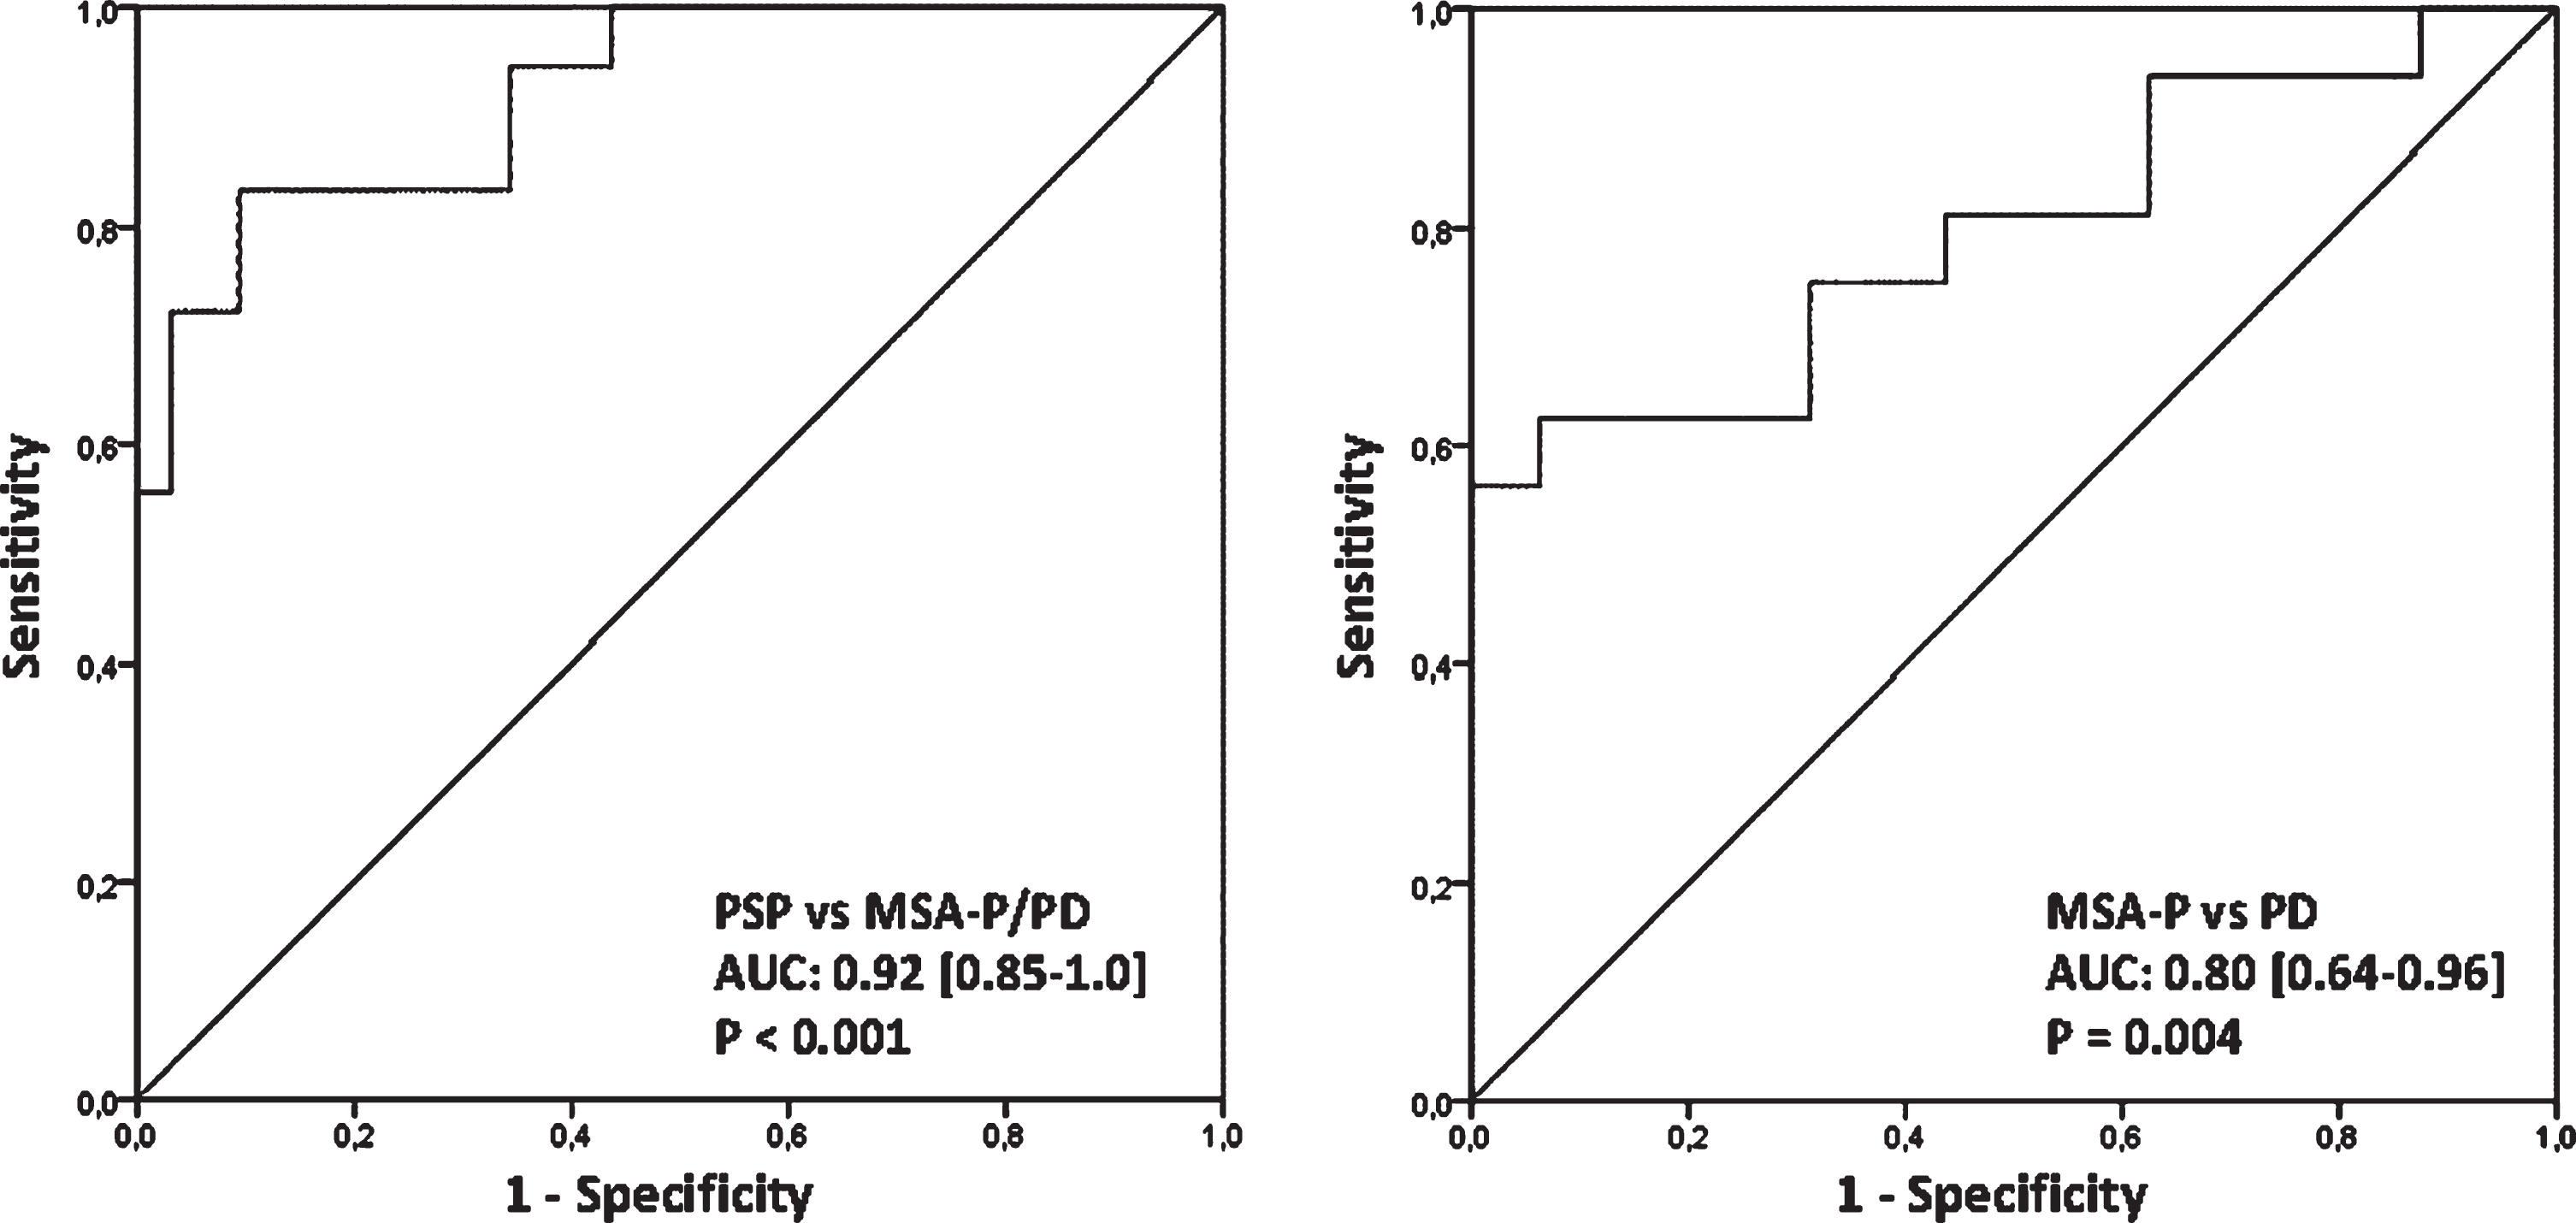
Prediction accuracy of aggregated MRI parameters derived from principal component analysis. MSA-P, Parkinson variant of multiple system atrophy; PD, Parkinson’s disease; PSP, progressive supranuclear palsy.
PCA identified two components with eigenvalues greater than one. The first component highly loaded on five MRI parameters comprising the mean MD value of the bilateral thalamus (L = 0.96), mean MD and FA values of the dentatorubrothalamic tract (L = 0.95 and L = –0.78, respectively), mean FA and MD values of the corpus callosum (L = –0.86 and L = 0.84, respectively). The second component mainly consisted of the mean MD and FA values of the middle cerebellar peduncle (L = 0.99 and L = –0.85, respectively). Both principal components accounted for 89% of the variance of all MRI variables and the Kaiser-Meyer-Olkin-Index of the model yielded a value of 0.76. The regression scores allowed to differentiate between PSP patients and MSA-P/PD patients yielding an AUC of 0.92 [95% CI: 0.85–1.0]. The evaluation of the diagnostic ability to separate MSA-P patients from PD patients showed an AUC of 0.80 [95% CI: 0.64–0.96].
DISCUSSION
We identified distinct patterns of neurodegeneration for PSP and MSA-P by applying PCA to multimodal voxel-based analysis of iron concentration, microstructural integrity, as well as grey and white matter volumes, which could not be predicted by visual inspection or ROI analysis. Recently, a whole-brain voxel-based approach was applied to multimodal MRI parameters in patients with MSA subtypes and PD and the potential of combining different MRI parameters to classify patients with MSA from PD was demonstrated [10]. However, no study so far has evaluated the diagnostic potential of multimodal MRI approaches to discriminate PSP and MSA-P from each other and from PD.
Out of 20 variables of mean voxel-cluster values, revealed through categorical group comparisons, PCA identified two principal components yielded by the multimodal MRI approach.
The first principal component strongly loaded on the DTI values of the thalamus, the dentatorubrothalamic tract and the corpus callosum. Since these signal alterations were identified in the analysis of variance of the PSP group in comparison to MSA and PD, we interpret the first component as PSP pattern (Fig. 1). The dentatorubrothalamic tract is the major efferent cerebellar pathway arising from the dentate nucleus of the cerebellum, through the SCP, toward the contralateral nuclei of the thalamus. Volume loss, diffusivity changes and altered functional connectivity in the dentatorubrothalamic tract of PSP were reported first by manually driven ROI methods [5, 21] and subsequently by automated MRI analysis techniques [22–24]. These MRI findings correspond with neuropathological findings showing axonal damage of the dentatorubrothalamic tract comprising loss of myelinated fibers, tau pathology and microgliosis in autopsy PSP cases [25]. Consistent with previous findings, alterations of DTI metrics in the SCP correlated with the clinical severity in PSP [24, 27]. Although cerebellar ataxia is one of the exclusion criteria of the consensus operational criteria for PSP, cerebellar involvement has been reported by postmortem [28], neurophysiological [29] and neuroimaging studies [30–32]. In particular the dentatorubrothalamic tract is one of the most affected region in PSP patients showing no association with cerebellar ataxia [22–24]. Microstructural disintegration and corresponding volume loss of the trunk of the corpus callosum identified as a second unique pattern of early-stage PSP was in line with a previous DTI study in moderately advanced PSP patients [6]. The anterior and middle part of the corpus callosum comprise neuronal projections that interconnect with the prefrontal, premotor, supplementary motor and primary motor cortices [33]. DTI changes and volume loss of the trunk of the corpus callosum in PSP might reflect emotional and cognitive impairments attributed to connected frontal lobe areas [6].
The second component derived from PCA was primarily composed of the DTI signal of the MCPs which were significantly altered in the MSA-P group (Fig. 2) and in line with previous ROI-based and voxel-based DTI MRI studies, comparing MSA-P cohorts with PD [34]. This MRI finding corresponds with neuropathological observations showing atrophy of MCPs and loss of pontine neurons and transverse pontocerebellar fibers in MSA [35]. However, in our study no significant differences were found in the MCP and putamen of the MSA-P group compared to the PSP group, indicating that additional parameters as those of identified by the principal component analysis are needed to also differentiate those patients.
Our study is the first to utilize an observer-independent and voxel based approach to localize changes of iron accumulation among PSP, MSA-P and PD patients throughout the entire brain. In the PSP cohort increased iron content was identified in the bilateral substantia nigra and red nucleus, the bilateral pallidum, right putamen and the occipital cortex compared to the HC group as well as in the bilateral pallidum and right putamen compared to PD. Excessive iron accumulation of the substantia nigra, red nucleus, pallidum and putamen was previously reported in neuropathological examinations and ROI-based MRI studies of PSP patients [36, 37]. Interestingly tau accumulation in PSP was found to co-localize with ferritin suggesting that ferritin/iron complex might interact with the modulation of tau aggregation [38]. Voxel-based analysis of R2* maps also localized signal increases in the putamen of the MSA-P group when compared to PD and HC groups which is in line with numerous ROI-based MRI studies and pathological findings of putaminal ferritin deposits [39, 40]. In agreement with ROI-based MRI studies [41, 42], the present voxel-wise analysis also revealed increased iron deposition in the substantia nigra of the PD group, which correlated with the motor severity in our study. This finding fits to the concept of in-vitro, animal and genetic studies reporting cumulative evidence of a pathogenetic contribution of local iron overload in degenerative parkinsonism [43, 44]. Surprisingly, R2* values of any region was not included as an outcome measure of the PCA suggesting that differences of iron accumulation measured by R2* MRI might play a minor role in the differential diagnosis among PSP, MSA-P and PD. This finding is also in line with a recently published multimodal MRI approach that, although successful to discriminate MSA-P from PD by using grey matter volume and DTI parameters, failed to identify significant R2* values [10].
A stepwise ROC analysis and corresponding AUC calculation was applied to investigate the diagnostic potential of regression scores yielded by PCA in three disease entities. In the first step PSP was successfully discriminated from MSA-P and PD with high accuracy yielding an AUC of 0.92, followed by the second step separating MSA-P from PD with moderate accuracy yielding an AUC of 0.80. Recently, other MRI approaches already indicated the improved potential of applying multiple sequences to enhance the differentiation of patients either to the diagnostic entity MSA or PD [9, 10]. However, our approach was the first to add a cohort of early stage PSP patients to this endeavor and clearly outperformed reported clinical investigations including conventional MRI analysis. Symptoms of atypical parkinsonian disorders frequently mimic those of PD, particularly in early stage of the disease [1, 2]. In case series with pathologically proven MSA or PSP, only 50% of MSA cases were diagnosed correctly by their primary neurologist [1] and the sensitivity of the diagnostic criteria for probable PSP was only 50% at the first visit [14].
We have to acknowledge three limitations of this explorative study. First, the lack of postmortem confirmation is a potential limitation of the present study. However, we stringently applied validated clinical criteria, with consensus on the diagnosis from 2 experts in movement disorders being required. The final clinical classification was anchored on the last visit after an extended follow-up period of at least 24 months. In addition, ancillary investigations including radiotracer imaging confirming nigrostriatal dopaminergic deficit and structural imaging excluding secondary causes were supportive of the degenerative nature of the movement disorder. Still, due to the overlapping heterogeneous presentation of parkinsonian disorders, we cannot entirely exclude, that patients with mild disease courses were misdiagnosed based on the criteria mentioned above. Second, the small sample sizes of this proof-of-principal study do not allow for the generalisation of the findings in the routine clinical setting at this stage, and validation in larger cohorts is warranted. Third, due to the resolution of DTI, partial volume effects of the CSF compartment are likely to occur, affecting neighboring voxel values of the gray and white matter compartment with lower signal. Although the masking procedure outlined in the method section removed 95% of CSF signal, a remaining signal inference occurring at the transition of CSF and the gray and white mater compartment cannot be entirely ruled out.
Conclusion
With the help of principal component analysis, the DTI metrics of voxel-clusters in the thalamus, dentatorubrothalamic tract, the corpus callosum and the middle cerebellar peduncle explained 89% of the variance of all MRI variables of the entire patients’ cohorts. In this proof-of-concept study, the identified components revealed high diagnostic accuracy to discriminate individual patients with PSP from those with MSA and PD and moderate accuracy to separate MSA-P patients from PD in their early disease stages. The findings of this study suggest that in the clinical setting dedicated MRI has the potential to improve the diagnosis of atypical parkinsonian disorders by including DTI metrics in the clinical routine MRI protocol and selecting the appropriate location of affected brain regions. Further studies should use the morphometric patterns identified here as part of probabilistic information added to a dedicated brain atlas and validate its diagnostic accuracy in larger samples sizes including patients with clinical uncertain presentations of a parkinsonian syndrome.
CONFLICT OF INTEREST
The authors have no conflict of interest to report.
Footnotes
ACKNOWLEDGMENTS
This study was funded by the Oesterreichische Nationalbank (Austrian Central Bank, Anniversary Fund, project number: 14174), the Austrian Science Fund (FWF: Der Wissenschaftsfonds, project number: KLI82-B00), the Uehara Memorial Foundation and Grants for International Activities in Life Sciences and Medicine and Keio University Medical School Fund.