
Abstract
Genome-wide association studies of Parkinson’s disease have revealed polymorphic variants associated with closely mapped genes of interest. We propose here that those genes may only represent the tip of an iceberg of regulatory effects and do not necessary reflect disease relevance. To usefully interpret a risk locus, one needs to consider 5 dimensions of information, which represent the three-dimensional structure of chromatin (dimensions #1– 3), which is locally variable across time (dimension #4), and, most importantly, dependent on cell type and context (dimension #5).
Too little is known about the biology and mechanisms underlying how risk variants, identified through genome-wide association studies (GWAS), confer risk to accurately label most risk loci. The lack of knowledge stems from the fact that, for most GWAS of disease, more than 90% of risk loci are in non-coding DNA and so the ultimate effects on protein levels or function are not immediately apparent. One way to reduce the complexity of risk loci is to use fine-mapping and chromatin biofeatures (e.g., histone modifications, nucleosome positioning, and transcription factor binding motifs) to pin down a single putative causal variation [1]. However, this only addresses the problem of which of several closely linked risk variants are relevant. A more intractable problem is in determining the identity of the gene or genes that show allele dependent changes associated with that variant. And finally, even given knowledge of all of the genes (in all cell types, stages and environmental conditions) that are affected, which one or more of those genes are actually related to the disease? Since most of the risk variants (risk single nucleotide polymorphisms – SNPs) are found at enhancers in intergenic and intronic regions (often more than 1 in linkage disequilibrium at a particular enhancer), the problem can be approximated as how best to match enhancers (and colocalizing risk SNPs) with the promoters of the target genes they regulate. In earlier GWA studies, these problems were avoided by simply identifying the closest gene to the most significant variant at a given locus and so many risk loci are still named after the nearest gene body or start site. Although on average, enhancer-gene interactions are more likely with smaller genomic map distances, it is proximity in 3-dimensional space plus time, within a cell nucleus of a particular cell type, that is relevant. Even at very short map distances, more than 40% of enhancers skip over the nearest gene and interact with those more distant [2]. Newer work considers the looping structure of chromatin [3], and can identify enhancer/gene interactions even at far cis or trans (between chromosomes). Methods exist to match enhancer/gene pairs [4]; these should become standard in GWAS follow-up studies. In the case of Parkinson’s disease (PD) and more recent GWAS, genes were identified by eQTL analyses [5, 6]. This represents a step in the right direction by directly confirming a set of genes with allele dependent expression changes. The nomination of some of these risk genes was further supported by an overall enrichment for lysosomal and autophagy biology of known importance to PD. However, many of the risk loci do not involve lysosomal and autophagy genes and most genes in these general categories are not near PD risk loci. It must be noted that eQTL analyses often have many false negatives and are less powerful due to bias for accessible tissues, cell type heterogeneity in samples, and population bias among donors [7]. Most importantly, it is far from clear that disease relevant tissues or conditions, such as age associated stress, can be known or weighted appropriately, a priori. Finally, most enhancers (and thus risk) affect the expression of more than one gene.
In summary, one must ultimately consider 5 dimensions in enhancer-promoter interactions driving PD risk: First, the three-dimensional space of chromatin in the nucleus (dimensions #1– 3), then the time or duration of interactions (dimension #4), and finally the cell type and context in which the interactions occur (dimension #5). The latter was considered by us [8] for PD risk using Roadmap data with annotated chromatin features for different tissue and cell types (http://www.roadmapepigenomics.org). The five dimensions are depicted in Fig. 1. All 5 will be influenced by the type and expression of transcription factors. Therefore, the nearest gene identity may not be informative and, though an improvement, eQTL based variant/gene pairing is likewise not always sufficient. Consequently, the gene names currently associated with risk loci should be regarded as a mapping convenience or best guesses. To really understand risk mechanisms stemming from GWAS, detailed follow-up studies are required.
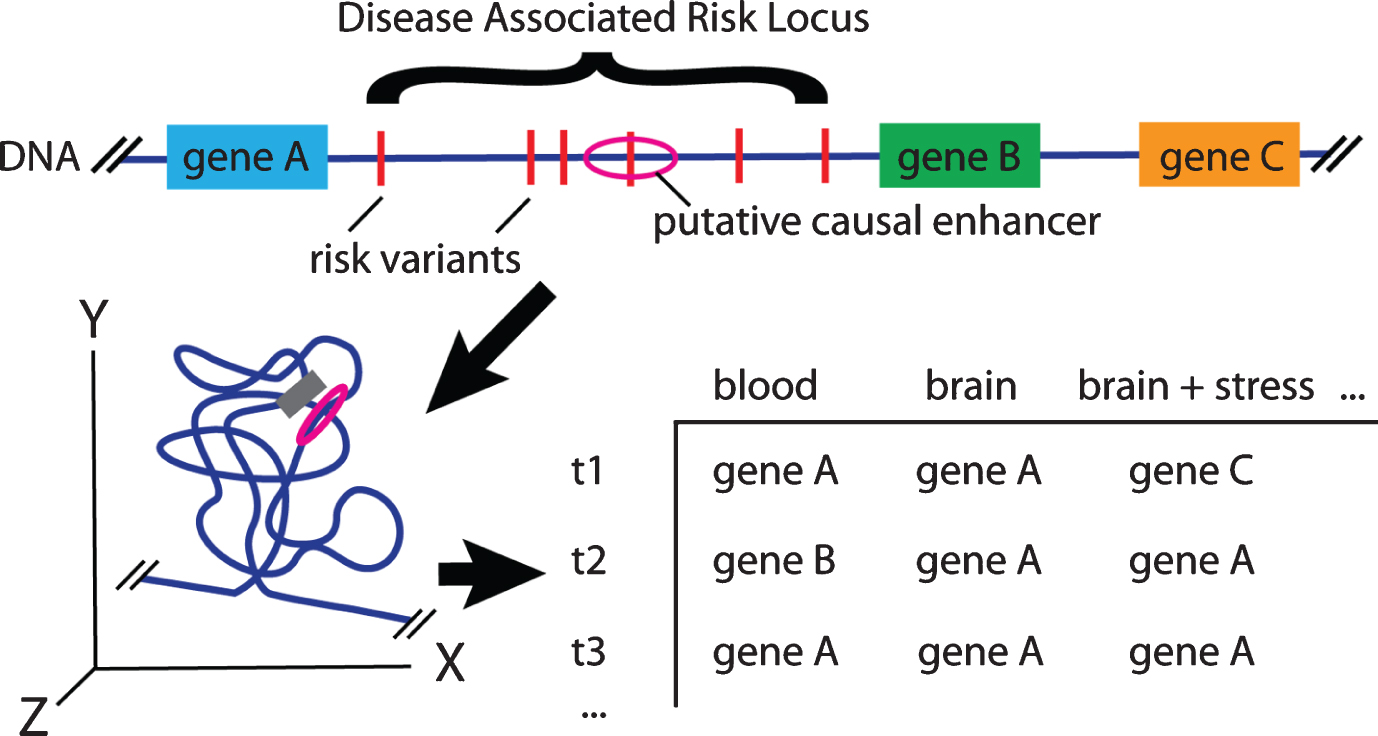
Hypothetical PD Locus: Inferring Risk Variant – Gene Interactions. At a given risk locus, an enhancer may be active in multiple tissues and share a topological associated domain with many nearby genes. At any given time (or in different samples) the risk enhancer may be interacting with, and altering the expression of different nearby or distal genes. Across cellular contexts, different enhancer activation and gene expression profiles occur leading to different interactions or eQTL results. Without further validation, it is not possible to know which gene or genes (A, B, C or even distal) is important in the etiology of PD.
CONFLICT OF INTEREST
Neither author declares any conflict of interest.
Footnotes
ACKNOWLEDGMENTS
Financial support from Van Andel Research Institute.