
Abstract
Background:
Depression is a common comorbidity of Parkinson’s disease (PD); however, the impact of antidepressant status on cortical function in parkinsonian depression is not fully understood. While studies of resting state functional MRI in major depression have shown that antidepressant treatment affects cortical connectivity, data on connectivity and antidepressant status in PD is sparse.
Objective:
We tested the hypothesis that cortico-limbic network (CLN) resting state connectivity is abnormal in antidepressant-treated parkinsonian depression.
Methods:
Thirteen antidepressant-treated depressed PD and 47 non-depressed PD participants from the Parkinson’s Progression Markers Initiative (PPMI) database were included. Data was collected using 3T Siemens TIM Trio MR scanners and analyzed using SPM and CONN functional connectivity toolbox. Volumetric analysis was also performed using BrainSuite.
Results:
We found decreased connectivity in the antidepressant-treated depressed PD group when compared to non-depressed PD between the left frontal operculum and bilateral insula, and also reduced connectivity between right orbitofrontal cortex and left temporal fusiform structures. Increased depression scores were associated with decreased insular-frontal opercular connectivity. No ROI volumetric differences were found between groups.
Conclusion:
Given the relationship between depression scores and cortico-limbic connectivity in PD, the abnormal insular-frontal opercular hypoconnectivity in this cohort may be associated with persistent depressive symptoms or antidepressant effects.
INTRODUCTION
Depression is prevalent in Parkinson’s disease (PD), with approximately 35% of patients reporting depressive symptoms and 17% diagnosed with major depressive disorder (MDD) [1]. However, the pathophysiology of parkinsonian depression is not fully understood. In a systematic review of the brain imaging literature comparing depressed PD to non-depressed PD or control subjects, Wen and colleagues [2] suggested that in general, PET studies have shown reduced metabolism, DTI studies have shown white matter compromise, T1-weighted MRI studies have shown either decreased or no change in grey matter density, and resting state fMRI studies have shown disruption in cortico-limbic connectivity in individuals with parkinsonian depression. However, not all studies agree [3–5].
Our current understanding of the neurological basis of depression is largely based on studies of MDD; however, again, findings are variable and brain activation studies reveal a long list of structures associated with depression [6–8]. Inter-study variability has led to speculation that depression may result from aberrant neural connectivity between multiple brain regions rather than discrete regional differences [9]. Indeed, several brain networks have been implicated in MDD [10]. For example, the cortico-limbic network (CLN) has been shown to have abnormal connectivity in MDD, which is altered in response to antidepressant administration [11].
Cortico-limbic dysregulation has previously been associated with both MDD [6, 12] and parkinsonian depression [2, 13]. In the cortico-limbic network, cortical structures, including frontal and cingulate cortices, have been described as disconnected from limbic regions such as the amygdala, hippocampus, insula, and subgenual cingulate [12]. Indeed, Anand and colleagues [6] found that participants with MDD displayed decreased BOLD related fluctuations between the anterior cingulate and limbic regions such as the amygdala. In addition, two recent studies showed similar findings in PD. Hu and colleagues [13] showed decreased connectivity of the amygdala with the inferior frontal and inferior orbitofrontal gyri in depressed PD (n = 20) compared to healthy controls (n = 43). Similarly, Huang and colleagues [4] reported decreased connectivity between the amygdala and frontal-parietal structures in depressed PD (n = 19) compared to non-depressed PD (n = 19). Therefore, cortico-limbic dysregulation is associated with measures of depression in PD as well.
However, not all studies assessing connectivity of parkinsonian depression agree. The cortical structures that have shown altered connectivity with limbic regions vary across studies. For example, Huang and colleagues [4] reported decreased connectivity between the left amygdala and both the ipsilateral superior and middle frontal gyri in parkinsonian depression. However, Sheng and colleagues [14] reported increased connectivity between these same structures, as well as decreased connectivity between the left amygdala and contralateral inferior frontal gyri. Given these contradictory results, concern has been raised about the validity of fMRI findings [15]. However, one factor that may contribute to this heterogeneity is antidepressant status.
Antidepressants clearly impact measures of connectivity in MDD [11] in the cortico-limbic network [16]. For example, Chen and colleagues [16] showed that functional connectivity between the amygdala and cortical structures was reduced in 19 participants with MDD compared to controls. However following 8 weeks of fluoxetine treatment, connectivity subsequently increased to normal values. In fact, antidepressant treatment of MDD has been shown to broadly normalize connectivity differences outside of the CLN as well. For example, altered default mode network connectivity has been shown to return to normal levels following antidepressant treatment in two studies of depression [17, 18]. Although strong evidence exists suggesting that CLN connectivity is normalized by antidepressant treatment in MDD, the effect of antidepressants on the CLN in parkinsonian depression is not clear.
In previous work on parkinsonian depression, about half of the resting state fMRI studies have excluded participants on antidepressants [13, 19–21], while the other half have not reported antidepressant status [4, 22–24]. Thus, the current study was designed to fill this gap. We tested the hypothesis that antidepressant-treated depressed PD participants would have altered cortico-limbic network connectivity. We obtained data from the Parkinson’s Progression Markers Initiative (PPMI) database and compared connectivity and gray matter differences in the CLN between antidepressant-treated depressed PD and non-depressed PD. We also correlated connectivity values with neuropsychological measures of depression.
MATERIALS AND METHODS
Participants
Data from participants in the Parkinson’s Progression Markers Initiative’s (PPMI) De Novo PD group were obtained from the PPMI database. Criteria for this De Novo PD group was diagnosis of PD within 2 years of participation and not being on PD medications at time of enrollment; however, some participants started dopamine replacement therapy in the time span between enrollment and imaging. The PPMI database was searched on November 8, 2015, (ppmi-info.org) using the search criteria “PD” research group with “fMRI”, which yielded 175 PD image sets. Inclusion criteria included: PD group, existing fMRI data, Geriatric Depression Scale-short (GDS-s) data, age 55 or older, and right-handed. Exclusion criteria included abnormal anatomy. Subsequently, 60 PD subjects met the study criteria and were included. All participants provided informed consent at the institutions where the images were collected. Each participant’s initial resting state fMRI at time of neuropsychiatric assessment and corresponding anatomical MP-RAGE MRI files were obtained.
To test the hypothesis that connectivity was aberrant in antidepressant-treated parkinsonian depression, PD participants were divided into 2 groups: PD participants currently being treated for depression at time of imaging (antidepressant-treated depressed PD; n = 13) and PD participants not currently being treated for depression (non-depressed PD; n = 47).
Demographics, neuropsychological testing, and motor performance
Demographic measures were collected from the PPMI database including: gender, age, race, handedness, years of education, years since diagnosis of PD, concomitant medications, and history of depression. The duration of PD, or years since diagnosis of PD, was calculated by determining the time elapsed between the initial diagnosis of PD and the date on which the resting state fMRI was acquired. Duration of depression and duration of antidepressant status were unclear in the PPMI database and were thus not reported. Behavioral measures were also collected from the PPMI database including: Geriatric Depression Scale-short (GDS-s), Montreal Cognitive Assessment (MoCA), Hoehn and Yahr (HY), and Movement Disorder Society UPDRS scores (MDS-UPDRS). Note that the MDS-UPDRS consists of four parts with part I measuring non-motor experiences of daily living, part II measuring motor experiences of daily living, part III measuring motor function, and part IV measuring motor complications [25].
The Geriatric Depression Scale-short (GDS-s) was used to quantify depression [26]. It has been recently validated to be an appropriate screening test for depression in PD [27]. GDS-s scores are scaled from 0 to 15, where a score >5 is sensitive for depression. The GDS-s score which was closest in time to the acquisition date of the resting state fMRI was recorded from the PPMI database.
Since dopaminergic treatment has been suggested to impact resting state connectivity results [28], dopaminergic medications at time of fMRI acquisition was determined for each subject. Dopaminergic equivalents were then calculated using conversion factors provided by parkinsonsmeasurement.org (http://www.parkinsonsmeasurement.org/toolBox/levodopaEquivalentDose.htm) including: levodopa, levodopa controlled release, tolcapone, entacapone, pramipexole, ropinirole, pergolide, bromocriptine, rasagiline, oral selegiline, and sublingual selegiline. Dopaminergic equivalent values were then correlated with connectivity as described in the image analysis section.
Image acquisition
All images were obtained from the PPMI database. The resting state fMRI and corresponding anatomical T1-weighted MP-RAGE images were collected for each included participant. By searching the image headers, we determined that all PPMI images were acquired using a 3T Siemens TIM Trio MR system at various sites. Functional T2*-BOLD images were acquired with the following parameters: TR = 2400 ms, acquisition matrix = 68×66, and slice thickness = 3.3 mm. The methods for acquisition can be reviewed in detail in PPMI’s Imaging Technical Operations Manual (http://www.ppmi-info.org/wp-content/uploads/2010/07/Imaging-Manual.pdf).
Image preprocessing
Statistical Parametric Mapping version 12b (SPM12b; www.fil.ion.ucl.ac.uk/spm) and CONN functional connectivity toolbox version 15 [29] (http://www.nitrc.org/projects/conn) were used in imaging preprocessing and analysis. First, SPM12b was used to convert the available structural and functional DICOM files provided by PPMI into NIFTI files for analysis in CONN. Data was segmented to create grey matter, white matter, and CSF maps. In addition, the artifact detection tool (ART) was used in SPM12b to determine head motion and outliers for each subject to later be used during denoising. In CONN, the first ten functional images were excluded for each sample. The remaining data was then normalized, slice-time corrected, and smoothed with Gaussian kernel. Next in the denoising step, white matter, CSF, effect of rest, and head motion outliers were regressed.
Seed selection
Before performing first-level and second-level-analysis, seeds were identified. Data analysis was restricted to cortico-limbic seeds based on the initial cortico-limbic dysregulation hypothesis in MDD identifying major nodes of interest [12] and a search of the PD literature identifying nodes with altered connectivity [4, 19–24]. Cortico-limbic network seeds included orbitofrontal cortex (CONN seed #60–61) [13, 22], insula (seed #3-4) [4, 20–22], amygdala (seed #102-103) [4, 30], hippocampus (seed #100-101) [21], and accumbens (seed #104-105). The frontal operculum (seed #76-77) [13, 22] was later identified as an additional seed of interest after overlapping t-test differences between groups were found to correlate with GDS-s scores. See Table 1 for a list of MNI coordinates of the chosen seeds. See Fig. 1 for a visual representation of the positioning of the seeds.
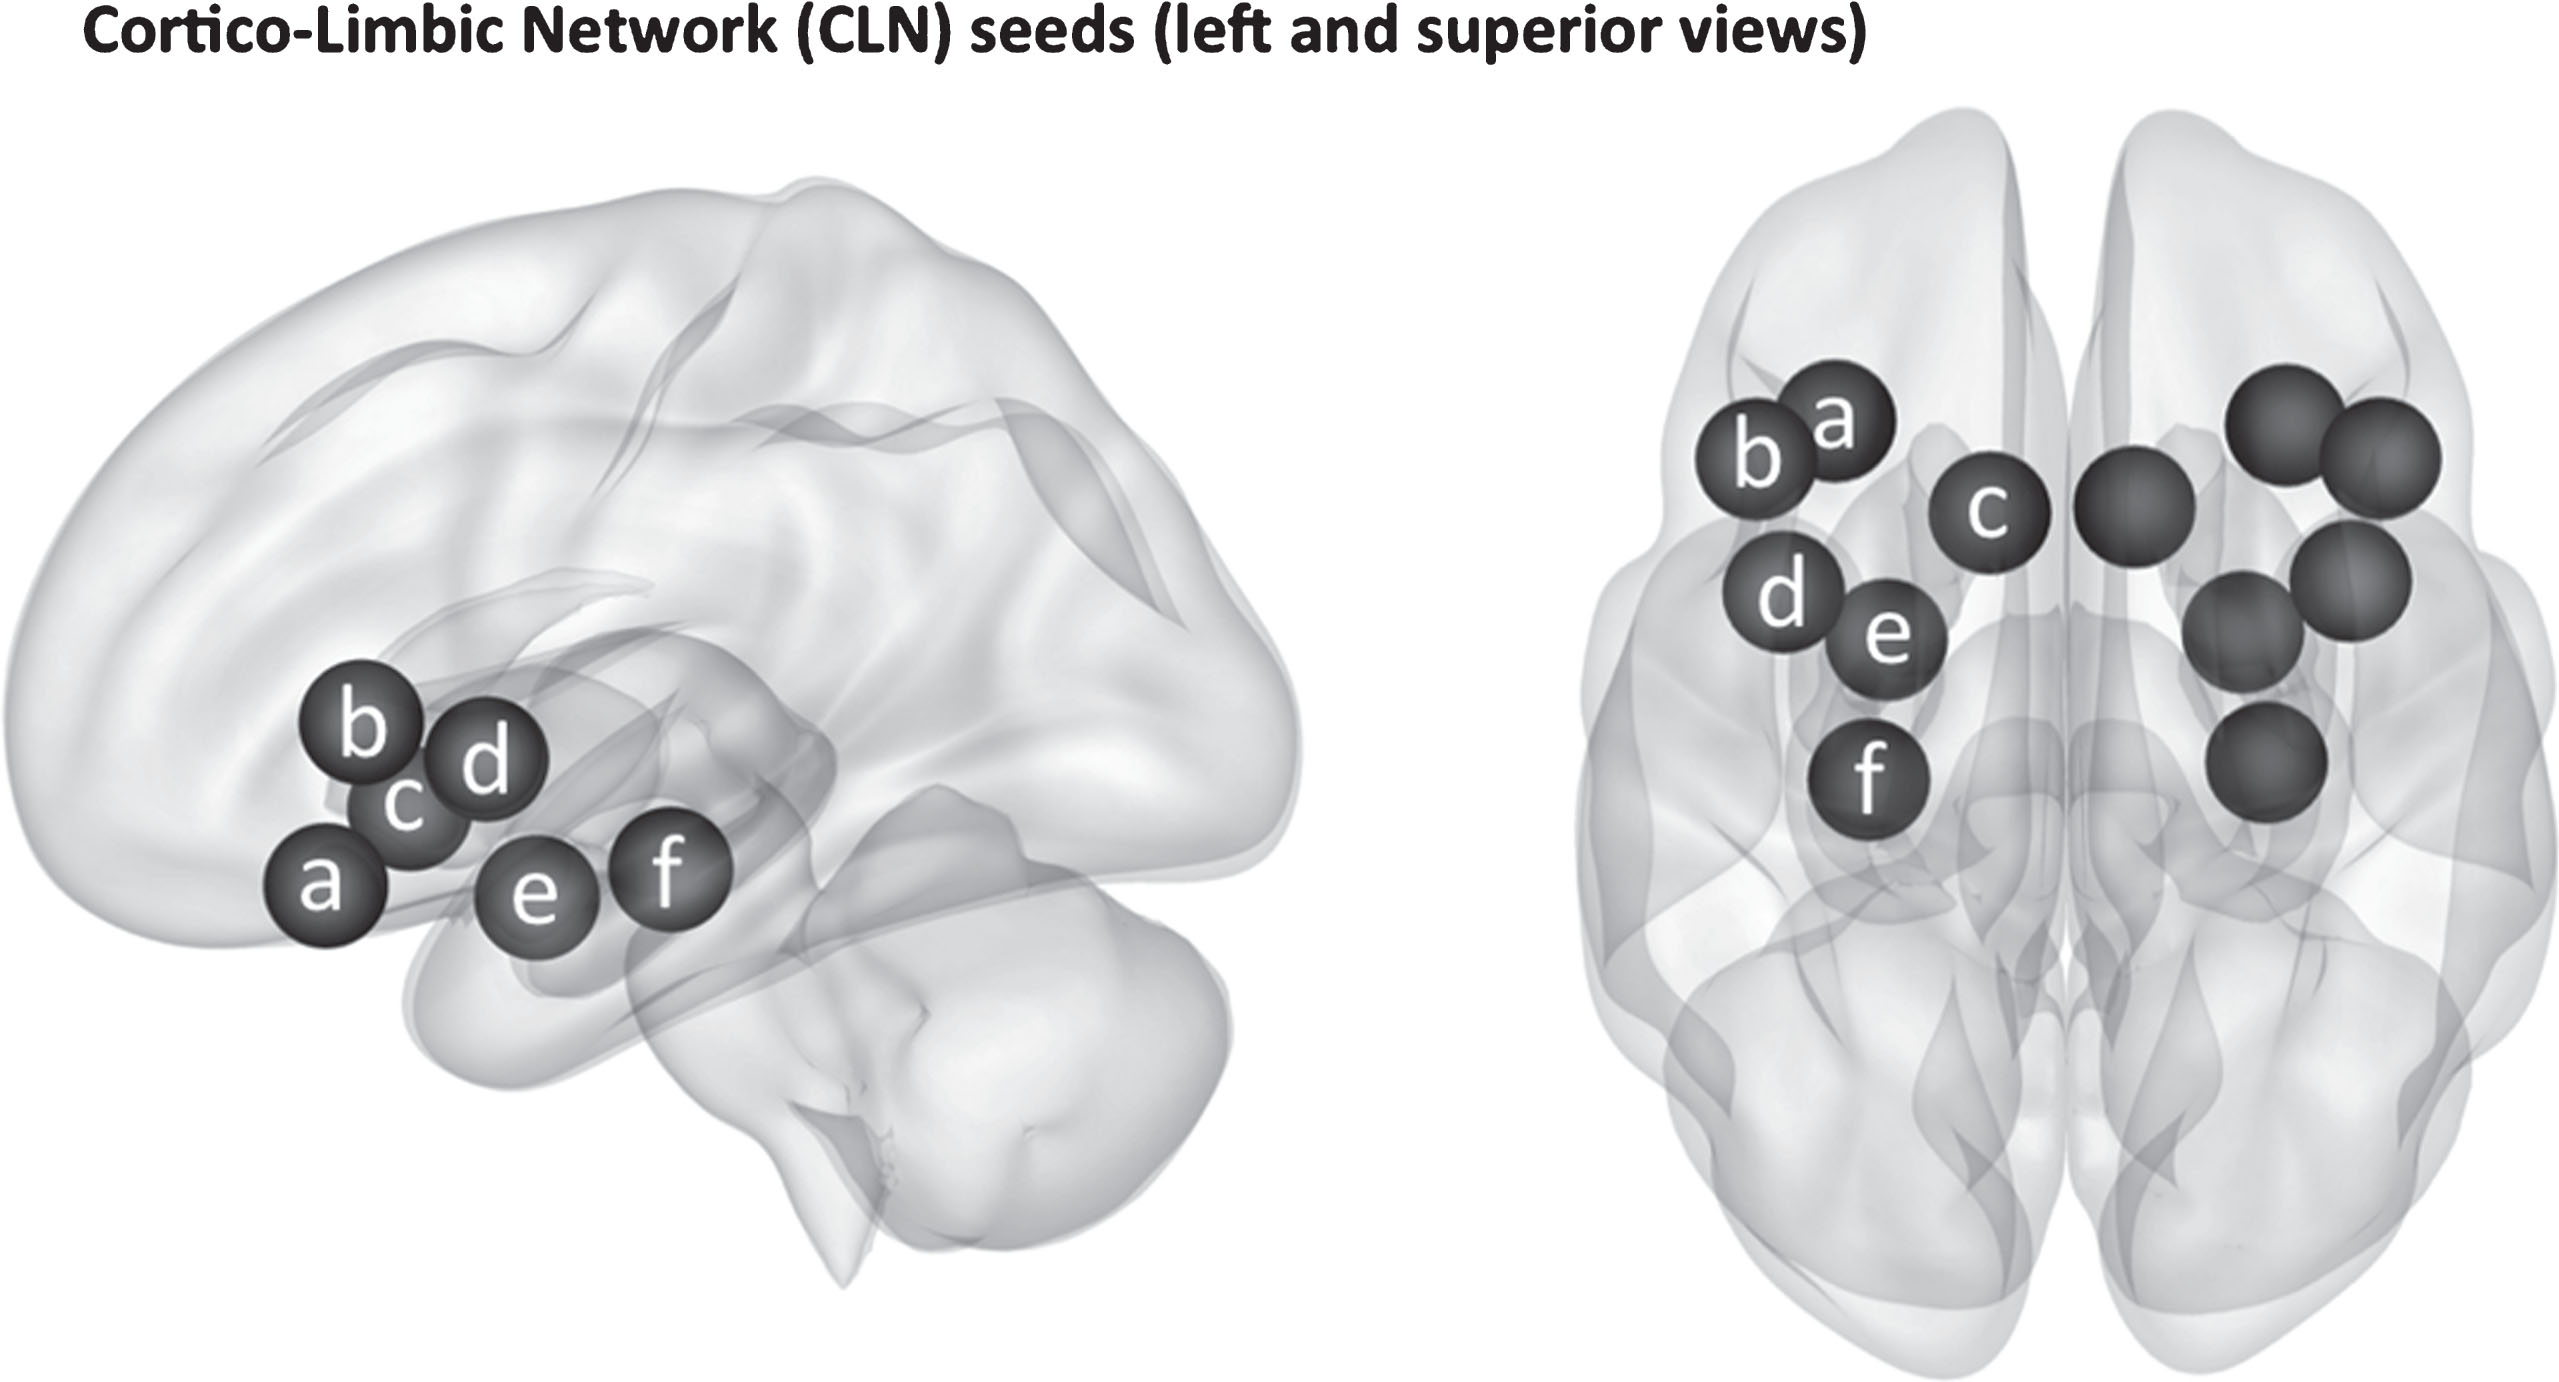
3-Dimensoinal display of the cortico-limbic network (CLN) seeds assessed in this experiment. The regions of interest shown include the (a) left orbitofrontal cortex, (b) left frontal operculum, (c) left accumbens, (d) left insular cortex, (e) left amygdala, and (f) left hippocampus. Note that both left and right cortico-limbic nodes were assessed, but only the left are labeled in this figure.
MNI coordinates of seeds used in this experiment for ROI-to-ROI connectivity analysis
CLN seeds include: insula, orbitofrontal cortex, frontal operculum cortex, hippocampus, amygdala, and accumbens.
Image first-level and second-level-analysis
First-level-analysis was done using the CONN Toolbox. ROI-to-voxel maps displaying connectivity for each seed were produced for each subject, see Table 1 for the list of seeds. Therefore, each subject (n = 60) produced 12 connectivity maps, 1 for each of the 12 seeds. Connectivity was expressed as z-values derived from the correlation coefficient of the connectivity for each voxel. Individual connectivity for each participant from first-level-analysis (not reported) was used in second level analysis. Second-level-analysis was also performed using CONN Toolbox. ROI-to-ROI maps were created for comparisons of antidepressant-treated depressed PD and non-depressed PD to assess differences in connectivity and correlations with neuropsychiatric variables. ROI-to-ROI maps were chosen for second-level-analysis due to their superior reliability [29].
First, t-tests were performed in second-level-analysis comparing the experimental groups. Significant differences between groups were plotted on ROI-to-ROI maps. Statistically significant connectivity differences were defined as having a false discovery rate-corrected p-value (p-FDR) <0.05, as described by Whitfield-Gabrieli and Nieto-Castanon [29] to accurately reduce false-positives when performing connectivity analyses when not specifying an a priori hypothesis.
Next, connectivity was correlated with GDS-s and dopamine equivalent scores. Significant correlations were plotted on ROI-to-ROI maps for the total PD group. The total PD group was chosen when calculating correlations instead of the separated non-depressed and depressed PD groups for two reasons: to increase power and to increase the dynamic range of depression scores between subjects.
Then, ROI-to-ROI maps showing t-test differences and ROI-to-ROI maps showing correlations were compared for overlapping findings. Brain regions were thus identified that had both connectivity differences and correlations of this connectivity with depression scores, implying the group connectivity differences found were associated with measures of depression.
Volumetric analysis
Volumetric analysis of both groups was performed using BrainSuite (Version 17a; http://brainsuite.org). We used an automated sequence to extract surface models and volumes from the cerebral cortex. Probabilistic masks and atlases were used for co-registration between the subject and the atlas. Using the same atlas in the CONN toolbox, the final parcellation resulted in computed volumes, in mL, of the 12 previously selected ROIs. The volumes of each ROI were then divided by the sum of all other volumes to account for natural variations in brain volume. We then compared volume, across groups for all ROIs evaluated for connectivity using an unpaired samples t-test in SPSS (version 23; http://www.ibm.com/analytics/us/en/technology/spss/) to determine the significance of differences in volume ratios.
Statistical analysis of demographics and behavioral testing
SPSS was also used to perform unpaired samples t-tests comparing antidepressant-treated depressed PD and non-depressed PD groups for baseline characteristics, motor scores, behavioral data, and dopamine equivalent differences.
RESULTS
Baseline characteristics
The antidepressant-treated depressed PD and non-depressed PD participants were similar for gender distribution, age, handedness, years since diagnosis of PD, years of education, and MOCA score. The antidepressant-treated depressed PD group scored significantly higher on the GDS-s than non-depressed PD (Table 2). See Table 2 for baseline characteristics.
Baseline characteristics, neuropsychological scores, and motor scores of the antidepressant-treated depressed PD and non-depressed PD groups
Most baseline characteristics were similar across groups. However, the antidepressant-treated depressed PD had higher GDS-s scores than the non-depressed PD group. MDS UPDRS 1 Questionnaire and MDS UPDRS 1 scores were also significantly higher in the antidepressant-treated depressed PD group. Note that the MDS UPDRS 1 measures non-motor experiences of daily living, with a higher score indicating more impairment.
The antidepressant-treated depressed PD group was medicated for depression at time of fMRI acquisition, and the medications included: bupropion (n = 3), bupropion + venlafaxine (n = 1), citalopram (n = 3), escitalopram (n = 1), opipramol (n = 1), paroxetine (n = 1), paroxetine + trazodone (n = 1), and sertraline (n = 3). Individual dopamine replacement status varied within groups, but average dopamine equivalents were not significantly different for antidepressant-treated depressed PD versus non-depressed PD groups (Table 2).
Both the antidepressant-treated depressed PD and non-depressed PD groups were assessed for baseline motor deficits with the MDS-UPDRS. Results were similar for parts 2, 3, 4, and total scores. However, antidepressant-treated depressed PD had higher scores than non-depressed PD for MDS-UPDRS part 1 (non-motor experiences of daily living) and its questionnaire (Table 2).
Cortico-limbic network (CLN) group connectivity differences
Disconnection of limbic structures, namely the insula, from cortical structures was observed in the antidepressant-treated depressed PD group. Specifically, the antidepressant-treated depressed PD group showed decreased connectivity between the left frontal operculum cortex and bilateral insula when compared to the non-depressed PD group. In addition, the antidepressant-treated depressed PD group showed decreased connectivity between the right orbitofrontal cortex and temporal fusiform structures (Table 3).
Unpaired t-test group comparison between antidepressant-treated depressed PD and non-depressed PD connectivity
Here, positive t-values indicate increased connectivity and negative t-values indicate decreased connectivity in the antidepressant-treated depressed PD group when compared to the non-depressed PD group. Note all brain regions showing significant connectivity differences were negative, meaning decreased connectivity in the antidepressant-treated PD group or increased connectivity in the non-depressed PD group. Only significant values are shown (p-FDR<0.05).
CLN connectivity correlations
Correlations between PD connectivity and GDS-s scores overlapped with previously stated connectivity differences in the cortico-limbic network (Table 4). Notably, connectivity between the left frontal opercular cortex and the right insula was negatively correlated with GDS-s scores in the total PD group, corresponding to connectivity differences between antidepressant-treated depressed PD and non-depressed PD groups (Fig. 2). This negative correlation indicates that the reduced connectivity in the antidepressant-treated depressed PD group was associated with higher depression scores.
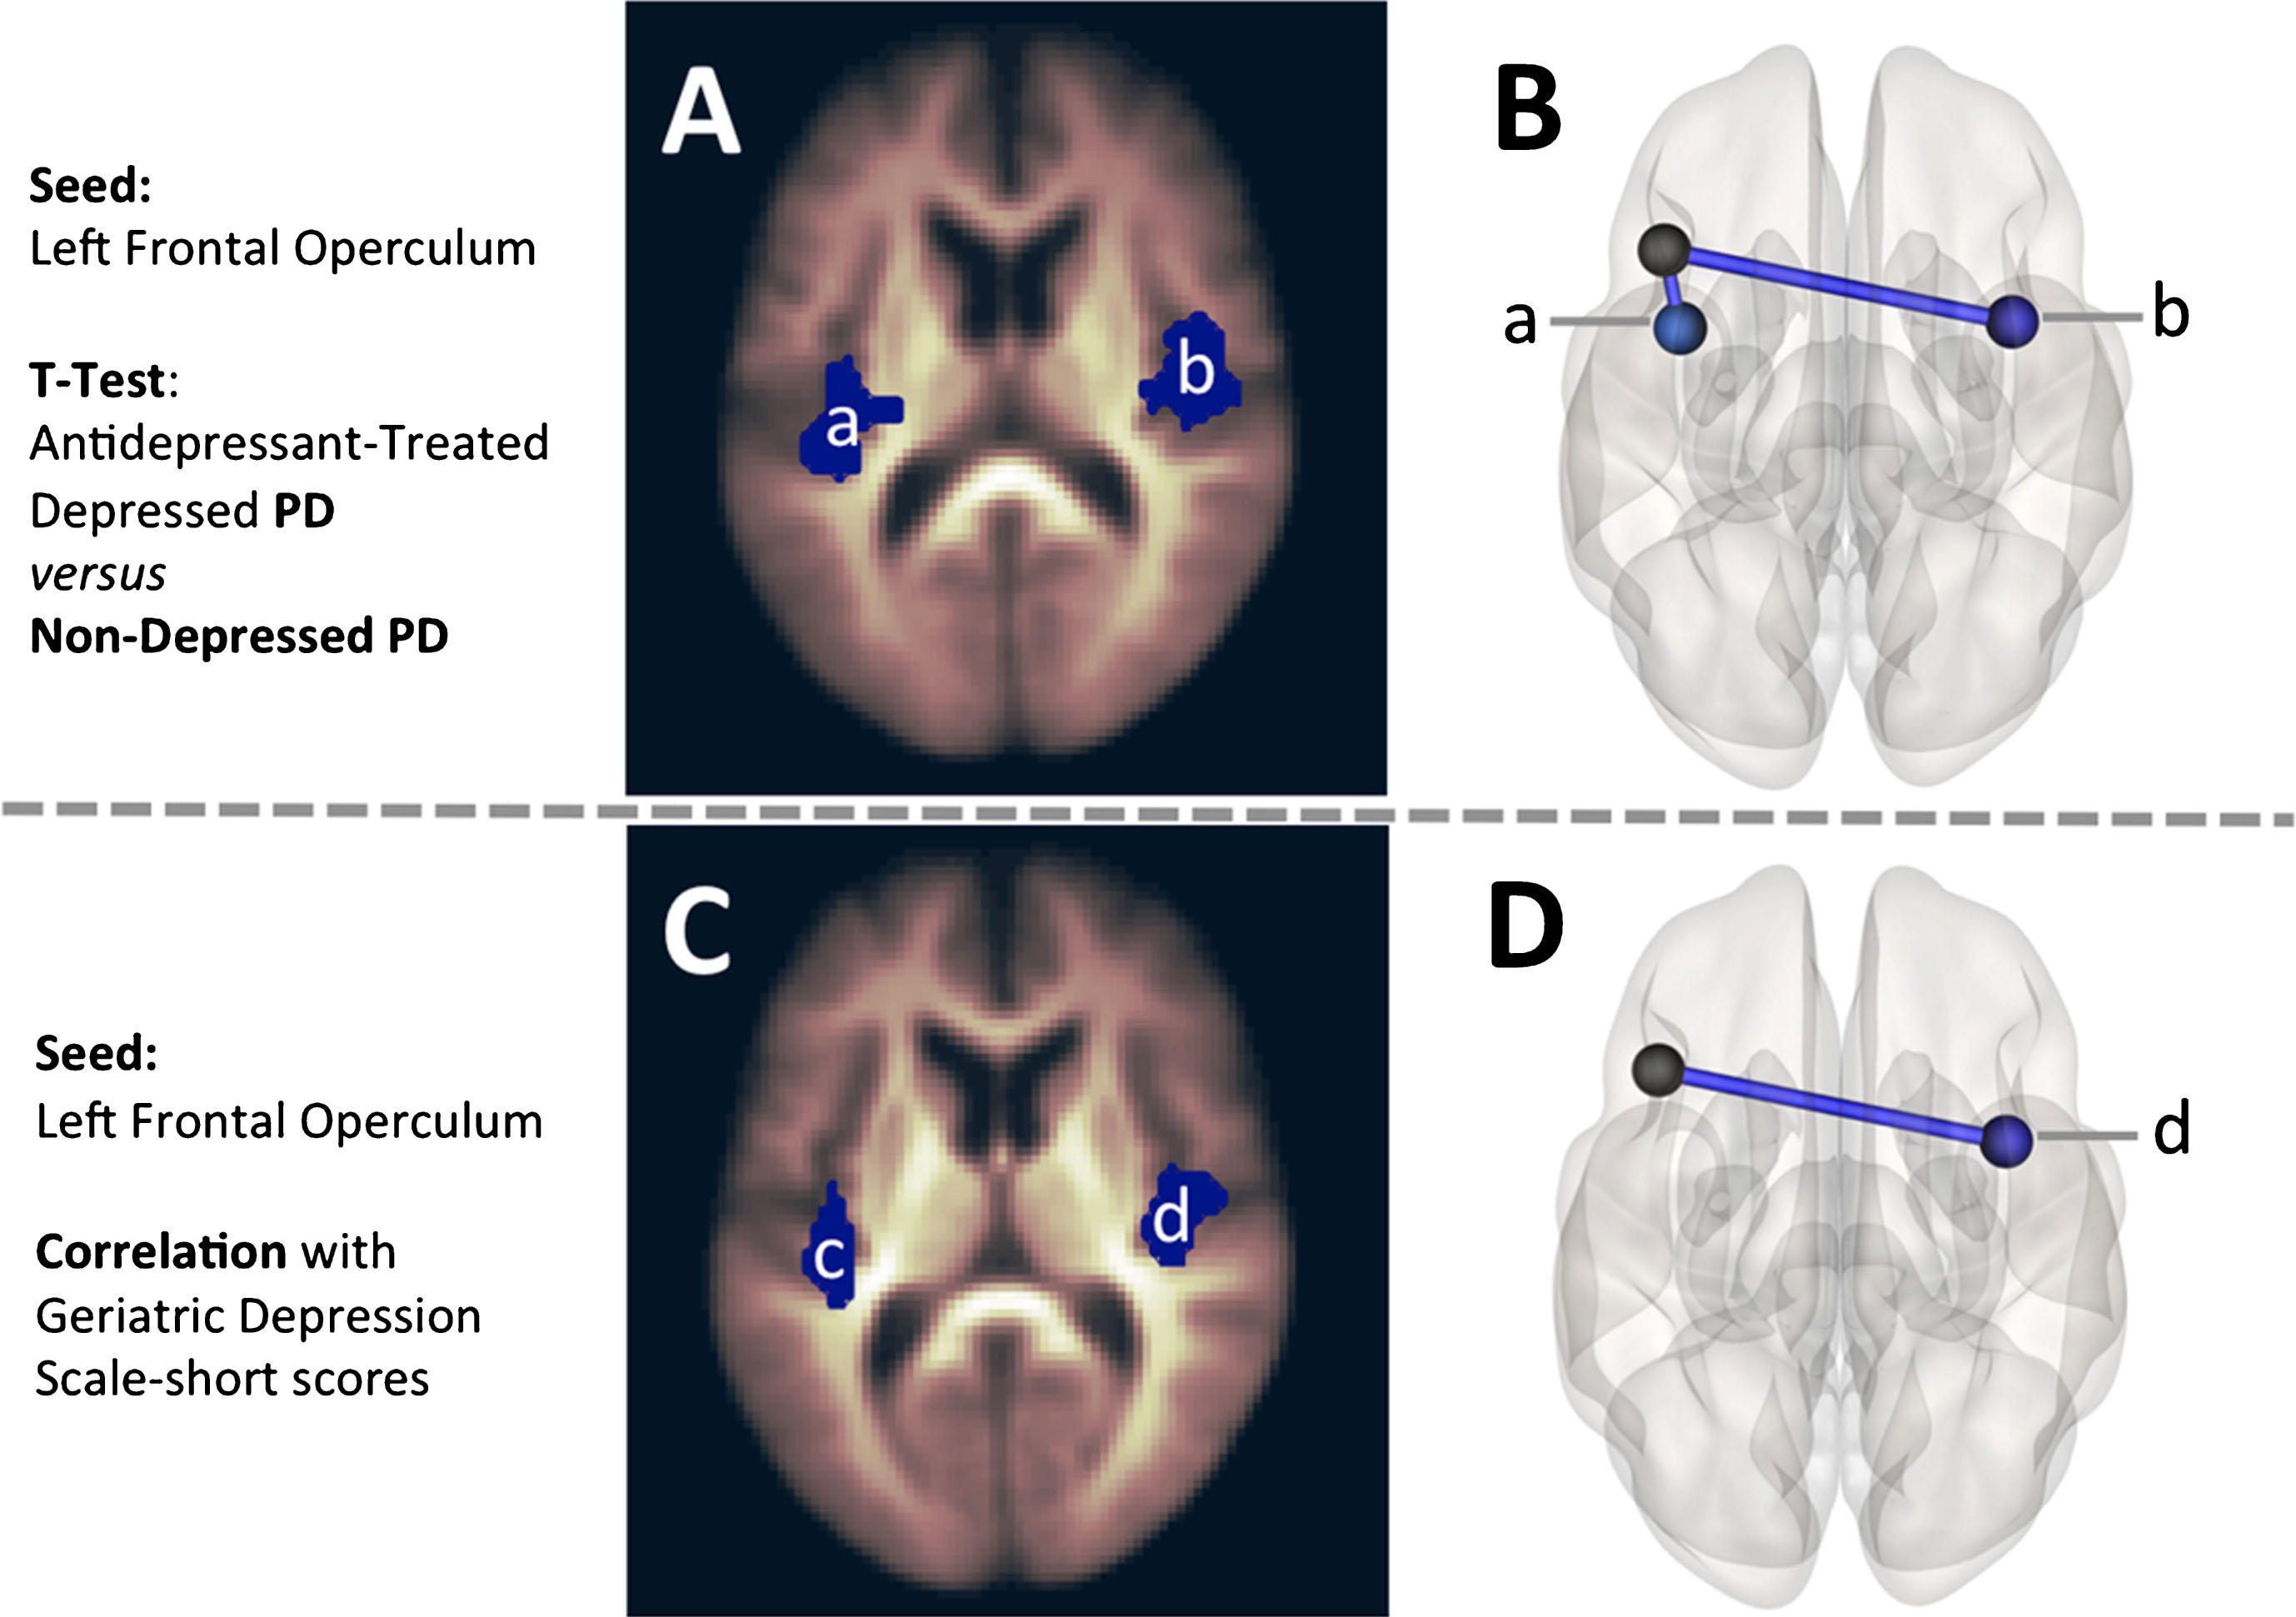
Seed-to-Voxel (A, C) and ROI-to-ROI (B, D) maps are displayed for the seeds found to have overlapping t-test differences and Geriatric Depression Scale-short correlations. The left frontal operculum was examined in A, B, C, and D. In A and B, the left frontal operculum showed reduced connectivity in the antidepressant-treated depressed PD group when compared to non-depressed PD with: bilateral insula (a, b). Then in C and D, the connectivity between the left frontal operculum and the contralateral insula (d) was shown to have a negative correlation with Geriatric Depression Scale-short scores, suggesting reduced connectivity in this brain region was associated with higher depression scores.
Geriatric Depression Scale short (GDS-s) correlations with connectivity in the total PD group (n = 60)
Here, negative t-values represent a negative correlation between GDS-s scores and connectivity, meaning that higher depression scores were associated with lower connectivity values in these stated areas. Only significant values are shown (p-FDR<0.05).
In addition, connectivity between the left amygdala and left parahippocampal gyrus was negatively correlated with GDS-s scores in the total PD group; however, this did not overlap with connectivity differences between the two groups (Table 4).
Dopamine equivalent correlations
As dopamine replacement status has also been shown to affect connectivity, we sought to determine if connectivity differences identified between groups were associated with dopamine equivalent dose. No correlations between dopamine equivalent dose and connectivity were seen in the antidepressant-treated depressed, non-depressed PD, or total PD groups.
Volumetric analysis
Volumetric analysis was performed to determine if the statistically significant differences in connectivity between groups could be attributed to changes in grey matter density. No statistically significant volumetric differences were found between groups in any of the following regions: right frontal orbital cortex, right insula, left insula, left anterior temporal fusiform cortex, and left frontal operculum cortex.
DISCUSSION
In this study, we examined cortico-limbic network connectivity and the effects of antidepressant status in PD. In the antidepressant-treated depressed PD group, cortico-limbic dysregulation was identified. First, we observed decreased connectivity between the right insula and left frontal operculum when compared to non-depressed PD. Cortico-limbic connectivity between these regions correlated with depression scores. Second, right orbitofrontal connectivity with the left temporal fusiform structures was decreased in the antidepressant-treated depressed PD group, but was not correlated with depression scores. No volumetric differences were identified in relevant ROIs.
Insular-frontal opercular hypoconnectivity correlates with depression
Insular hypoconnectivity has previously been documented in both untreated MDD [31, 32] and untreated parkinsonian depression [20, 21] with frontal structures including the bilateral orbitofrontal gyri [21]. However, not all findings are consistent. Connectivity between the insula and ipsilateral inferior frontal gyrus has been found to be increased in one study of untreated parkinsonian depression [14]. Following antidepressant treatment, abnormal connectivity between the insula and frontal structures has not been extensively reported in either MDD or parkinsonian depression. However, in a study of MDD, Yang and colleagues [33] reported increased connectivity between the insula and hypothalamus, which was selected as the seed, following 8 weeks of sertraline treatment when compared to pre-treatment scans. Furthermore, hypothalamic connectivity was also decreased with frontal structures following treatment. Therefore, this study implied that antidepressant administration can alter both insular and frontal connectivity in MDD. Indeed in our experiment, we found insular-frontal operculuar connectivity to be decreased when comparing antidepressant-treated depressed PD to the non-depressed PD group. This reduced connectivity between the contralateral insula and frontal operculum in the antidepressant-treated depressed PD group was negatively correlated with depression scores, with higher depression scores associated with less connectivity. Overall, our findings suggest that fronto-insular hypoconnectivity is both present in antidepressant-treated depressed PD and is associated with depression.
The insula has broad efferent connections to cortical structures including the frontal operculum and orbitofrontal cortex which sends afferent information back to the insula [34]. These frontal structures are regulated by serotonin, where 5-HT1A receptors have inhibitory and 5-HT2A receptors have excitatory effects [35]. Given that SSRIs have been posited to work at least in part by affecting serotonin transporters through inhibition, expression, and/or occupancy [36], it is reasonable to consider the idea that antidepressants may also affect connectivity through their effects on serotonin transporters. Frodl and colleagues [37] recently demonstrated decreased activation of the right insula with increased methylation of a serotonin transporter gene when participants with MDD performed an attention-switching task. This finding suggests changes in serotonin transporter expression were associated with changes in insular activity. Further, Ballanger and colleagues demonstrated reduced [18F]MPPF tracer (a competitive antagonist of the 5-HT1A receptor) uptake in the right insula and orbitofrontal cortex in addition to hippocampal and temporal areas in depressed PD when compared to non-depressed PD [38]. These results are in agreement with our findings; however, this study was limited with its small sample size with 4 depressed PD and 8 non-depressed PD [38]. It is possible that the fronto-insular changes seen in our experiment are associated with altered serotonin transporter expression; however, this was not directly tested in our experiment.
Functionally, activity in insular and frontal opercular regions have been linked to taste [39], obesity [40], inhibition [41], and interoception [42]. In addition, depression has been associated with lesions of the frontal operculum in a case series of 4 individuals [43]. This link between depression and the fronto-insular regions are posited to be due to their association with interoception. The insula is hypothesized to receive emotional and motivational input, playing a role in the assessment of self-relevance in a process termed interoception [42]. Interoception is altered in depression, with measures of interoceptive accuracy being reportedly decreased in MDD [44]. Previously, an experiment by Zaki and colleagues [45] used task-based fMRI to demonstrate that increased activity in the right anterior insula and right inferior frontal operculum was associated with both interoceptive and emotional perceptive tasks in healthy subjects. Taken together, our experiment supports the presence of fronto-insular hypoconnectivity in parkinsonian depression, which is consistent with impaired interoceptive activity in these regions as seen in prior studies.
Orbitofrontal-temporal fusiform hypoconnectivity
Orbitofrontal-temporal connectivity has previously been shown to be altered in both depression [21] and PD [22]. Specifically, orbitofrontal connectivity with the inferior temporal gyrus, the gyrus adjacent to the fusiform cortex, was shown to be increased in non-depressed PD when compared to controls [22], suggesting these changes may be intrinsic to PD pathology. In our experiment, orbitofrontal connectivity with the contralateral temporal fusiform cortex was reduced in the antidepressant-treated depressed PD group when compared to non-depressed PD. Given that this connectivity difference did not correlate with depression scores, this hypoconnectivity is not well explained by depression severity. Further, these connectivity differences may be due to medication effects. Chen and colleagues [46] showed that a single dose of citalopram could decrease blood flow to various brain regions, including the orbitofrontal gyri and the fusiform cortex. Further, Kennedy and colleagues [47] showed that patients who responded to either venlafaxine or cognitive-behavioral therapy had altered glucose metabolism, including decreased metabolism in the orbitofrontal gyri and increased metabolism in the occipital-temporal cortex. However in our experiment, we did not compare functional data between responders and non-responders given the low sample size in the antidepressant-treated depressed PD group (n = 13) and lack of clinical data directly following initiation of treatment to verify response. Therefore, it is unclear if the orbitofrontal-temporal fusiform hypoconnectivity is being driven by treatment responders in our experiment’s cohort.
Functionally, the orbitofrontal cortex and fusiform cortex have both been implicated in the emotional processing of faces and scenery [48, 49]; however, the direct influence of each region on the other remains unclear. Orbitofrontal-fusiform connectivity has indeed been associated with both emotional processing of faces [50] and depression [51] although. Responders to antidepressants or cognitive-behavioral therapy have shown alterations in glucose metabolism in these areas [47], but it is unknown if these changes are associated with a change in emotional processing of faces and environmental stimuli.
Amygdalar-parahippocampal connectivity correlates with depression
Amygdalar hypoconnectivity with cortical structures has previously been demonstrated in both untreated MDD [16], untreated depression in PD [13], and depression in PD where antidepressant status was not specified [4]. In MDD, this amygdalar hypoconnectivity with cortical structures, including parahippocampal and temporal gyri, normalized following treatment with 8 weeks of fluoxetine [16]. However in our data from antidepressant-treated depressed PD patients, we did not find any connectivity differences between the amygdala and cortical structures. However, we did find a negative correlation between amygdala-parahippocampal connectivity and depression scores.
Volumetric analysis
Given that volumetric changes have previously been demonstrated in both major depression [52–54] and non-depressed PD [55–57], we performed volumetric analysis to see if changes in grey matter volume could explain the connectivity differences between groups. Our experiment did not show any volumetric changes between the non-depressed PD and antidepressant-treated depressed PD groups in regions with connectivity differences. Therefore, change in grey matter volume did not explain the connectivity differences seen in this cohort. In prior experiments of PD, volumetric differences have been noted in some of these tested regions, but have not been assessed for an association with depression. For example, reduced grey matter volume of the orbitofrontal cortex has been associated with visual hallucinations [56], impaired decision-making [57], and impaired recognition of emotions [57]; and the left insula has been associated with mild cognitive impairment [55]. There appears to be a paucity of volumetric data in relation to parkinsonian depression as correlations with depressive scores have not typically been reported. However in antidepressant-treated MDD, grey matter changes have been demonstrated in frontal structures, including the orbitofrontal cortex, and the hippocampus, as reviewed by Dusi and colleagues [58].
Limitations, future directions, and conclusions
Our work is an initial step in the understanding of antidepressant effects on parkinsonian depression, showing that insular-frontal opercular connectivity was both reduced in antidepressant-treated depressed PD and correlated with depression scores. Understanding the relationship between antidepressants and connectivity in PD is important as many patients are already on antidepressants at presentation, and the existing literature does not generalize to this population. The majority of existing literature either excludes patients on antidepressants or ignores antidepressant status. Still, the cohort design and lack of an antidepressant-naïve depressed PD group limit the interpretation of these findings. Because the antidepressant-treated depressed PD group differed from the non-depressed PD group in both antidepressant status and depression severity, these findings are limited. We cannot isolate the impact of each of these factors with the data available in the PPMI database. Future experiments comparing pre-treatment with post-treatment resting state scans to determine what findings may be attributable to 1) response to treatment, 2) antidepressant effect, and 3) persistent depressive symptoms would extend our findings.
CONFLICTS OF INTEREST
The authors have no conflicts of interest to report.
Footnotes
ACKNOWLEDGMENTS
Data used in the preparation of this article were obtained from the Parkinson’s Progression Markers Initiative (PPMI) database (www.ppmi-info.org/data). For up-to-date information on the study, visit ![]() .
.
PPMI –a public-private partnership –is funded by the Michael J. Fox Foundation for Parkinson’s Research and funding partners, including Abbvie, Avid Radiopharmaceuticals, Biogen, Bristol-Myers Squibb, Covance, GE Healthcare, Genentech –A Member of the Roche Group, GlaxoSmithKline, Lilly, Lundbeck, Merck, Meso Scale Discovery, Pfizer, Piramal, Roche, Sanofi Genzyme, Servier, Takeda, Teva, UCB, and Golub Capital.