
Abstract
Background:
Many optical coherence tomography (OCT) studies have reported alterations in the retinal nerve fiber layer (RNFL) in Parkinson’s disease (PD) and other neurodegenerative diseases. However, whether retinal alterations are a biomarker for PD is still controversial.
Objective:
To investigate potential correlations between PD and morphological changes in retina using OCT and to determine its usefulness as a biomarker of disease progression in PD.
Methods:
We performed a cross-sectional study on patients with PD (N = 37) and age-matched controls (N = 42), followed by a longitudinal study of the PD patients (N = 22) over approximately 2.5 years.
Results:
The average retinal nerve fiber layer (RNFL) thickness (p < 0.001), total macular thickness (p = 0.001), and macular volume (p = 0.001) were decreased in PD patients compared to controls and had further decreased at the follow-up visit (p < 0.05 for all). The average RNFL thickness and the total thickness of macular were negatively correlated with age in PD patients at baseline. Linear regression analysis revealed that age (p = 0.002, p = 0.003, respectively) and LEDD (p = 0.011, p = 0.013, respectively) were correlated to total thickness and volume of macular in 22 PD patients in the follow-up study. However, no correlation was found between RNFL and other parameters.
Conclusions:
PD progression is associated with pronounced retinal structure changes, which can be quantified by OCT. Patterns of RNFL and macular damage detected by the noninvasive technology of OCT can be a useful biomarker for evaluating the progression of PD.
INTRODUCTION
Parkinson’s disease (PD) is one of the most common age-dependent neurodegenerative disorders, and it is characterized by the loss of dopaminergic neurons in the substantia nigra. Although the hallmark of PD is impaired motor function, non-motor symptoms such as anxiety, depression, cognitive dysfunction, sleep disorders, and autonomic and gastrointestinal disturbances can also contribute to a decline in quality of life [1]. For example, visual dysfunction is a common cause of disability in PD [2], with clinical manifestations including photophobia, diplopia, altered visual acuity, dry eyes, visuospatial dysfunction, and complex visual hallucinations [3, 4].
Previous studies suggested that the retinal dopamine deficiency associated with PD may contribute to visual dysfunction and cause structural damage to the retina [5, 6]. Moreover, changes of the retinal structure in PD patients are associated with the severity and duration of the disease, even when patients are administered the prescribed dosage of levodopa, which is the most common treatment for PD [7, 8]. However, at present, there is no consensus as to the correlation between retinal structural changes and the pathophysiology of PD.
Optical coherence tomography (OCT) is a noninvasive technology that could potentially be used to investigate morphological changes of retinas in PD patients. Many OCT studies have reported significant reduction in the retinal nerve fiber layer (RNFL) [9–11] and macular thickness following the onset of PD [11]. Therefore, the objective of this study was to investigate the potential correlations between severity of PD and the thickness changes of RNFL and macular using OCT technology, and the usefulness of OCT as a biomarker of disease progression in PD.
MATERIALS AND METHODS
Our research includes two parts. In the first, we performed a cross-sectional evaluation of 37 patients with PD (for a total of 74 eyes examined) and 42 age- and sex-matched healthy subjects (for a total of 84 eyes examined) for comparison. The second part of the study was designed as a prospective longitudinal evaluation to assess retinal structural changes over approximately 2.5 years based on the initial evaluation. A total of 22 PD patients, all of whom were part of the initial cross-sectional cohort, were included in this second stage.
All of the study subjects were recruited consecutively from patients who were referred to the Department of Neurology at the Second Affiliated Hospital of Soochow University over an approximately 2.5-year period (June 2013 to May 2016). All patients with PD met the UK Parkinson’s Disease Society Brain Bank Clinical Diagnostic criteria. Subjects who were included as healthy controls (HC) had no history of neurological or ophthalmological diseases and received ophthalmological examinations as a routine check-up. The following exclusion criteria were used: a history of prior intraocular surgery, trauma, retinal pathology, or glaucoma, as well as severe transparent media opacification that prevented an ophthalmological examination. Additionally, patients with diabetes, severe cognitive impairment, advanced cataracts, and any systemic disorders that could potentially affect vision were excluded.
This study was approved by the Ethics Committee of the Second Affiliated Hospital of Soochow University, and informed consent was obtained from all participants or their caregivers.
Each patient underwent a detailed clinical interview and a complete neurological examination. Disease severity in PD patients was rated by the same trained neurologist during the initial visit (baseline), using the Unified Parkinson’s Disease Rating Scale (UPDRS) and the Hoehn and Yahr (H&Y) scale during the medication “on” state. Patient information regarding disease duration, sex, current medications, and dosages of anti-parkinsonian drugs, such as the levodopa equivalent daily dose (LEDD), were also collected. PD patients who agreed to participate were enrolled in the follow-up visit for the study, at which point the same clinical information was collected again.
All subjects underwent a fundamental ophthalmologic examination that included an assessment of visual acuity, Goldmann applanation intraocular pressure measurements, and a slit lamp biomicroscopy examination of the fundus. Measures of RNFL, and macular thickness and volume were detected using a high-definition OCT (HD-OCT) device (Carl Zeiss Meditec, Inc., Dublin, CA) following pupillary dilation. The RNFL was measured in each eye with the “Optic Disc Cube 200×200” scan, which consistssed of a 6 mm 2 square-based spatial cube surrounding the optic disc and it performed 200×200 A-scans in approximately 1.5 seconds. This instrument uses intrinsic algorithms to delineate the boundaries of the RNFL automatically and to calculate the RNFL thickness throughout the data cube. It then extracts measurements from a peripapillary ring with a diameter of 3.4 mm around the center location. Macular measurements were performed using the “Macular Cube 512×128” scan, which obtains a 6 mm 2 square-based cube around the fovea centralis. The macular volume is defined as the volume between the inner limiting membrane and the inner boundary of the retinal pigment epithelium, within a 6-mm-diameter circle around the fovea. The OCT measurements were performed by a single experienced examiner.
Data analysis
The statistical package SPSS 19.0 and GraphPad Prism 5.0 software were used to perform the statistical analyses. Values were presented as the mean±standard deviation or median (interquartile range). Differences between PD patients and HC were analyzed using Pearson’s×2 test for sex. Independent two-sample Student’s t tests for parametric values were used to determine whether the RNFL thicknesses and macular volumes differed between the eyes of PD patients and HC. A paired-samples t test was used to compare RNFL data, macular data, PD drug, and severity of the 22 PD patients before and after the follow-up. Spearman’s correlation coefficients were used to assess whether any relationship existed between retinal structure and age in control subjects. The relationship between PD-related parameters and OCT test including baseline and follow-up results was also investigated by linear regression analysis. The statistical analyses were performed at a 95% confidence level and the reported p values are from two-tailed tests. A p value of less than 0.05 was considered statistically significant.
RESULTS
Subjects’ characteristics at baseline
Basic group clinical demographic and ophthalmologic characteristics are summarized in Table 1. Overall, average RNFL thickness was significantly reduced in PD patients compared to controls (p < 0.001, Fig. 1A). Furthermore, the RNFL thicknesses in the superior and inferior quadrants were significantly reduced in PD patients compared to HC (p = 0.029, p = 0.001, respectively; Fig. 1B, C). Conversely, the RNFL thicknesses in the nasal and temporal quadrants did not significantly differ between PD patients and controls (Fig. 1D, E). Additionally, we found that the total macular thickness was significantly reduced in PD patients compared to controls (p = 0.001). Macular thickness in the central fovea was not significantly different between the two groups. Macular volume was also significantly reduced in PD patients compared to HC (p = 0.001). The average (p = 0.004) and superior quadrants (p = 0.023) RNFL were found a negative correlation with age in 42 healthy subjects (Table 2). Similarly, we found that age was also associated with average RNFL (p = 0.045) and macular thickness (p = 0.016) in 37 PD patients, regardless of other factors in baseline study (Table 3). The comparison of visual field between PD patients and controls revealed no significant difference in our study (p = 0.061).
Clinical and demographic characteristics of PD patients and healthy controls at baseline
Values are expressed as means±standard deviation or median (interquartile range). Statistical tests: *Pearson’s χ2 test; others were two-sample Student’s t Tests. A statistically significant correlation is P < 0.05. Abbreviations: N/A, not applicable; PD, Parkinson’s disease; HC, healthy controls; UPDRS, Unified Parkinson’s Disease Rating Scale; H&Y stage, Hoehn-Yahr stage; LEDD, daily levodopa equivalent dose; RNFL, retinal nerve fiber layer.
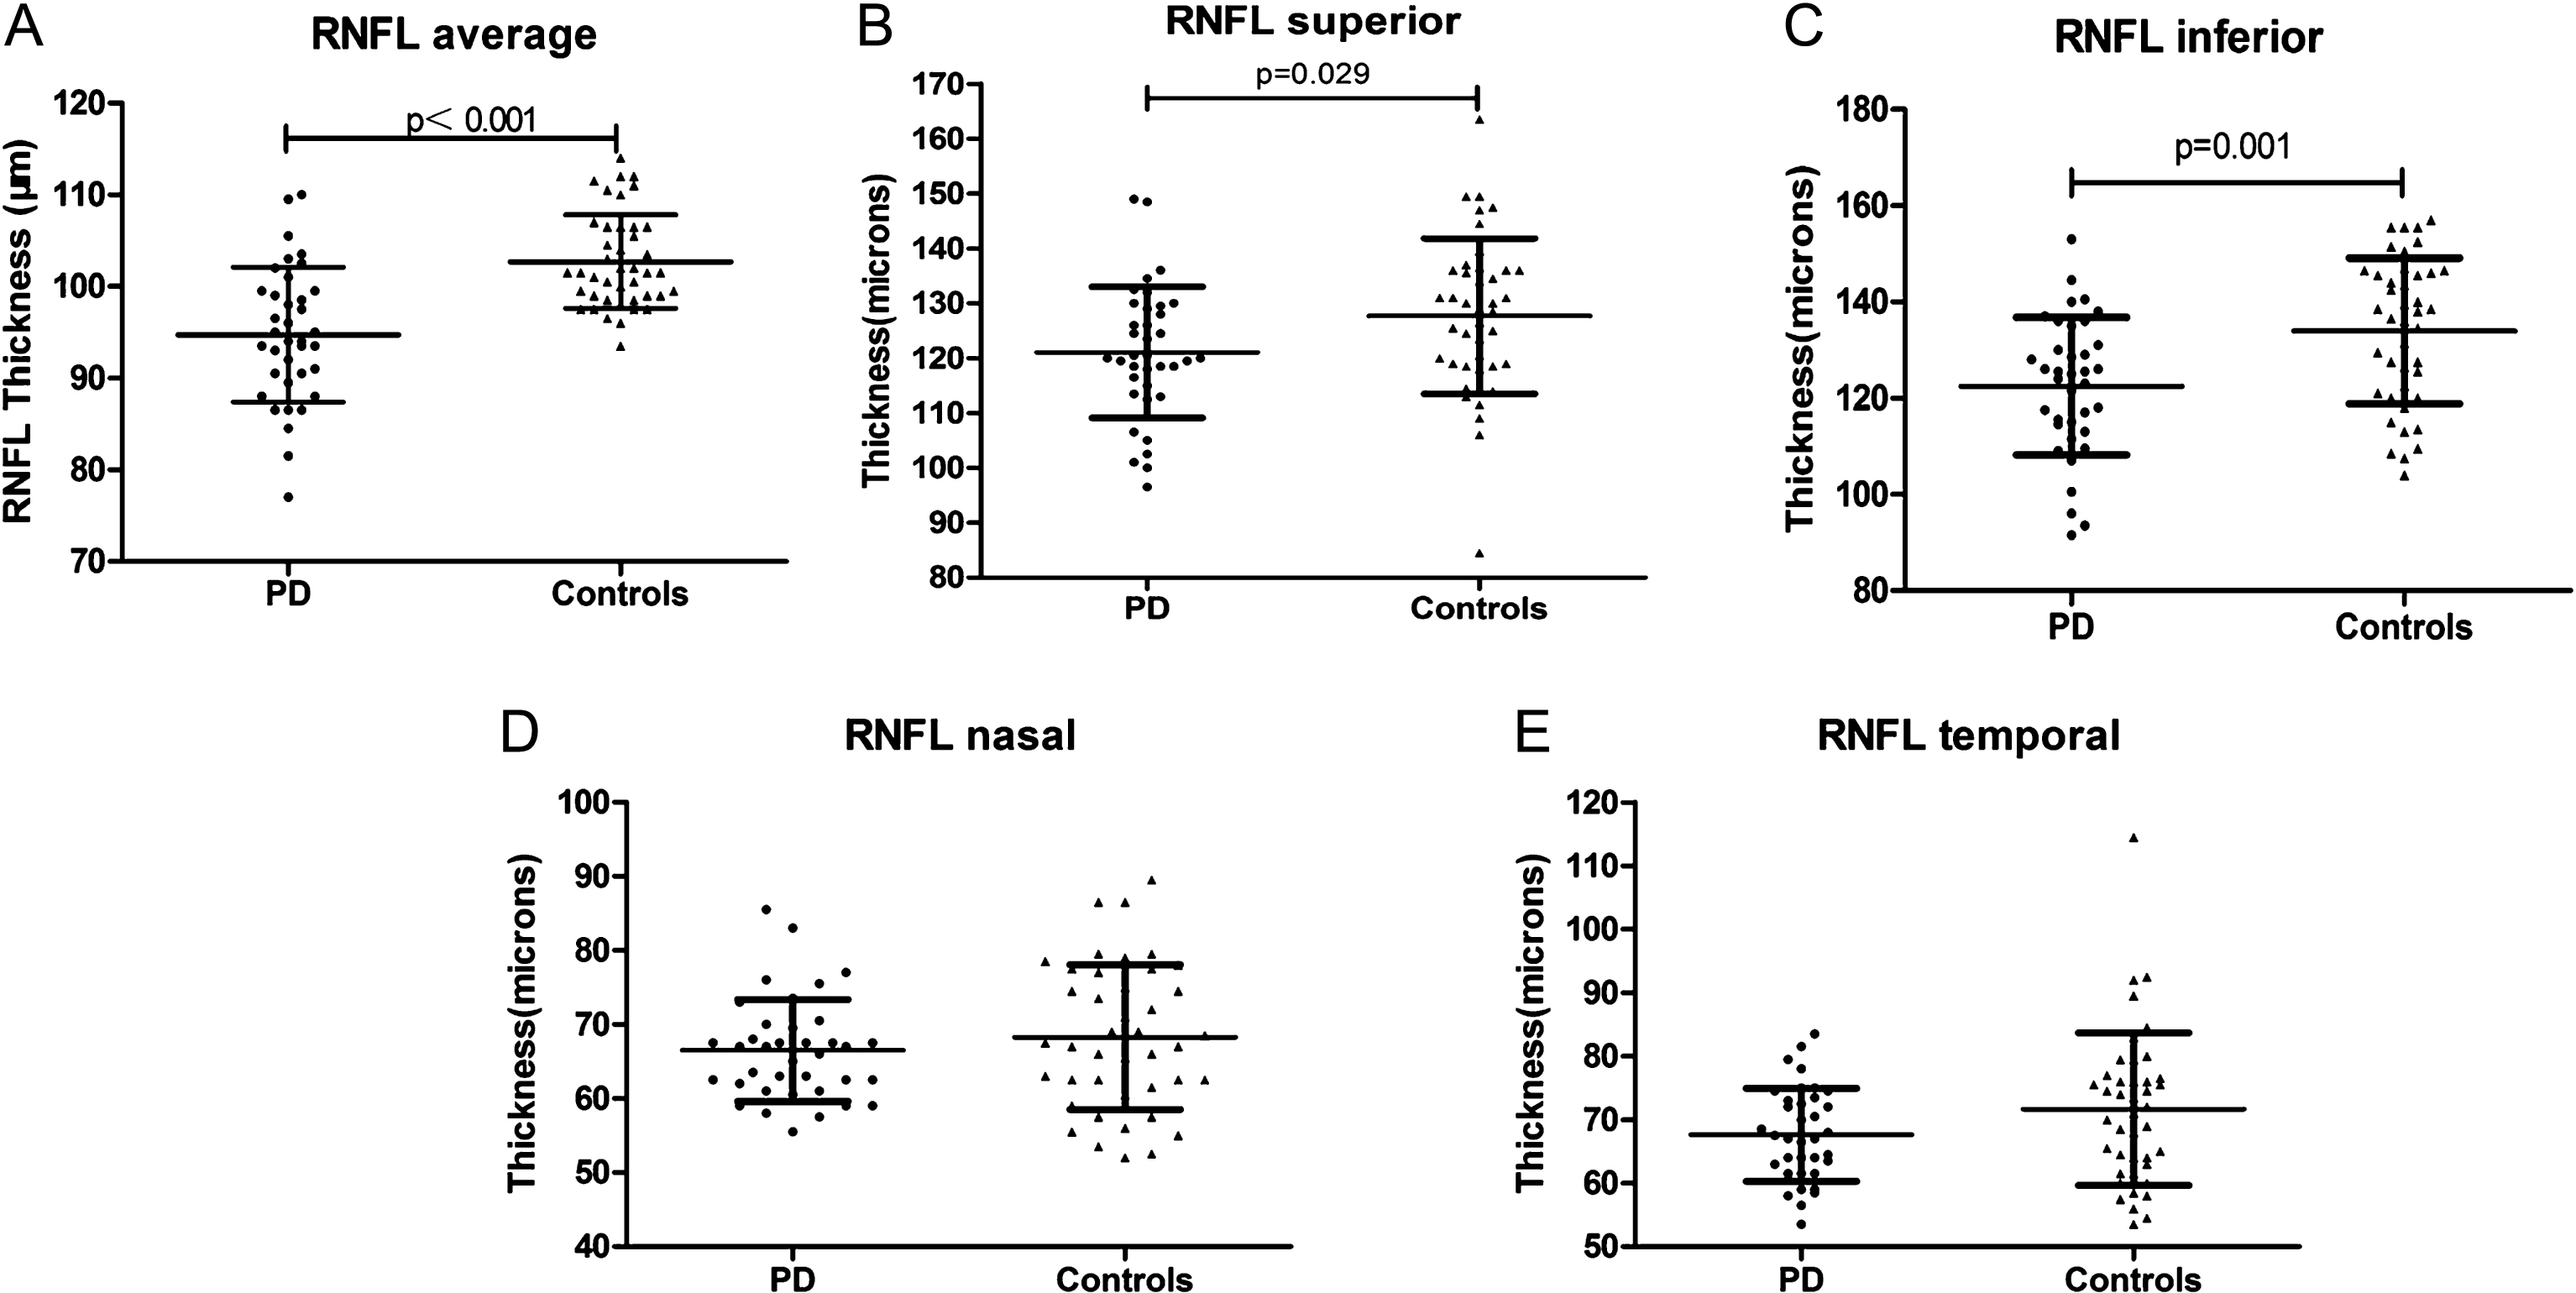
Scatter plots showing the retinal nerve fiber layer (RNFL) thicknesses of 37 Parkinson’s disease (PD) patients and 42 healthy controls. PD patients exhibited a significant reduction in the average RNFL thickness when compared to controls (A). Patients with PD showed significant reductions in the superior and inferior RNFL quadrants (B and C). No significant difference was observed in the nasal and temporal RNFL quadrants (D and E). A statistically significant correlation is p < 0.05.
Spearman’s correlation analysis with the age in 42 control subjects
Spearman’s correlation analysis. Significance is p < 0.05. Abbreviations: r, correlation coefficient; RNFL, retinal nerve fiber layer.
Linear regression analysis between average RNFL and total thickness of macular and variables in 37 PD patients at baseline
Adjusted for age, sex, disease duration, LEDD, H&Y stage, UPDRS III and UPDRS total scores. Abbreviations: PD, Parkinson’s disease; RNFL, retinal nerve fiber layer; LEDD, daily levodopa equivalent dose; H&Ystage, Hoehn-Yahr stage; UPDRS III, third part of Unified Parkinson’s Disease Rating Scale score; UPDRS total, total Unified Parkinson’s Disease Rating Scale score.
Subjects’ characteristics after the follow-up visit
All PD patients who were assessed at baseline were contacted to come back for a follow-up visit approximately 2.5 years after their initial visit (average interval between baseline and follow-up visits: 2.49±0.29 years; range: 1.83–3.08 years). Of the initial 37 PD patients, two were diagnosed with multiple system atrophy, three could no longer provide for themselves due to a traffic accident or cerebral infarction, two could not be enrolled in the study because of intraocular surgery, four could not be reached, and four opted not to participate in a follow-up visit. As a result, 22 PD patients were included in the second stage of our study.
Linear regression analysis revealed that age (p = 0.002, p = 0.003, respectively) and LEDD (p = 0.011, p = 0.013, respectively) were correlated to total thickness and volume of macular in 22 PD patients in the follow-up study. However, no correlation was found between RNFL and other parameters (Table 4).
Linear regression analysis between total thickness and volume of macular and variables in 22 PD patients at follow up
Adjusted for age, sex, disease duration, LEDD, H&Y stage, UPDRS III and UPDRS total scores. Abbreviations: PD, Parkinson’s disease; LEDD, daily levodopa equivalent dose; H&Ystage, Hoehn-Yahr stage; UPDRS III, third part of Unified Parkinson’s Disease Rating Scale score; UPDRS total, total Unified Parkinson’s Disease Rating Scale score.
Using paired-sample statistical tests, we found that the LEDD was significantly increased at the time of the follow-up visit compared to baseline (p = 0.001). However, neither the H&Y stage nor the UPDRS score were significantly different between the two time points. Importantly, all included measurements of RNFL thickness (the average as well as for all four quadrants) showed a statistically significant reduction at the time of the second visit compared to baseline. Similarly, both macular volume and total macular thickness were decreased at the follow-up visit compared to baseline. While the central fovea thickness trended towards a similar decrease, with no statistically significant difference between the two time points (Table 5).
Comparison of the Clinical Characteristics and OCT Measurements of 22 PD Patients between Baseline and Follow-up Visits
Statistical tests: Paired-samples t tests. A statistically significant correlation is p < 0.05. Abbreviations: OCT, Optical coherence tomography; PD, Parkinson’s disease; UPDRS, Unified Parkinson’s Disease Rating Scale; H&Y stage, Hoehn-Yahr stage; LEDD, daily levodopa equivalent dose; RNFL, retinal nerve fiber layer.
DISCUSSION
Here, we investigated the relationship between PD and the morphology of the retina, using OCT. In the first part of our study, we compared the PD and HC groups and revealed a smaller macular volume, reduced total macular thicknesses, and RNFL thinning (average as well as in the superior and inferior quadrants) in patients with PD. Average RNFL thickness and total thickness of macular were negatively correlated with age in PD patients at baseline. Total thickness and volume of macular were correlated to age and LEDD in PD patients in the 2.5-year follow-up period. To our knowledge, RNFL thinning in PD was first demonstrated in 2004 [9], and additional investigations have confirmed this finding, although with varying results [7, 12–16]. What’s more, OCT has been used previously to document PD-related alterations in retinal measurements [7, 17–19]. Specifically, some studies have reported a significantly lower mean total macular volume in PD patients compared to controls [7, 20], similar to our results. However, other studies have found macular volume to be greater in PD patients than in controls [17]. There are a number of possible explanations for these differential findings, including differences in patient compliance, patient selection, potentially limited sample sizes, specific parameters of the respective apparatuses, or experimental error [21]. Future studies using multi-center populations and larger sample sizes will help clarify the accuracy of these results.
In the second part of our study, we measured changes in the retinal structure of PD patients after approximately 2.5 years. This is the first follow-up study to investigate the usefulness of these measurements as an imaging biomarker of PD progression. At the follow-up visit, LEDD and age were associated with total thickness and volume of macular, while other factors, such as disease severity, didn’t show any association with the abnormality of the retinal structure. In the follow-up study, we found that LEDD was markedly increased; however, there were no significant differences in either H&Y stage or UPDRS scores. This may suggest that the motor symptoms did not increase because they were satisfactorily controlled by the increase in LEDD despite a progression in the underlying disease. In another word, we speculate that correlation between total thickness and volume of macular and disease progression may be found if the motor function was evaluated during medication “off” state. Importantly, all of the included measurements of RNFL showed a significantly reduced thickness at follow-up when compared with baseline. Macular volume and total thickness were also significantly reduced at follow-up. These results were, at least in part, in agreement with recent reports [7–9, 22–25].
At present, there is still no systematic understanding of the mechanism and performance of visual impairment in PD. Previous evidence has demonstrated that retinal dopamine deficiency may play a central role in the pathogenesis of visual dysfunction in PD, as well as contributing to visual processing by modulating the (centre-surround) organization of the receptive field of ganglion cells [21]. Dopamine is released by a unique set of amacrine cells in the human retina [5, 12], which are responsible for the transmission of visual information. Moreover, the loss of dopaminergic neurons affects both the structure of the retina and visual functioning; it is a compelling hypothesis that RNFL thinning is related to an apathophysiological explanation [26].
Some studies have shown age-associated changes in the patterns of the RNFL and macular thicknesses [27–29], and aging has been correlated with a loss of neurons in the inner retina [30, 31]. In our study, we also found that age was associated with average RNFL and macular thickness. In the following study, age was still found to be associated with total thickness and volume of macular. These results were consistent with previous studies. Similarly, histologic studies indicated an age-related loss in the retina of 0.3% to 0.6% annually, whereas the thickness of the RNFL decreases at a lower rate of 0.2% per year [32, 33]. However, in our study, the decline rate of the RNFL in PD patients was far greater than that of normal people’s annual decline. Therefore, we speculate the thickness changes of retinal structure would be very tiny in healthy control group in the second stage because of the short follow up period. It further supports that the retinal structure changes mainly resulted from PD itself.
Limitations
First, subjects of our study were only from the Second Affiliated Hospital of Soochow University, so the study findings may be limited from a single center. Secondly, samples of the study in PD patients and controls were relatively small. Thirdly, we did not follow up the retinal structure changes in control subjects. Moreover, not all the PD patients were followed up at the same time point.
In conclusion, PD patients exhibited progressive reduction in the RNFL, total macular thicknesses, as well as in macular volume. These alterations could be quantified using noninvasive OCT technology. Specific patterns of RNFL and macular damage could be useful biomarkers for evaluating the progression of PD. Further studies with large samples in multi-centers during the medication “off” state are needed.
CONFLICTS OF INTEREST
The authors have no conflict of interest to report.
Footnotes
ACKNOWLEDGMENTS
The authors extend a particular thanks to the patients and their families, and to healthy volunteers for their participation in this study and continued support to our research. This work was supported by National Key R&D Program of China (2017YFC0909100); National Natural Science Foundation of China (91649114); Jiangsu Key Laboratory of Neuropsychiatric Diseases (BM2013003); Jiangsu Provincial Medical Key Discipline Project (ZDXKB2016022); Jiangsu Provincial social development projects (BE2017653) and Suzhou Clinical Research Center of Neurological Disease (Szzx201503). This was also partly supported by the Priority Academic Program Development of Jiangsu Higher Education Institutions (PAPD).