
Abstract
Background:
With recent advances in the search for disease-modifying therapies for Parkinson’s disease (PD) the importance of identifying prodromal markers becomes greater. Non-manifesting LRRK2 mutation carriers (NMC) are at risk for developing PD, and provide a population in which to identify possible markers.
Objective:
The aim of this study was to test the hypothesis that NMC have differences in daily activity, fragmentation of sleep, arm swing asymmetry, and movement variability during walking, detectable by actigraphy, as compared to matched control subjects.
Methods:
Eleven NMC, fourteen PD patients (4 LRRK2-PD, 10 idiopathic PD (iPD)), and twenty-nine controls wore wristbands containing an accelerometer for seven days, and performed a daily walking task. Outcome measures included daily activity, fragmentation of activity, fragmentation of sleep, arm swing asymmetry during walking, and intra-individual variability.
Results:
Compared to healthy controls, both NMC and LRRK2/iPD showed higher intra-individual variability in activity during walking compared to healthy controls. Individuals with LRRK2-PD/iPD, but not NMC, tend to have lower activity levels, more arm swing asymmetry and less increase of arm swing with transition from slow to faster walking speed compared to healthy controls.
Conclusion:
Higher intra-individual variability of gait-associated movements might be a useful biomarker of prodromal PD. These results encourage replication in a larger sample and longitudinal analysis is warranted.
INTRODUCTION
Parkinson’s disease (PD) is characterized by a long prodromal phase [1]. Disease-modifying therapies will be most effective if implemented early in the disease course. Therefore, the development of objective markers that identify individuals with prodromal PD prior to manifesting clinically significant motor symptoms is critical.
Changes in daily physical activity can be detected in early PD, before any visible gait disturbances are present [2–5]. Individuals with a higher risk for PD (high risk PD) show altered gait variability [6], subtle signs of balance deficit [7], and have a higher motor score on the Unified Parkinson’s Disease Rating Scale (UPDRS) compared to controls [8]. Non-motor symptoms including sleep disorders such as insomnia, excessive daytime sleepiness, and REM-sleep behavior disorder (RBD) are common in PD. People with a higher risk for developing PD tend to have more non-motor symptoms [9] and reduced nocturnal sleep [8, 10] compared to healthy controls.
Mutations in the LRRK2 gene are responsible for approximately 1%–2% of sporadic and 4% of familial PD in most European populations studied, with a phenotype largely overlapping with idiopathic PD (iPD) [11]. LRRK2 mutations have incomplete, age-dependent penetrance [12–14]. Therefore, non-manifesting carriers (NMC) of LRRK2 mutations represent an opportune high risk PD population in which to study prodromal PD. Importantly, non-motor features such as RBD and olfactory dysfunction appear to be less common in LRRK2-PD than in iPD [15], therefore other prodromal markers need to be explored in this population.
Actigraphy is a non-invasive method to measure activity in an everyday environment. It has been used to characterize different aspects of movement in PD, including total activity and asymmetry, but has not been evaluated in high risk PD. In this study, we hypothesized that LRRK2 mutation carriers, a population at high risk of developing PD, would have differences in daily activity, fragmentation of sleep, arm swing asymmetry, and movement variability during walking as compared to matched controls, and that these differences would be quantifiable using actigraphy.
METHODS
Subjects
Probands with a LRRK2 G2019S mutation and their blood relatives, individuals with iPD and healthy unrelated controls were recruited through our Toronto Western Hospital Movement Disorders Centre for a study of the clinical features and biomarkers of LRRK2-PD [11]. Informed consent was obtained from all participants.
Procedures
All participants wore actigraphs on both wrists continuously for 1 week (Actiwatch Spectrum, Philips-Respironics, Bend, OR). The Actiwatch Spectrum is based on an internal cantilevered piezoelectric bilayer attached to an inertial mass and measures changes in acceleration primarily in an axis perpendicular to the face of the device. The signal is filtered with a pass-band between 0.5 and 7.0 Hz. The peak signal in each 1-s period is determined, summed across 15 s (= 1 epoch) and rounded to the nearest integer to create an integrated ‘count’ for each 15-s epoch. If the number of counts in the epoch was 0 the epoch was classified as resting (R) and if the number of counts in the epoch was greater than 0 the epoch was classified as active (A).
Participants were to continue their normal activities in addition to performing a daily walking task. The daily walking task consisted of two parts in which they were asked to a) walk in a straight line at a comfortable pace for 2 min (slow walk) and b) walk as quickly as possible (without running) for 1 min (fast walk). Participants who were not able to complete the walking task were excluded for this analysis. Participants were asked to press a marker button on the side of the Actiwatch to mark when the walks occurred. They reported daily bed and wake up times, nap times, working days, and injuries/pain which could potentially affect the data. All participants underwent a medical examination including the Movement Disorders Society Unified PD Rating Scale part III (MDS-UPDRSIII), Hoehn and Yahr stage (H&Y-stage), REM-sleep behavior disorder screening questionnaire (RBDSQ), Tremor Rating Scale (TRS), Geriatric Depression Scale (GDS), Levodopa Equivalent Dose (LED) in mg/day [16], and MDS-UPDRS tremor scores (sum of items 13, 14 and 15 calculated for each hand) were calculated. In the NMC group, the likelihood of prodromal disease being present was determined [17].
Data analysis
Activity during walking
To eliminate starting/ending transitions during the walking task, the epochs directly following the start and finish of each task were excluded. The median number of counts per epoch during slow and fast walk were used for analysis. A fast/slow walk ratio was calculated by dividing the median counts from the fast walk by the median counts from the slow walk for each individual.
An asymmetry ratio (AR) was calculated by dividing the median number of counts from the dominant hand by the median number of counts from the non-dominant hand. The asymmetry magnitude was defined as |1-AR|.
Daily activity
Only ‘active state’ data as determined by the Actiwatch were used (counts >0). The 90th percentile of activity counts in the entire cohort was determined. The proportion of the day that each individual spent within the top 10% of activity counts, as measured by the dominant, non-dominant and the average of both hands, was calculated. AR was calculated as the ratio of the dominant to non-dominant hand values. The magnitude of asymmetry was then calculated as |1-AR|.
Fragmentation of activity and sleep
Fragmentation of activity (kAR) and sleep (kRA) was measured as previously described [18]. kAR represents the probability that an individual would transition from being in the active state to being in the resting state. Therefore, kAR represents the tendency to fragment sustained activity. kRA is the transition probability from resting state into active state. High kRA corresponds with more fragmented sleep.
Statistical analysis
Between group comparisons of clinical and demographic characteristics were performed using independent t-tests for normally distributed continuous data, Mann-Whitney U test for not normally distributed continuous data and Fisher’s Exact test for categorical data. Actigraphy measures that were not normally distributed were log-transformed as appropriate (kRA and Fast/Slow walk ratio). Linear regression was used to compare the measures between groups. If patient characteristics were significant at the 5% level in univariate analysis, they were included in multivariable analysis. Statistical analyses were performed using R and SPSS version 23. P-values < 0.05 were considered significant.
The variability in the walking task was broken down to three components: 1) within-subject, within-day, between-epoch variability, SD2epoch; 2) within-subject, between-day variability, SD2day; 3) between-subject variability, SD2subj. To explore how these components of variability differed between the three patient groups, a sequence of five models was fitted and a measure of model fit was used (the deviance information criterion, DIC) to identify which model fit best. The DIC combines a smaller deviance (a better fit to the data) and a penalty for a larger model, so a smaller value of the DIC indicates a preferred model. The five models varied in their assumptions about equality or differences of the three SDs across patient groups and are presented in decreasing order of flexibility in their assumptions: Model 1) all three SDs were different across the three patient groups; Model 2) SDday was equal across groups, but SDsubj and SDepoch were different; Model 3) SDday was equal across groups, SDsubj differed across groups, and SDepoch was different in controls and the combined LRRK2/iPD/NMC groups; Model 4) Only SDepoch differed across groups; and Model 5) all SDs were equal across the three groups. These models were fit using Bayesian methods in JAGS 4.2.0 [19] with uninformative priors on all parameters. For each SD (between-subject, between-day and between-epoch), the ratio of the values in the LRRK2/iPD group and the NMC group were calculated to the value in the control group (in the models where they are allowed to be different). For each of these ratios, the Bayesian posterior probability was computed that each ratio was larger than 1, an indication that in the comparison group there was greater variability compared to the control group. Additional exploratory analyses were carried out to verify that the results from these models could be seen with the raw data; these analyses and their results are detailed in the Supplementary Material.
RESULTS
Subject characteristics
Fourteen LRRK2/iPD patients (4 LRRK2-PD and 10 iPD), eleven NMC, and twenty-nine controls (14 relatives without LRRK2 mutations and 15 unrelated controls) participated in actigraphy data collection. Data was missing in nine individuals due to an error in retrieving the data from the watch, not being able to complete the walking task, or not identifying the timing of the walking task. One individual from the NMC group showed outlying observations for daily activity. Given that the data of this outlier was highly implausible, this participant was removed from further analysis. The total number of individuals included in analysis of daily activity and fragmentation of sleep was fourteen in the LRRK2/iPD group, ten NMC, and twenty-six controls. The total number included in analysis of the walking task was thirteen in the LRRK2/iPD group, ten NMC, and twenty-two controls.
Given the small sample size of manifesting LRRK2 patients, individuals with a manifesting LRRK2 mutation and idiopathic PD were combined into a single group. This was justified by the lack of a significant difference in asymmetry scores between the 14 LRRK2-PD patients and 20 iPD patients in the entire biomarker study cohort (median asymmetry score iPD – 0.35, LRRK2 PD – 0.02, p = 0.263, Mann Whitney U test). The LRRK2 patients in the LRRK2/iPD group were older, had higher UPDRSIII and tremor scores, and lower S&E compared to the control group (Table 1). NMC had similar baseline characteristics compared to controls. Two NMC were defined as likely in a prodromal state.
Subject characteristics. Values are median (range) unless otherwise stated. MDS-UPDRS, Movement Disorder Society Unified Parkinson Disease Rating Scale; Tremor-total, Total score on Tremor Rating Scale; S&E, Modified Swab & England score; GDS, Score on Geriatric Depression Scale; REM-total, Total score on REM-sleep behavior disorder questionnaire; Affecting MH, number of individuals with a medical history potentially affecting the Actigraphy data; Affecting Med, number of individuals with medication (other than for PD) potentially affecting the Actigraphy data; H&Y stage, Hoehn and Yahr stage; LED, Levodopa equivalent dose [16]
N/a, Not applicable. 1P-value based on independent student T-test. 2P-value based on Fishers exact test. 3P-value based on independent samples Man-Whitney U test. 4LRRK2/iPD: One individual with restless leg syndrome. Controls: One individual with restless leg syndrome and one individual with hemisensory loss and loss of dexterity.
Activity during walking
The model examining variability during the walking task that specifies all three epoch SDs different across groups had the lowest DIC (9631) so results are presented for that model. For the dominant hand, the between-subject standard deviation (SDsubj) was larger in the LRRK2/iPD group (with 99.8% probability) and in the NMC group (with 89.4% probability) than in the control group. The between-day SD (SDday) was larger in the LRRK2/iPD group than in controls (with probability 100%) but not in the NMC (probability 47,6%). Compared to the control group, the between-epoch SD (SDepoch) was larger in both the LRRK2/iPD group (100% probability) and the NMC (100% probability). Figure 1 is a graphic display of the posterior distributions of the standard deviations in each group (SDsubj, SDday and SDepoch). For exact values of SD, the ratios of SDs to the control SDs and the probabilities that the SDs were larger than the control group SDs (Table 4).
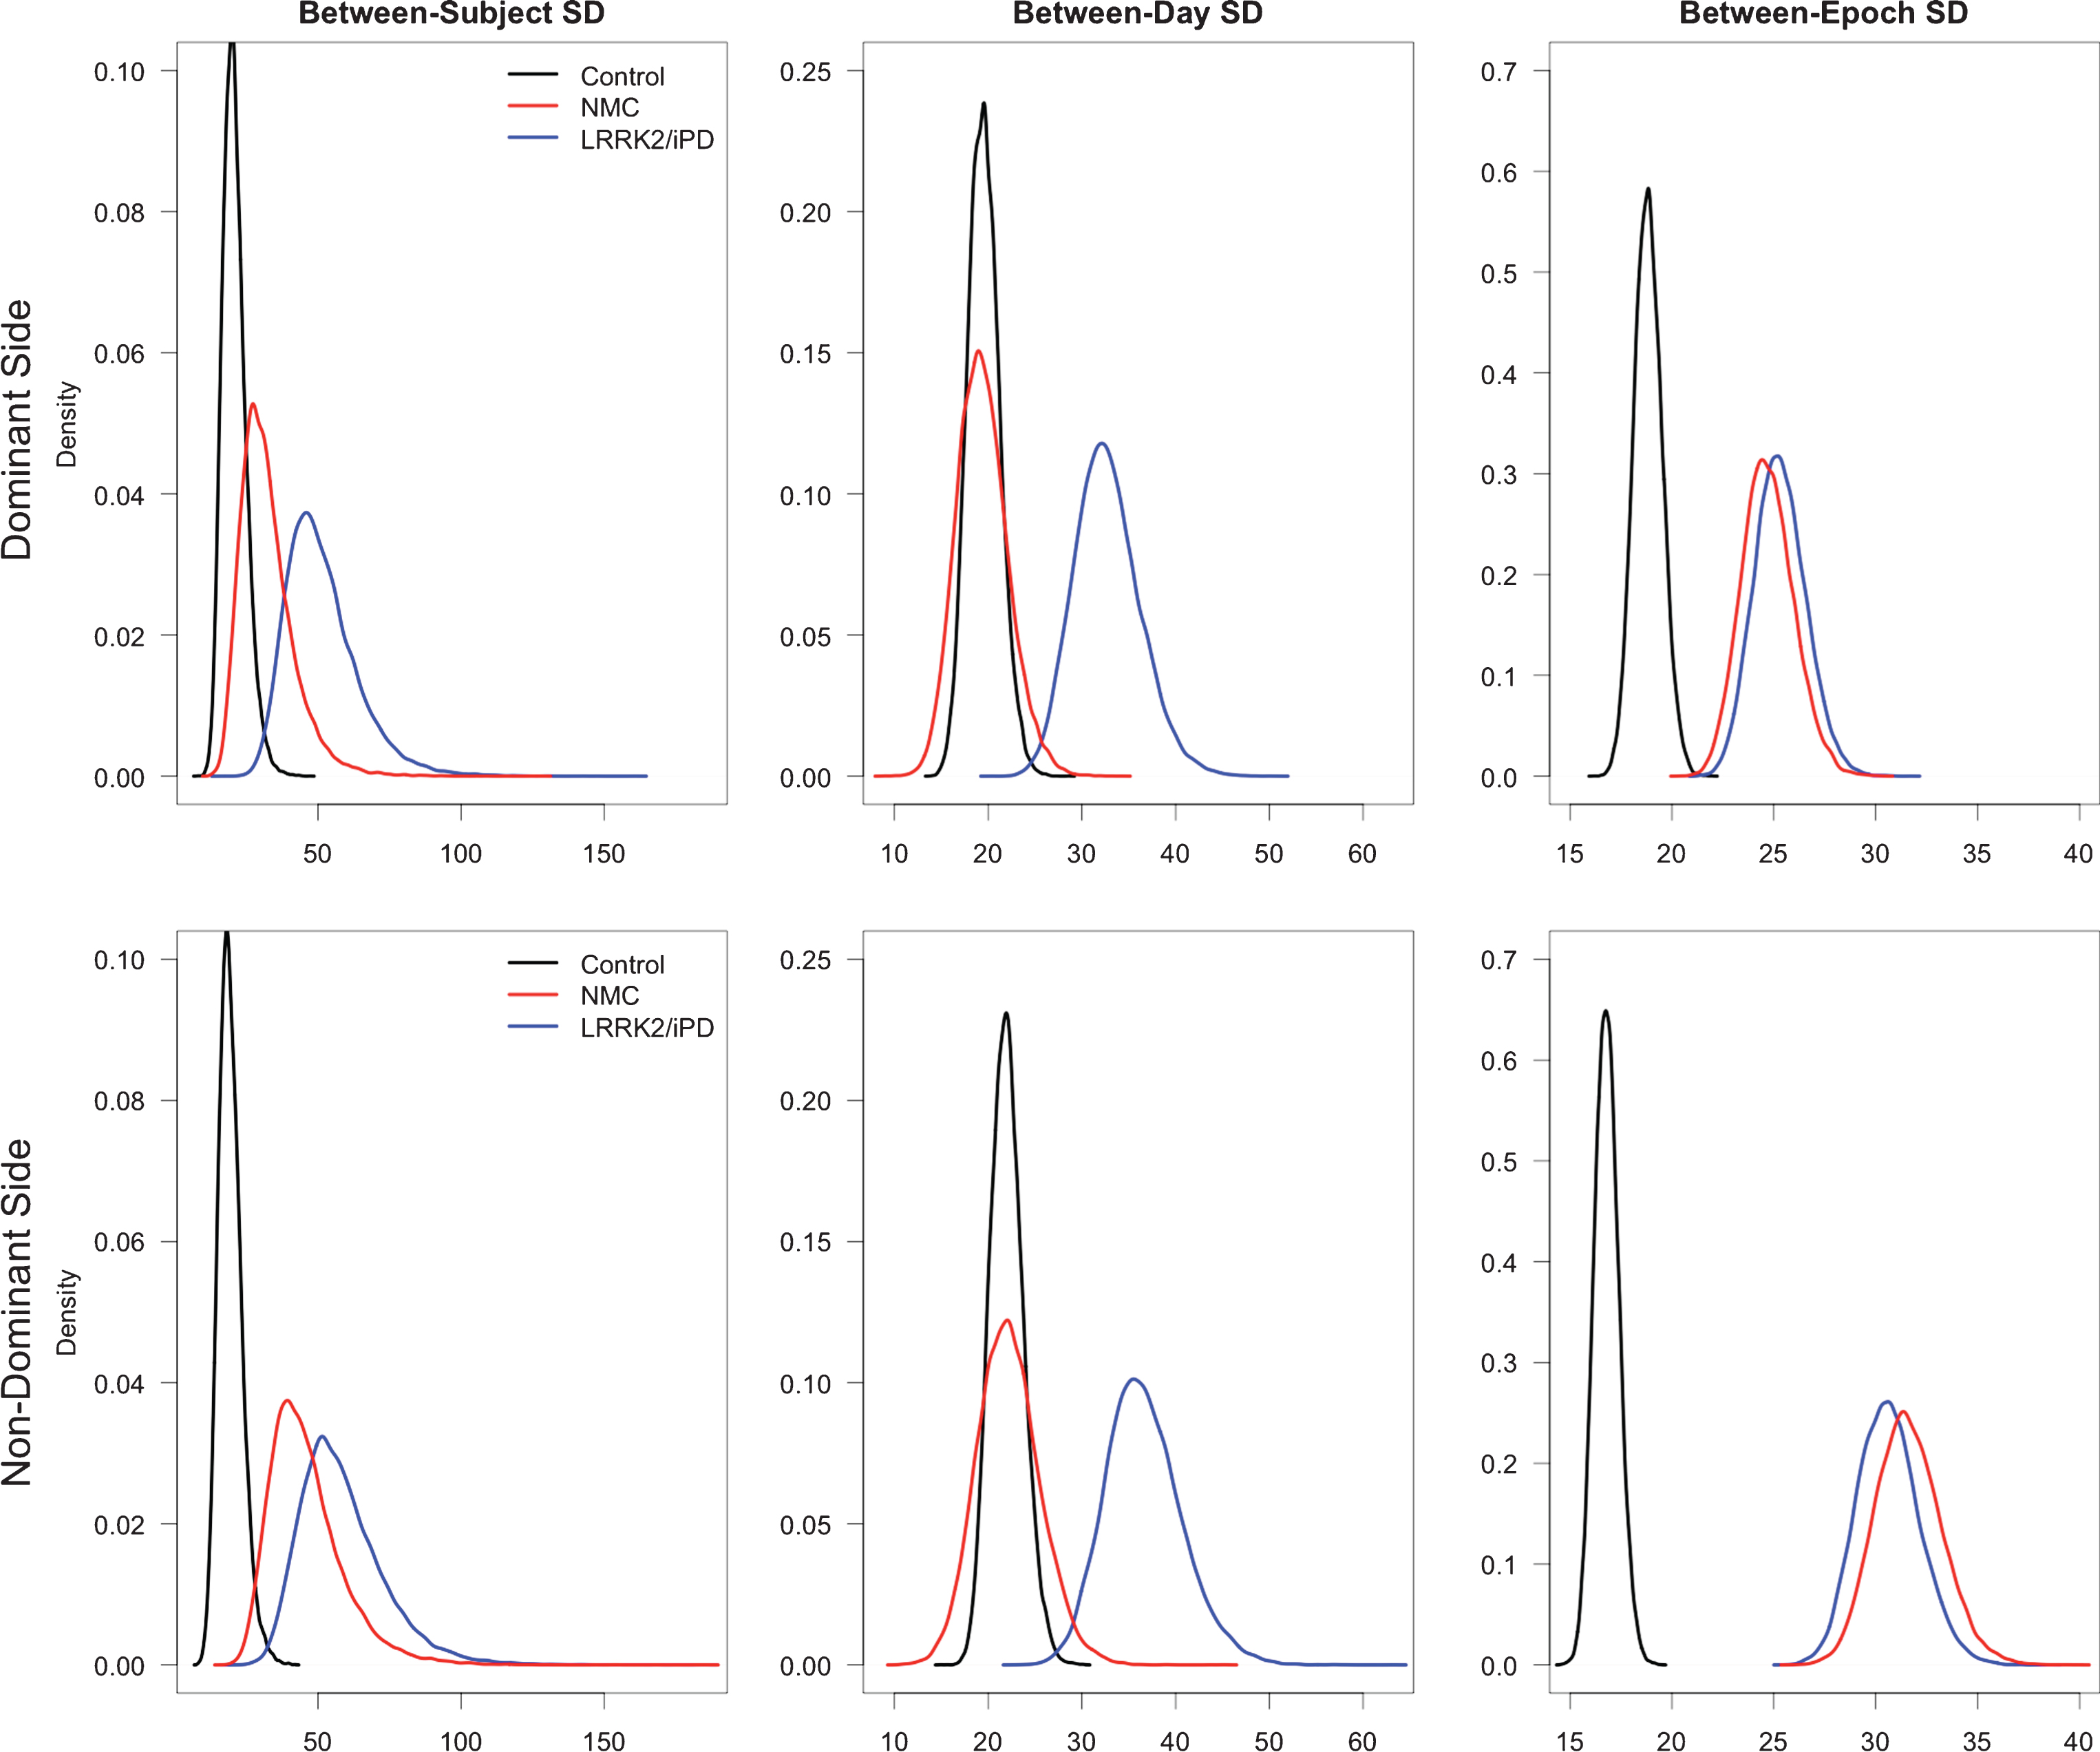
Graphic display of the posterior distributions of the standard deviations in each group for three variances (between-subject, between-day, and between-epoch) for both the dominant side and the non-dominant side, during walking.
Not surprisingly, the magnitude of asymmetry during walking was larger in the LRRK2/iPD group compared to the control group in univariate analysis, and was most pronounced during fast walking (Table 2). When comparing the proportional increase in activity counts from the slow walk to the fast walk, there was a significantly higher increase in the control group compared to the LRRK2/iPD group (Table 2). There was no association with baseline characteristics. The NMC were similar to the control group in both symmetry and the activity increase from slow to fast walking. Interestingly, both NMC who were predicted to be in a prodromal state had a smaller increase in activity from slow to fast walking compared to the group mean. Furthermore, one of these individuals had more asymmetry during fast walking (Fig. 2 and Table 3). No statistics were performed using this small presumed prodromal subset because of the small sample size.
Results of daily activity, fragmentation of activity, fragmentation of sleep and activity during walking. Values are mean (standard deviation). NMC, Non manifesting LRRK2 carriers; PropTop10 – Avg, Average proportion of the day spent in top10% activity range; PropTop10 – D, Proportion of the day spent in top10% activity range for dominant hand; PropTop10 – ND, Proportion of the day spent in top10% activity range for non-dominant hand; PropTop10 – Asymm, Asymmetry ratio for proportion of the day spent in the top10% activity range; kAR – Avg, Average probability for fragmentation of activity; kAR-D, Probability for fragmentation of activity for dominant hand; kAR-ND, Probability for fragmentation of activity for dominant hand; kRA – Avg, Average probability for fragmentation of sleep; kRA-D, Probability for fragmentation of sleep for dominant hand; kRA-ND, Probability for fragmentation of sleep for dominant hand; Slow–Asymm, asymmetry ratio during slow walk; Fast–Asymm, asymmetry ratio during fast walk; Fast/Slow: Fast/slow ratio
1Linear regression analysis and log-transformed when appropriate, unless otherwise stated. 2Linear regression, adjusting for age.
Individual results of two prodromal non-manifesting LRRK2 carriers (NMC) together with the mean results in the NMC group
PropTop10-D, Proportion of the day spent in top10% activity range for dominant hand; PropTop10-ND, Proportion of the day spent in top10% activity range for non-dominant hand; PropTop10 – asymm, Asymmetry ratio for proportion of the day spent in the top10% activity range; kAR-D, Probability for fragmentation of activity for dominant hand; kAR-ND, Probability for fragmentation of activity for dominant hand; kRA-D, Probability for fragmentation of sleep for dominant hand; kRA-ND, Probability for fragmentation of sleep for dominant hand; Slow–Asymm, asymmetry ratio during slow walk; Fast–Asymm, asymmetry ratio during fast walk; Fast/Slow, Fast/slow ratio.
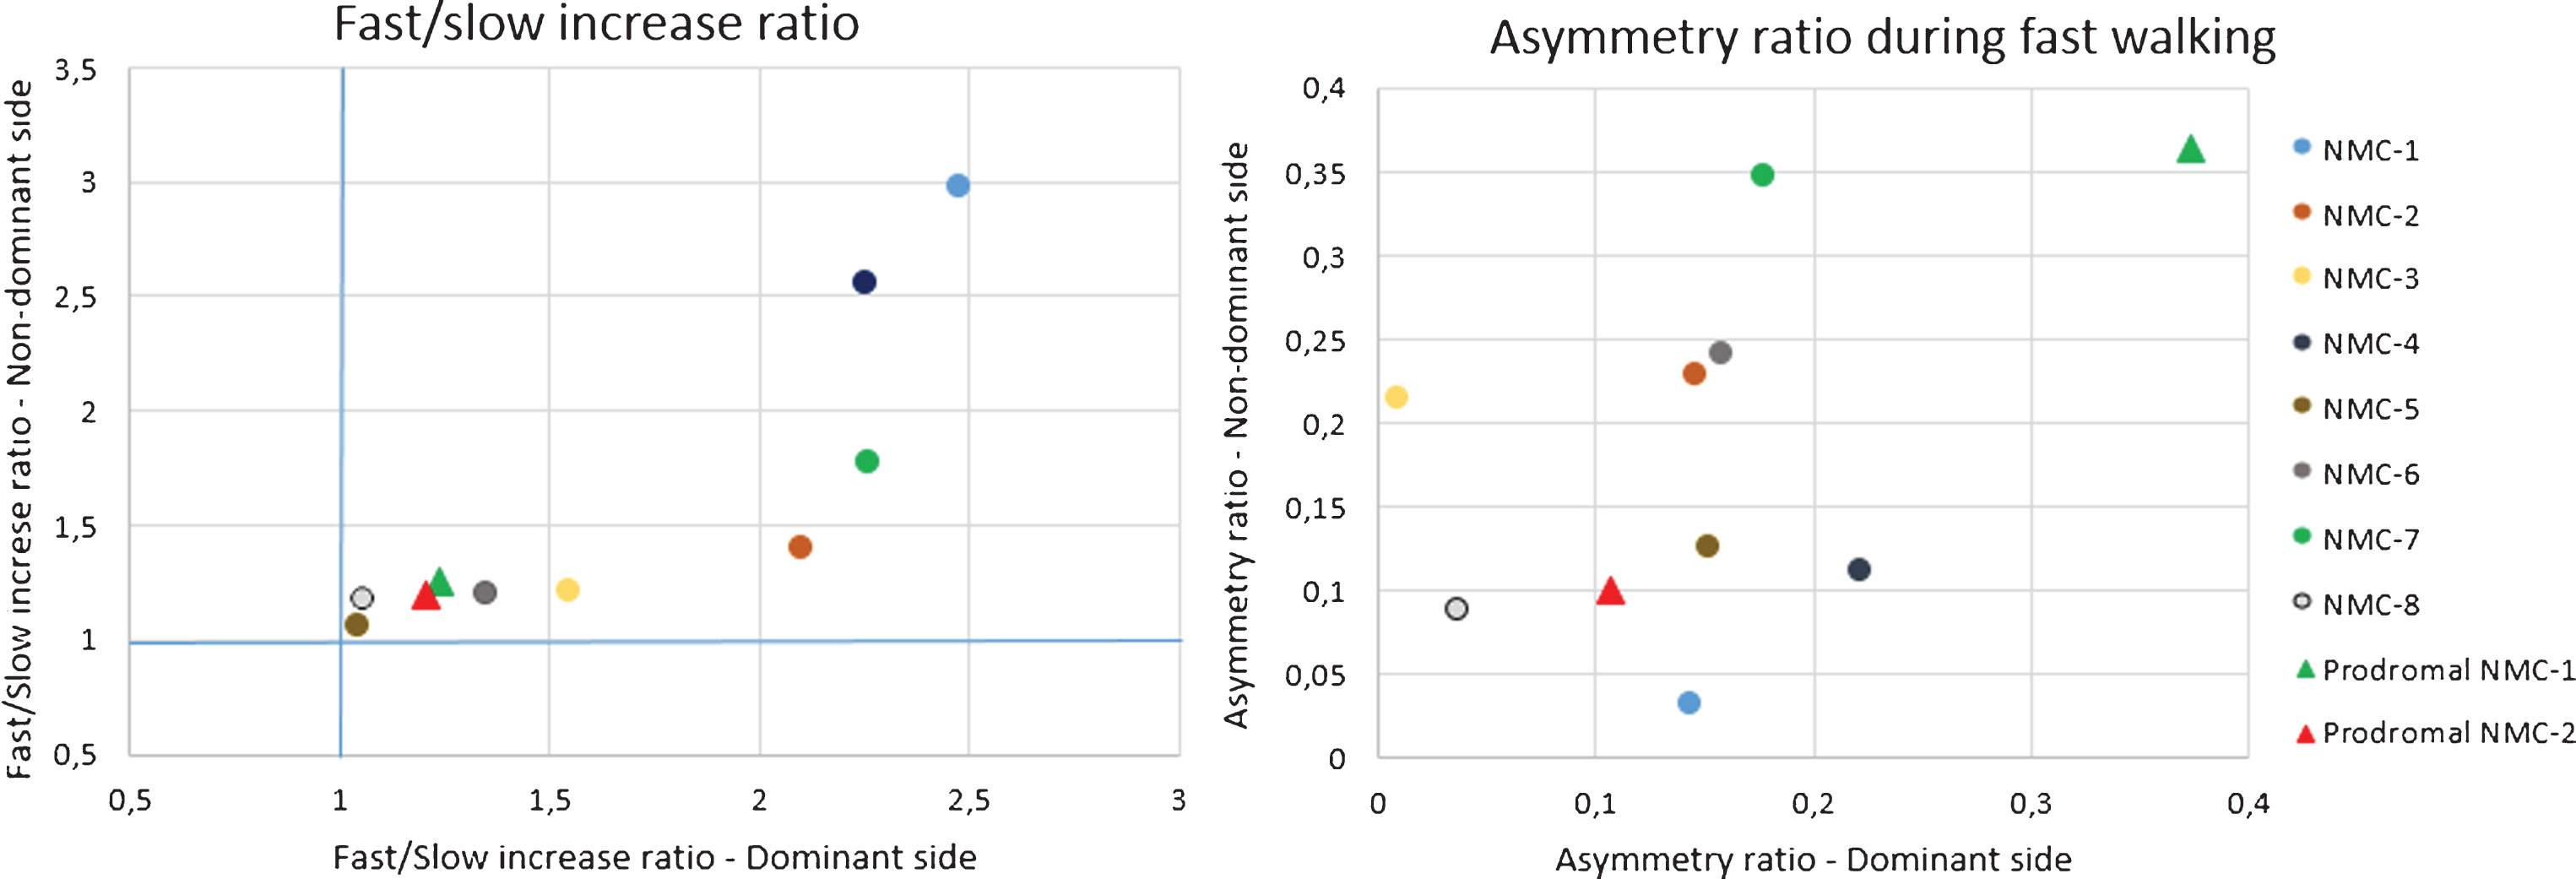
Exploratory graphic display of Fast/slow and asymmetry ratio during walking from non-manifesting LRRK2 carriers (NMC1-8) who are not likely to be in a prodromal phase and two NMC who are likely to be in a prodromal phase (Prodromal NMC-1 and -2), according to the International Parkinson and Movement Disorder Society criteria.
Daily activity
In univariate analysis, the proportion of the day spent in the top 10% of the activity range was significantly higher in the control group (11%) compared to the LRRK2/iPD group (7%) (Table 2). This variable was negatively associated with age (p = 0.041). In a multivariate model adjusted for age, the effect was similar but was no longer significant. Asymmetry in daily activity was higher in the LRRK2/iPD group compared to the control group in univariate analysis, but not significant after adjusting for age (age was positively associated with asymmetry, p = 0.007). The remainder of the between group comparisons were not significant. There was no difference in daily activity between the unrelated controls and related individuals without a LRRK2 mutation (p = 0.419).
Summary of estimates and probabilities for model 1 for the (a) dominant and (b) non-dominant side
In model 1 it is assumed that all variances (between-subject, between-day and residual between-epoch variance) differ across the groups. SDepoch, within-subject, within-day, between-epoch standard deviation; SDday, within-subject, between-day standard deviation; SDsubj, between-subject standard deviation; P, probability; LRRK2, LRRK2 associated Parkinson’s disease; iPD, idiopathic Parkinson’s disease; NMC, non manifesting LRRK2 carriers.
Sleep fragmentation
There was no significant difference in fragmentation of sleep between any of the groups (Table 2).
DISCUSSION
Bilateral ambulatory actigraphy detected movement alterations, in individuals with PD and NMC, highlighting its potential value to identify individuals at high risk of developing PD. There is limited data on the use of actigraphy as a biomarker for PD. To our knowledge, this is the first actigraphy study performed in NMC that examined intra-individual asymmetry.
Intra-individual variability
The PD and NMC groups had more between-epoch variability during walking than controls, suggesting that they may have more difficulty maintaining a stable arm swing. In individuals with PD, all types of variability were higher: between-day, between-subject and between-epoch. In NMC, the higher variability within a subject seems to be mainly caused by higher between-epoch variance within a walking task and less by between-day variance. Our findings are consistent with those of Mirelman et al. who found higher stride-time variability in NMC [6]. It is therefore possible that gait variability is one of the first detectable motor symptoms in prodromal PD, although it remains possible that the variability in LRRK2 carriers is unrelated to their potential development of PD. Another study in non-LRRK2 PD, using hyperechogenicity of the substantia nigra together with clinical symptoms to select their high risk cohort, found changes in intra-individual variability in trunk acceleration in the high risk PD group [7]. This suggests that alteration of intra-individual variability in activity is not only related to the LRRK2 mutation, but also manifests in other high risk cohorts.
Activity during walking and asymmetry
In healthy individuals, arm swing increases with higher walking velocity [20] and we found similar results in our cohort with the Actiwatch. The increase in activity from slow walk to fast walk was higher in controls compared to the LRRK2/iPD group. This implies that individuals with PD have a lower capability of adjusting their arm swing to increasing walking velocity, indicative of a decline in compensatory mechanisms.
Asymmetry between wrists was most pronounced during fast walking and this task accentuated the difference between individuals with PD and controls. It has been suggested that arm swing asymmetry diminishes with ongoing disease [20]. The present cohort consists of individuals with different disease duration, and it is therefore possible that individuals with longer disease duration attenuate the overall effect in this group. There was no difference between NMC and controls for asymmetry and increase in arm swing. However, if we compare the individual results of the two NMC who were identified as being likely to be in a prodromal phase (prodromal-NMC), we found that asymmetry during walking and increase in arm swing is altered compared to the overall NMC group. This generates the hypothesis that prodromal-NMC start to show altered compensatory mechanisms compared to the not prodromal-NMC. A larger sample is needed to formally test this hypothesis.
Limitations
The Actiwatch used in this cohort cannot distinguish the direction of movement. Allowing one to determine not only the amount but also the direction of movement may prove to be of additional value in identifying movement patterns predictive of PD. Also our actigraphs have a relatively low temporal resolution (15-s epochs). Higher resolution actigraphs may identify short-time-scale patterns of movements, which might be of additional value at the level of individual arm swing. Next steps for research should include the use of next-generation tri-axial devices with a higher sampling rate and higher spatial and temporal resolution. In addition, our study captures only acceleration of the arms and not other gait parameters.
Another important limitation of the present study is that the control group was not age-matched with the LRRK2/iPD group. Although other papers did not report age as an influencing factor on asymmetry [21, 22], how age influences actigraphy results is still not fully understood. Even though our methods detected some alterations in daily activity and asymmetry in PD, we did not demonstrate those changes in non-manifesting LRRK2 carriers. It is possible that these features are not (yet) affected in our relatively young NMC cohort, but it also remains possible that our methods are not sensitive enough to detect small changes, particularly in such a small sample. The sample size also limited our ability to examine differences between iPD and LRRK2-PD. Finally, it is important to note the incomplete penetrance of the LRRK2 mutation, and therefore a proportion of the NMC will not be in a prodromal phase. In a cross-sectional study we cannot identify those high risk PD individuals who are actually destined to develop PD. Large scale, longitudinal studies will be required to validate our findings.
The small sample size of our LRRK2 and iPD groups necessitated combining them into one group. Although there is evidence that the phenotypes are similar [11] this is not without controversy [12]. Combining them may have obscured (or made manifest) differences that would not be present had the groups been examined individually.
Conclusion
Actigraphy is an easily applied method to detect movement alterations in individuals with PD. Higher intra-individual variability of movements during walking might be a useful biological marker of prodromal PD, and should be a main focus in future actigraphy studies in high risk PD. We devised a new task using a device that had not been previously put to this purpose and our results need to be replicated. Furthermore, longitudinal studies are needed to reveal whether or not non-manifesting LRRK2 carriers are actually in a prodromal state and thus confirm the significance of our findings.
CONFLICT OF INTEREST
The authors have no conflict of interest to report.