
Abstract
INTRODUCTION
Falls are a debilitating problem for people with PD and account for innumerous fall-related injuries [1, 2], with reported incidence of at least one fall ranging from 35% to 90% and of recurrent falls from 18% to 65% over a 12-monthperiod [2].
It has been suggested that single and recurrent fallers with PD may differ on some functional characteristics [1, 3]. However, there is a lack of information about similarities and differences between these groups given that only a few studies have reported such analysis [1, 3]. In addition, it has been shown that in people with PD without a history of falls the accuracy for predicting all falls (≥1 falls) is lower than for predicting recurrent falls (≥2 falls), which may be explained by the greater number of fall risk factors presented by recurrent fallers [4].
Previous prospective studies have identified history of falls [2, 5–9], disease severity [2, 8], disability [4, 7] and reduced balance confidence [5, 9] as independent predictors of recurrent falls in people with PD. Other risk factors have been shown to be associated with recurrent falls, such as freezing of gait (FOG) [4, 6–10], reduced balance and mobility [1, 7–11], fear of falling [2, 4] and mild cognitive impairment [2, 9]. However, associations alone do not provide information about possible combinations of risk factors to provide the most predictivepotential [12].
Clinical prediction rules may summarize multiple predictors to provide objective estimates of the probability of a certain outcome and improve clinical decision making [12]. To date only one clinical predictive rule has been reported to predict all falls in people with PD over the next six months [13], but this approach has not been used to predict recurrent falls.
Therefore, the aims of this study were to: 1) compare clinical and functional characteristics of people with PD who are non-fallers, single fallers and recurrent fallers; 2) determine predictors of time to second fall; and 3) develop a clinical predictive tool for identifying people with PD at different categories of falls risk. We hypothesized that non-fallers and single fallers would show similar characteristics while they would differ from recurrent fallers. In addition, we hypothesized that a wide range of risk factors would be associated with recurrent falls and that a clinical predictive tool would be accurate in providing the risk of falling recurrently within the next 12months.
MATERIALS AND METHODS
Participants
Community-dwelling participants diagnosed with idiopathic PD by a certified neurologist, in accordance with UK Parkinson’s Disease Society Brain Bank clinical diagnostic criteria [14], and able to walk without assistance of another person, with or without an assistive device, were recruited from the Movement Disorders Clinic at the State of Bahia Health Attention Center for the Elderly, Brazil. Exclusion criteria included people with PD in Hoehn and Yahr stage V, neurological conditions other than PD, cognitive impairment (Mini-Mental State Examination [MMSE] cutoff scores based on the level of education of each participant) [15] and co-morbidities that would affect balance. Participants were recruited between April 2010 and June 2013 and the follow-up period lasted until June 2014. The study was approved by a local research ethics committee (CEP-SESAB, 042/2010). All participants provided written informed consent and were assessed during the “on” phase of the medication cycle.
Baseline assessments
Age, sex, history of two or more falls in the past year (self-reported confirmed by participant’s family or caregiver), co-morbidities (self-reported complemented by chart review), PD duration, dyskinesia, motor fluctuations, PD-specific and non-PD specific medications taken were recorded. The levodopa equivalent dose (LED) was calculated [16] and polypharmacy was defined as ≥4 medications other than anti-parkinsonian drugs [17]. Measures of disease severity included the motor section of the Unified Parkinson’s Disease Rating Scale (UPDRS) and the modified Hoehn and Yahr (H&Y) stage in the “on” state. Disability was ascertained by the UPDRS activities of daily living (ADL) section and Schwab and England scale (S&E) [18]. PD motor subtypes [19] were determined. Participants were classified as having FOG if they scored ≥1 point on item 14 of the UPDRS ADL. Health-related quality of life was measured by the 8-item Parkinson’s Disease Questionnaire [20].
The Activities-specific Balance Confidence Scale (ABC) was used to assess self-perceived balance confidence while performing daily activities [21], as was the Falls Efficacy Scale-International (FES-I) to assess concern about falling while completing activities of daily living [22]. Both scales are related to the construct of fear of falling [23, 24]. However, they measure different content, with the ABC being strongly related to mobility issues while the FES-I also covers self-care and community, social and civic activities [23].
Performance-based balance measures included the Berg Balance Scale (BBS), which addresses anticipatory balance control with and without a change in base of support during functional tasks [25]; Functional Reach Test, which provides information related to anticipatory balance control without a change in base of support while reaching forward [26]; Timed Up & Go Test (TUG), which reflects functional mobility and was performed twice, with the second trial recorded as the test result and participants wearing their regular footwear and using their customary walking aids [27]; and Dynamic Gait Index, which evaluates balance during gait [28].
Procedures
The order of assessments was standardized for all participants and administered on the same day as they were recruited. The test battery took approximately 60 minutes to be completed. Rest intervals were given if needed at any time of the evaluation. A fall was defined as “an event which results in a person coming to rest unintentionally on the ground or other lower level, not as the result of a major intrinsic event or overwhelming hazard” [29]. Participants were followed-up for 12 months and required to complete a falls diary with every fall experienced during this period, as soon as they occurred. Monthly telephone calls were made to verify the recorded information by the participants, their families and/or caregivers and to verify missing data. This method is still considered to be the best one for collecting fall incidence data [30].
Statistical analysis
Data were analyzed using IBM SPSS version 21 (IBM Corp, Armonk, New York). Kolmogorov-Smirnov normality test was performed to test whether the measures were normally distributed or not. After 12 months of follow-up, participants were classified as non-fallers, single fallers (1 fall) and recurrent fallers (≥2 falls), and comparisons between these groups were performed using ANOVA or Kruskal-Wallis test. The following post-hoc tests were used to compare these groups: Bonferroni correction for equal variances, Games-Howell test for unequal variances or Dunn’s test. Participants who were lost during follow-up were excluded from this first analysis, assuming missingness atrandom.
To identify associations between potential predictors and recurrent falls, Kaplan-Meier survival curves and log-rank tests were performed. The time to second fall within 12 months of follow-up was used as the outcome measure. Therefore, for this second analysis participants were categorized as non-recurrent fallers (0 or 1 fall) or recurrent fallers (≥2 falls). Predictor variables were grouped into nine domains (i.e. demographic, PD severity, PD symptoms, co-morbidities, PD-specific and non-PD specific medications, disability, balance/mobility and self-efficacy). Number of co-morbidities was tested as an ordinal variable. The variables number of co-morbidities, LED and polypharmacy were set as the main potential predictors in their specific domain. Variables measuring similar construct in the same domain were set as the main potential predictors based on the lowest p-value and highest area under the Receiver Operating Characteristic (ROC) curve (AUC) [31]. Because PD symptoms represented different aspects related to risk of falling, we added each one at a time and the best-fitting model waskept.
Selected predictors with p < 0.10 in univariate analysis within each domain were chosen to be entered into the Cox regression model adjusted for age and sex. We then used a backward stepwise (likelihood ratio) selection method, with p-to-remove set at 0.10. We dichotomized each continuous predictor at its best accuracy value (AUC curve Youden index) [31] for a final model containing only dichotomous predictors (model 1). A further exploratory analysis was conducted to check whether the inclusion of a balance measure would improve the predictive accuracy of the model [32] (model 2). The proportional hazards assumption was tested on SAS version 9.4. To internally validate the models, 1000 bootstrap samples were drawn from the original sample and 95% confidence interval (CI) for the regression coefficients were obtained. To create the clinical predictive tools, regression coefficients were then used to assign a weight to each independent predictor. The resultant score was split into three risk categories (i.e., low, moderate and high) based on the number of participants within each score. Kaplan-Meier curves were performed to verify the ability of each risk category in discriminating those who had fallen recurrently. ROC curves were developed for both models and predictive tools using Stata version 14.1 (Stata Corporation, College Station, TX) and AUCs were compared. Bootstrapped AUCs were calculated as well.
RESULTS
Participant characteristics and comparisons between non-fallers, single and recurrent fallers
Two hundred twenty-nine individuals with PD, mean H&Y 2.6 (SD .57), were enrolled in this study. There were two (1%) participants in H&Y stage 1, 75 (33%) in stage 2, 74 (32%) in stage 2.5, 62 (27%) in stage 3 and 16 (7%) in stage 4. Kolmogorov-Smirnov normality test indicated that the measures were normally distributed, except the TUG. Of the 225 participants who completed a one-year follow-up period, 114 (51%) were classified as non-fallers, 27 (12%) as single fallers and 84 (37%) as recurrent fallers. Participants reported 1290 falls in total. Between group comparisons and post-hoc analysis are shown in Table 1. Overall there were no differences between non-fallers and single fallers in terms of clinical and functional measures. However, recurrent fallers significantly differed from both non-fallers and single fallers.
Characteristics of non-fallers, single and recurrent fallers at baseline and between group comparisons (n= 225)
aANOVA. bKruskal-Wallis. cBonferroni. dGames-Howell. eDunn. SD, standard deviation; Min, minimum; Max, maximum; UPDRS, Unified Parkinson’s Disease Rating Scale; PD, Parkinson’s disease; LED, levodopa equivalent dose; ADL, activities of daily living; BBS, Berg Balance Scale; DGI, Dynamic Gait Index; FRT, Functional Reach Test; ABC, Activities-specific Balance Confidence Scale; FES-I, Falls Efficacy Scale-International; PDQ-8, eight-item Parkinson’s Disease Questionnaire; H&Y, Modified Hoehn and Yahr Scale; S&E, Schwab and England scale; TUG, Timed Up and Go Test.
Univariate analysis
Univariate associations between potential predictors and recurrent falls are shown in Table 2. In the PD severity domain, the AUC ranged from 0.74 (95% CI 0.67–0.79) (PD duration) to 0.75 (95% CI 0.69–0.80) (UPDRS motor section). In the disability domain, from 0.79 (95% CI 0.73–0.84) (S&E) to 0.83 (95% CI 0.78–0.88) (UPDRS ADL). In the balance/mobility domain, from 0.72 (95% CI 0.66–0.78) (TUG) to 0.79 (95% CI 0.73–0.84) (BBS) and in the self-efficacy domain from 0.73 (95% CI 0.67–0.79) (ABC) to 0.74 (95% CI 0.67–0.79) (FES-I).
Demographic and clinical characteristics at baseline and univariate analysis (n = 229)
aUPDRS item 14, b≥4 other than PD, cHigh scores indicate better performance. SD, standard deviation; N, number; Min, minimum; Max, maximum; HR, hazard ratio; PD, Parkinson’s disease; UPDRS, Unified Parkinson’s Disease Rating Scale; H&Y, Modified Hoehn and Yahr Scale; TD, tremor-dominant; PIGD, postural instability and gait difficult; FOG, freezing of gait; LED, levodopa equivalent dose; S&E, Schwab and England scale; ADL, activities of daily living; BBS, Berg Balance Scale; DGI, Dynamic Gait Index; FRT, Functional Reach Test; TUG, Timed Up and Go Test; ABC, Activities-specific Balance Confidence Scale; FES-I, Falls Efficacy Scale-International.
Multivariate analysis
The predictors entered into the Cox model were: history of two or more falls in the past year, UPDRS ADL and motor sections, dyskinesia, motor fluctuations, LED (per 100 mg increase), polypharmacy, BBS and FES-I. The following predictors were retained after backward stepwise (likelihood ratio) method: history of two or more falls in the past year (Hazard Ratio [HR] = 3.94; 95% CI 2.26–6.86; p < 0.001), motor fluctuations (HR = 1.91; 95% CI 1.12–3.26; p = 0.017), UPDRS ADL (HR = 1.10 per 1 point increase; 95% CI 1.06–1.14; p < 0.001) and LED (HR = 1.09 per 100 mg increase; 95% CI 1.02–1.16; p = 0.011). There were no differences in the predictors retained in the model after adjustment for age and sex.
The same model using dichotomized variables for UPDRS ADL (>12 points) and LED (>700 mg/day) is shown in Table 3. This model (model 1) was moderately to highly accurate in predicting recurrent falls (AUC = 0.83; 95% CI 0.77–0.89). The exploratory analysis conducted by adding to the model one balance measure at a time revealed that only the BBS ≤49 points was significantly associated with recurrent falls. This led to model 2, which also had moderate to high accuracy in predicting recurrent falls (AUC = 0.86; 95% CI 0.81–0.92). The proportional hazards assumption was met by both models (p > 0.05).
Multivariate Cox models containing only dichotomous predictors (n = 229)
CI, confidence interval; HR, Hazard Ratio; AUC, area under the receiver operating characteristic curve; UPDRS, Unified Parkinson’s Disease Rating Scale; ADL, activities of daily living; LED, levodopa equivalent dose; N/A, not applicable; BBS, Berg balance scale.
Development of the predictive tools
In relation to model 1, history of two or more falls in the past year, motor fluctuations and UPDRS ADL >12 points were significantly associated with recurrent falls (p < 0.05) and were used to develop the predictive tool 1. The bootstrap method led to the same independent predictors. Assigned weights to each predictor and the scores based on their presence or not are shown in Tables 3 and 4, respectively. This predictive tool 1 had moderate to high accuracy in predicting recurrent falls (AUC = 0.84; 95% CI 0.78–0.90) (Table 4). The bootstrap-adjusted AUC was 0.78 (95% CI 0.71–0.86).
Predictive tools based on the independent predictors of recurrent falls (n = 229)
AUC, area under the receiver operating characteristic curve.
In relation to model 2, history of two or more falls in the past year, motor fluctuations, UPDRS ADL >12 points, LED >700 mg/day and BBS ≤49 points were significantly associated with recurrent falls (p < 0.05) and were used to develop the predictive tool 2. All these predictors were significantly retained in the model after bootstrap method. Assigned weights to each predictor and the scores based on their presence or not are shown in Tables 3 and 4, respectively. This predictive tool 2 had moderate to high accuracy in predicting recurrent falls (AUC = 0.86; 95% CI 0.81–0.92) (Table 4). The bootstrap-adjusted AUC was 0.83 (95% CI 0.76–0.90). Table 4 shows the number of participants in each category of falls risk (i.e., low, moderate and high) and the probability of falling recurrently in accordance with each predictive tool. Table 5 shows the cutoff points and validity indices for both predictive tools. Figure 1 shows how to fill in each predictive tool and to determine the fall risk category and the probability of falling recurrently in the next year. Figure 2 shows the time to second fall for participants in each category of fall risk (p < 0.001). The median time to second fall for participants at high risk of recurrent falls was 1.7 month (95% CI 1.1–2.4) considering the predictive tool 1, while it was 1.9 month (95% CI 0.9–2.8) for the predictive tool 2.
Cutoff points, sensitivity, specificity, positive and negative likelihood ratios for the 3-predictor tool and the 5-predictor tool
LR+, positive likelihood ratio; LR–, negative likelihood ratio.
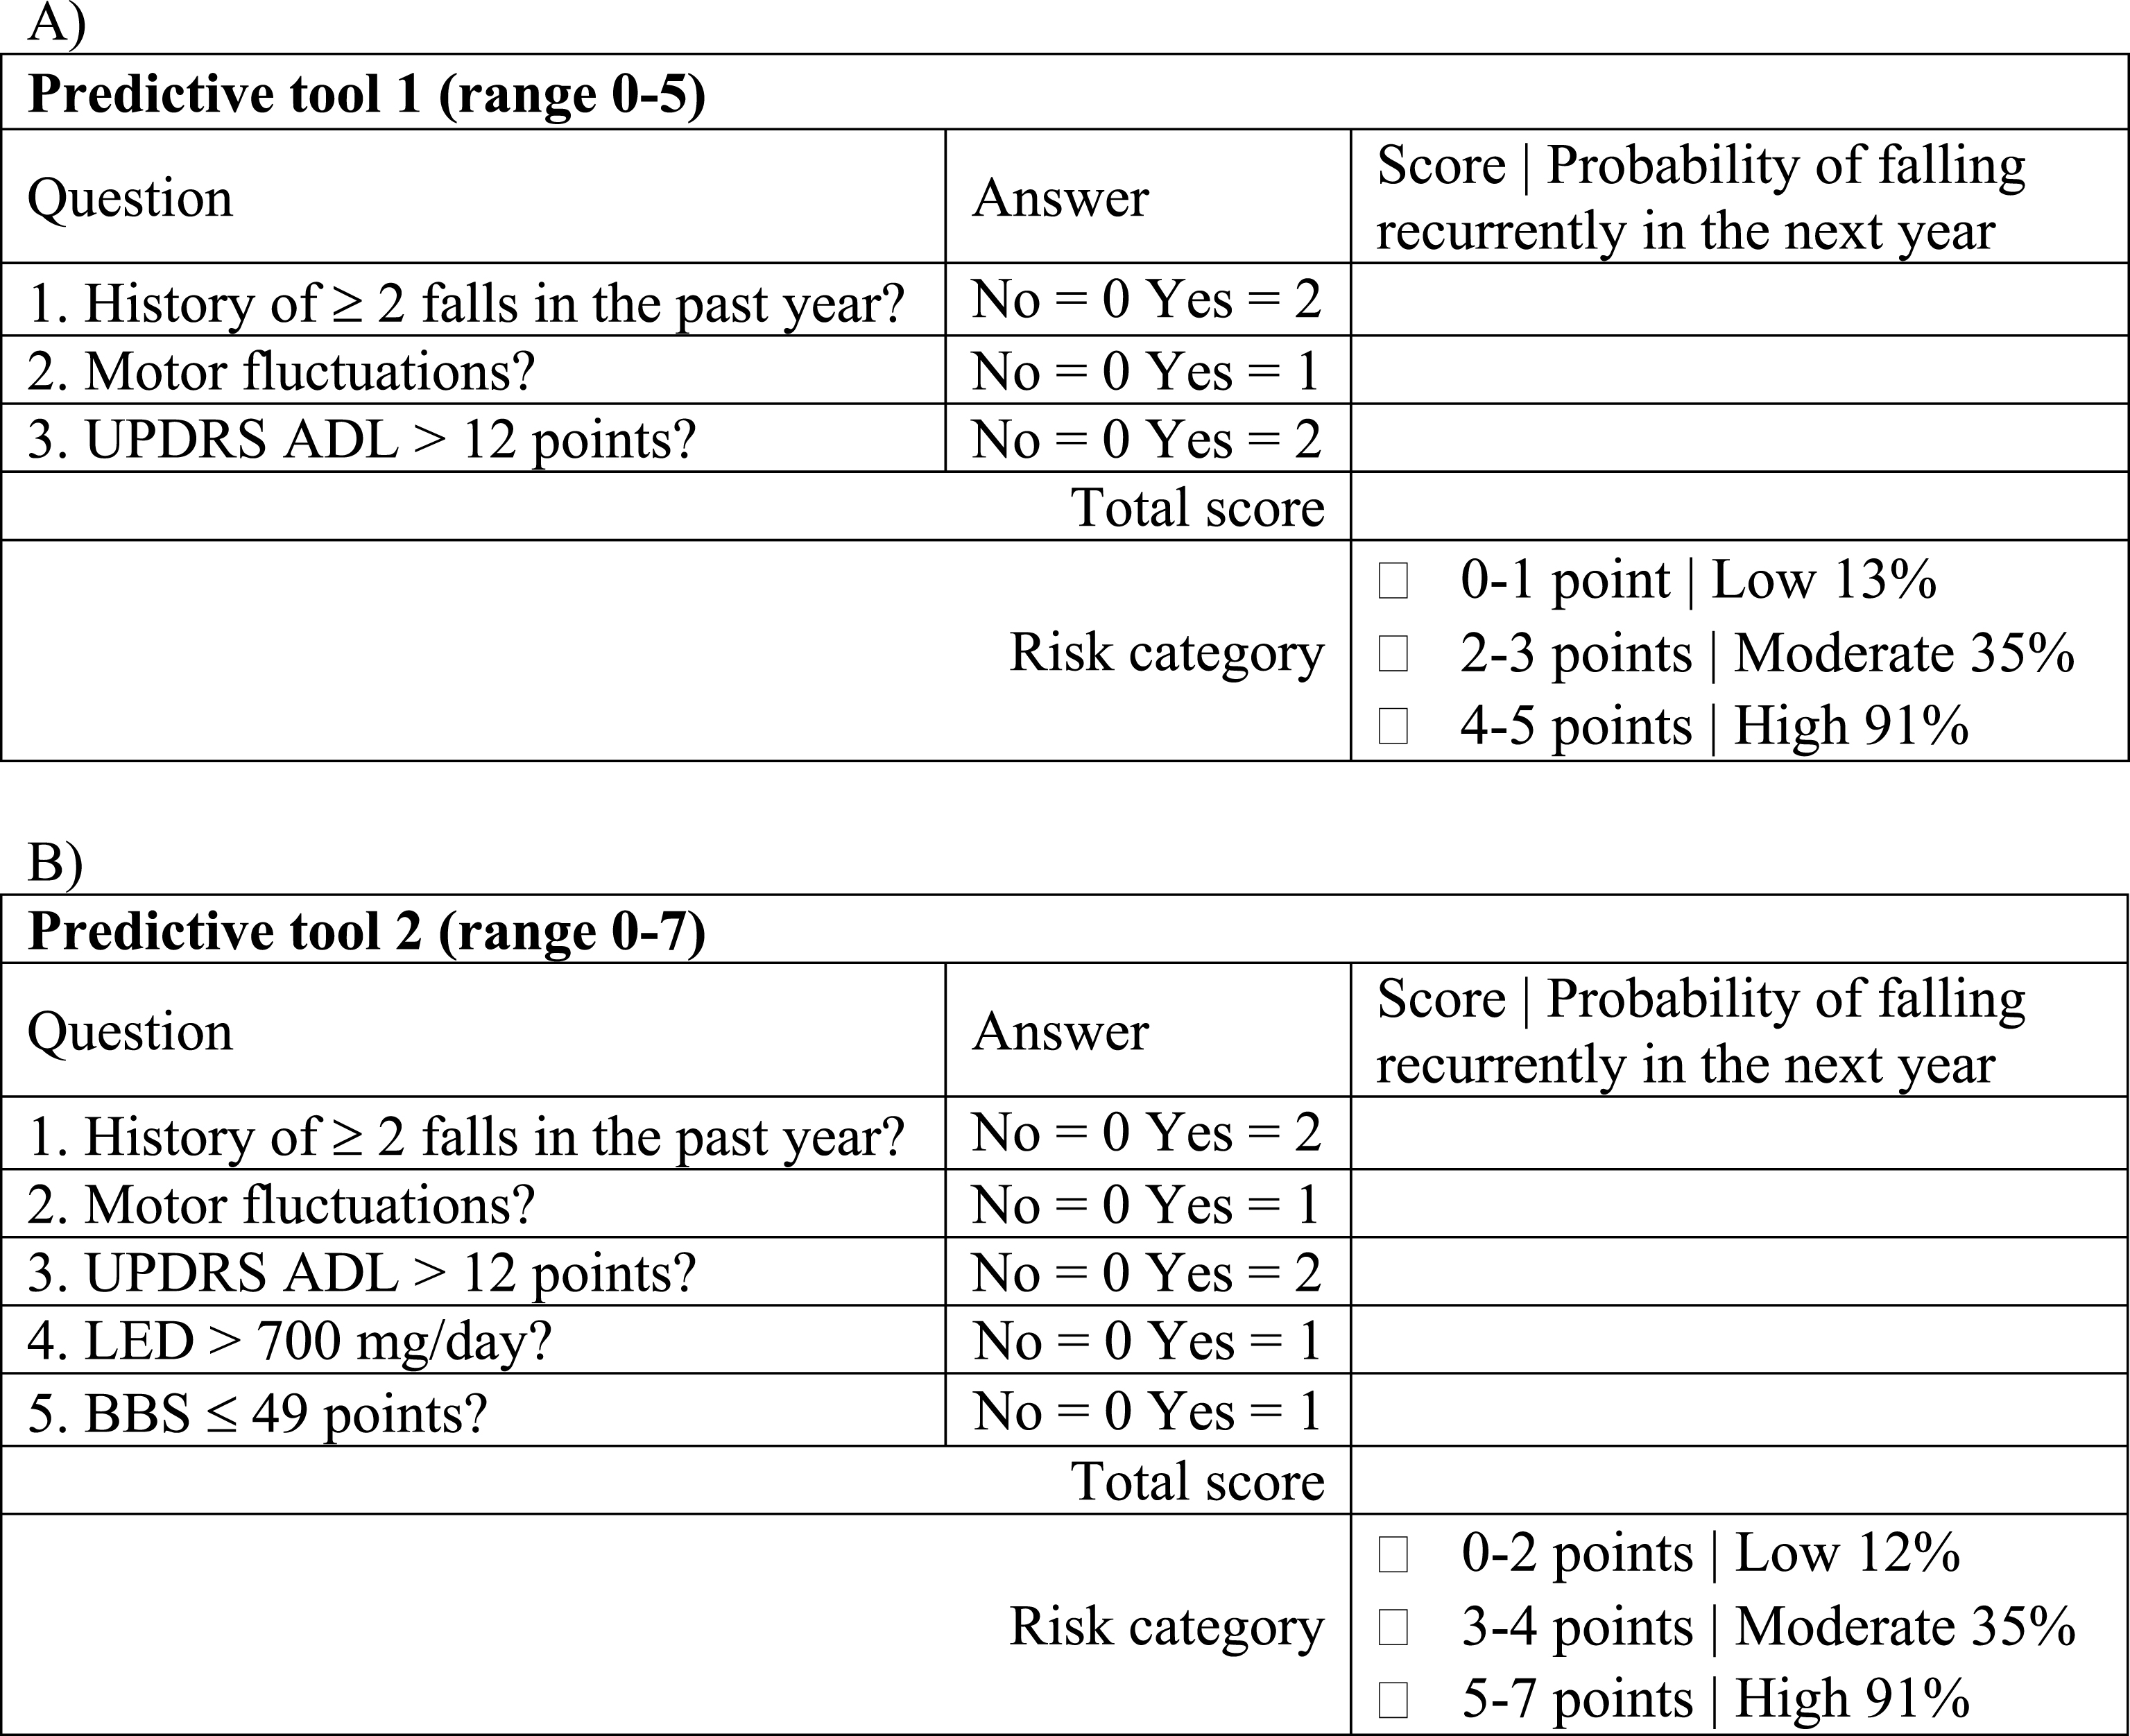
Instructions on how to fill in each predictive tool and to determine the fall risk category and the probability of falling recurrently in the next year. A) Predictive tool 1. B) Predictive tool 2. UPDRS, Unified Parkinson’s Disease Rating Scale; ADL, activities of daily living; LED, levodopa equivalent dose; BBS, Berg balance scale.
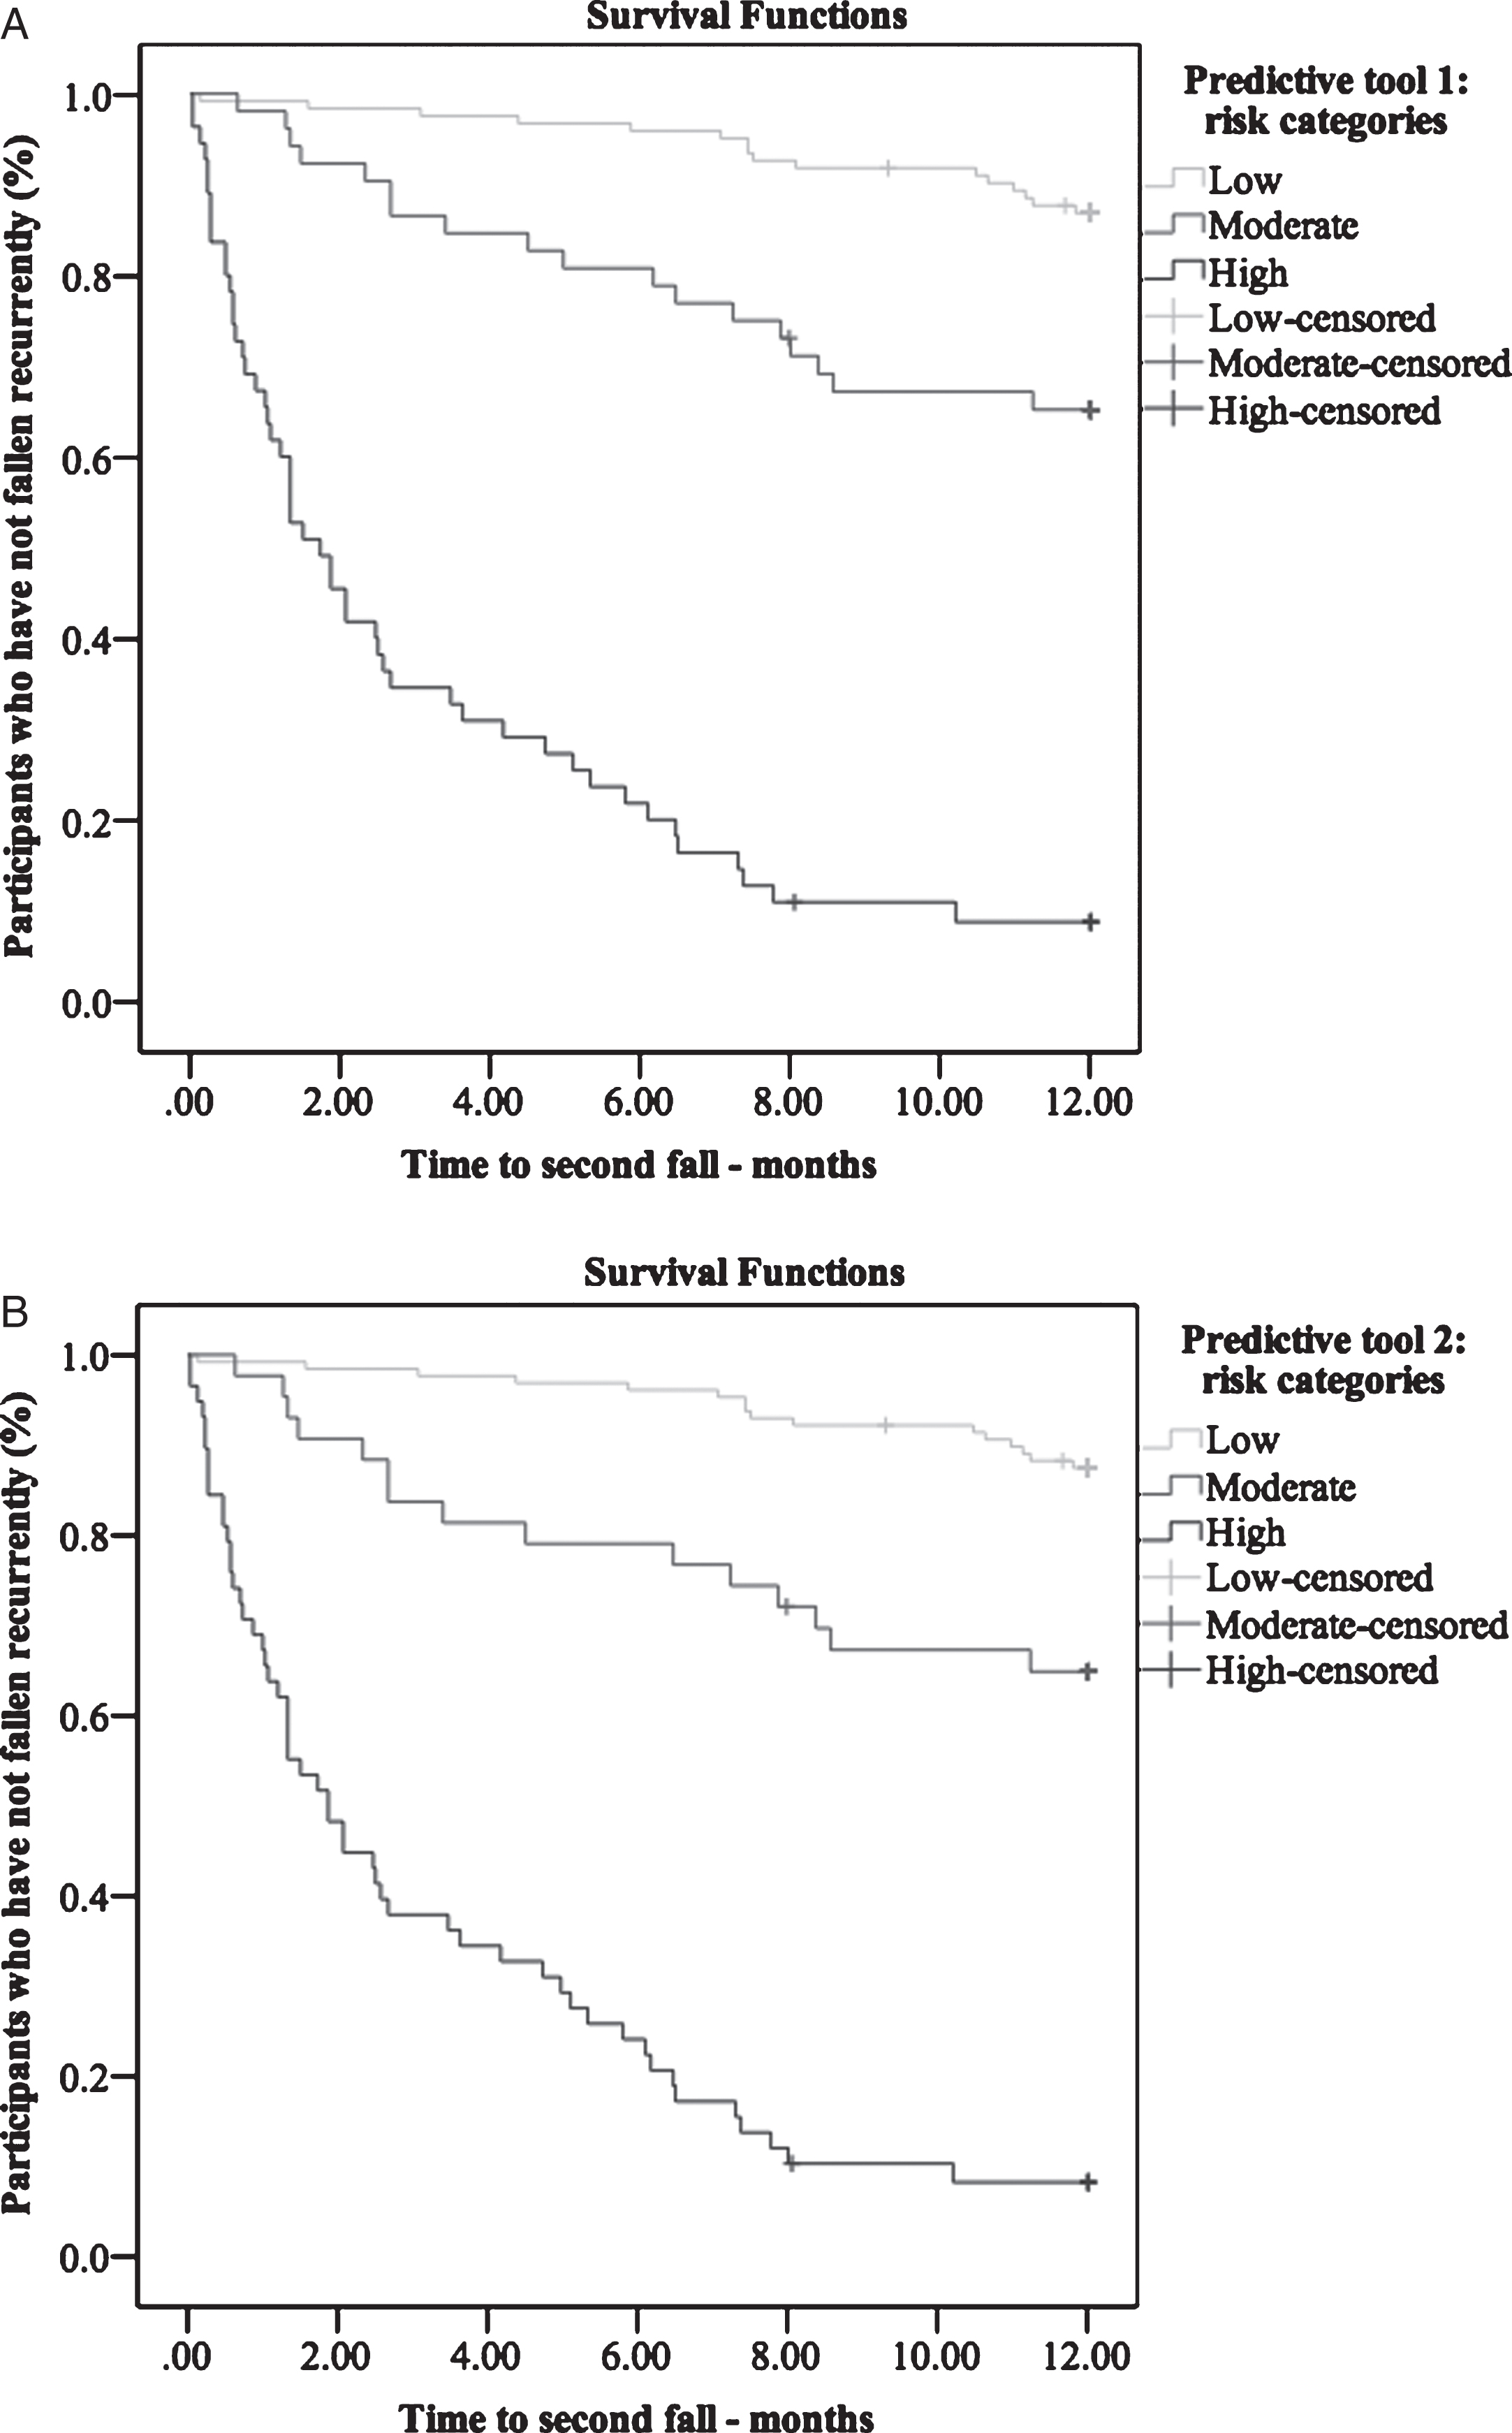
Time to second fall for participants in each category of fall risk (i.e., low, moderate and high). A) Predictive tool 1. B) Predictivetool 2.
DISCUSSION
In this large prospective study, single and recurrent fallers with PD were shown to differ on clinical and functional characteristics. A history of recurrent falls in the past year, motor fluctuations, disability and higher anti-Parkinson medication intake were found to be the main independent predictors of time to second fall (and therefore of recurrent falls). Moreover, we developed two fall predictive tools with moderate-to-high accuracy for identifying people with PD at risk of falling recurrently within the next year.
Non-fallers and single fallers showed similar PD duration, disease severity, anti-Parkinson medication intake, level of disability, balance/mobility performance, fear of falling, balance confidence and quality of life. On the other hand, compared with non-fallers and single fallers, recurrent fallers showed longer disease duration, greater disease severity and higher anti-Parkinson medication intake and level of disability. Also, recurrent fallers showed greater balance/mobility impairment and fear of falling, lower balance confidence and worse quality of life, in line with previous studies [1, 3]. These differences may explain the different falls characteristics and circumstances reported by single and recurrent fallers[1, 33], such as why single fallers with PD are more likely to have their falls outdoors, accidently, while recurrent fallers are more likely to have their falls at the home environment caused mostly by intrinsic factors [1]. In addition, recurrent fallers have their first fall sooner than single fallers [3], even if they have not fallen in the past year [4]. Taken together, it is suggested that a greater number of potential risk factors may contribute to the occurrence of recurrent falls. Future trials investigating the effect of an intervention on balance, mobility and fall rates should take into account these differences to determine recruitment criteria and allocation of participants and type of intervention delivered.
A history of two or more falls in the past year was the strongest independent predictor of future recurrent falls, in line with previous studies [2]. Disability also showed an independent association with future recurrent falls [7], probably due to postural instability during the performance of daily activities and the presence/severity of FOG as measured by the UPDRS ADL. It is important to notice that not all individuals with PD may be able to recognize FOG episodes and, therefore, the examiner should demonstrate different types of FOG or show videos to assure that individuals understand the phenomenon. Interestingly, motor fluctuations were also found to be an independent predictor of recurrent falls, in contrast with previous authors [7]. It has been shown that people with PD show reduced balance and gait performance while off medication [11, 35]. Specifically, gait components such as velocity and stride length improve with dopaminergic medication across a variety of gait tasks [34, 35] which may be related to some fall-related activities in people with PD [1]. Moreover, stride time variability in the off state has been found to be a predictor of falls in individuals with PD [35] and may improve with cholinergic medications [36]. Taken together, it is suggested that motor fluctuations may account for daily variability on functional balance and mobility and therefore increase the likelihood of a fall.
A clinical predictive tool comprised by these 3 predictors (i.e. history of recurrent falls in the past year, motor fluctuations and UPDRS ADL >12 points) demonstrate moderate to high accuracy in predicting recurrent falls over the next 12 months. This accuracy is higher than previously reported single measures [5, 37] and most models [6] to predict recurrent falls in people with PD within the next year. In addition, these studies used small samples [5, 37]. Other models and individual measures of similar accuracy were based on a 6-month follow-up period [8, 11] or the reported accuracy was not based on the AUC [9]. The proposed clinical predictive tool is easy to use in the clinical setting and is not time-consuming since two out of three items require yes/no answers and the UPDRS ADL can be completed by the person with PD or caregiver. This tool classifies individuals as having low, moderate or high risk of falling recurrently, which may help the management of people with PD at different levels of fall risk. For example, individuals at low and moderate risk should receive falls advice, with those at moderate risk being monitored more frequently than an individual at low risk. On the other hand, individuals at high risk should be referred to a fall prevention program. It has been shown that disability improves with physical therapy interventions [38] and that drug treatment can reduce off time [39], which, in turn, may reduce the likelihood of falling.
Impaired balance (BBS ≤49 points) and higher anti-Parkinson medication intake (LED >700 mg/day) also came out as independent predictors of recurrent falls when a further exploratory analysis was conducted to identify whether the inclusion of a balance measure would improve the predictive value of the primary Cox model. This indeed significantly improved the accuracy of the model. Daily levodopa dosage may reflect disease severity and its association with future recurrent falls has been reported by previous authors [1, 7], although not as an independent predictor. Moreover, despite improvements on gait components, levodopa may impair balance by exacerbating postural sway [40]. The BBS has some fall-related tasks [1] which may explain its greater contribution to the Cox regression model. Balance/mobility measures have shown moderate to high accuracy for predicting recurrent falls in PD [8, 41]. However, mixed results have been reported with regard to their independent contribution to recurrent falls in this population [4, 8].
Therefore, a second clinical predictive tool is proposed comprised by five predictors (i.e. history of recurrent falls in the past year, motor fluctuations, UPDRS ADL >12 points, BBS ≤49 points and LED >700 mg/day). This 5-predictor tool has slightly higher accuracy than the 3-predictor tool, despite not being statistically different, and requires more time to be performed. However, the presence of a balance measure may provide insight into the mechanisms related to a fall. It also provides the same categories of risk of falling recurrently over the next 12 months (i.e. low, moderate or high risk), with an added advantage that both LED and balance impairment are modifiable fall risk factors [17], with the BBS showing improvement with physical interventions targeting postural instability [38].
Mild cognitive impairment is a strong predictor of falls in some studies [2, 9], but not others [2, 13]. Our study excluded participants with overt cognitive impairment according to MMSE cut-off scores [15], which decreases our ability to show associations between this predictor and fall rates. Therefore, our findings are directly applicable only to people with PD without significant cognitive impairment. Moreover, all participants were required to be able to walk without assistance of another person, with or without an assistive device, which limits applicability of our findings to all people with PD. Recently, MDS-UPDRS scores have been proposed to replace UPDRS score, with reliable conversion formulas between both scales based on H&Y stages [42]. However, since previous studies predicting fall risk have used UPDRS [2, 5–7] and the MDS-UPDRS has demonstrated variable accuracy for predicting falls [8, 10], we chose to report the older version results for comparative purposes. Strengths of this study include the evaluation of several fall risk factors in a single cohort of people with PD and the development of two clinical predictive tools, which provide absolute probability of falling recurrently within the next year. The use of internal validation procedures contributes to increase the reproducibility of the tools. However, future studies to address external validation and their generalizability are required.
In summary, recurrent fallers with PD demonstrated different clinical and functional profile when compared to single fallers, which may require specific fall-prevention strategies for both groups. A 3-predictor tool comprised by history of recurrent falls in the past year, motor fluctuations and UPDRS ADL >12 points, and a 5-predictor tool comprised by these three predictors plus BBS ≤49 points and LED >700 mg/day were developed with moderate to high accuracy for predicting recurrent falls in people with PD within the next year. Since there was no statistical difference in their accuracy for falls prediction, clinicians should select one to be used based on the time and materials available for the assessment, for example. Both tools may guide clinicians in the identification of individuals at low, medium and high risk of falling recurrently and the referral for fall prevention programs. However, effective types of intervention based on each level of falls risk are yet to be determined.
CONFLICTS OF INTEREST
The authors have no conflict of interest to report.
Footnotes
ACKNOWLEDGMENTS
The authors thank the people with PD and their families for their participation in this study and Antonio Alberto Lopes for his statistical consultations.