Presented three-axis neutron diffractometer performance documents the feasibility of using it in special cases high-resolution powder diffraction studies, namely, for elastic and plastic deformation studies of bulk polycrystalline samples when the whole powder diffraction spectrum is not required. Contrary to the conventional double-axis setting the suggested alternative consists of an unconventional three axis set-up employing a bent perfect crystal (BPC) monochromator and analyzer with a polycrystalline sample in between. The analysis of the profile of the beam diffracted by a sample is carried out by rocking the BPC-analyzer and the neutron signal is registered by a point detector. Though the diffractometer alternative is, for measurements, much more time consuming, its resolution is, however, substantially higher and permits also plastic deformation studies on the basis of analysis of the sample diffraction profiles. The so-called analyzer rocking curve then provides a sample diffraction profile and could reflect the lattice or structural changes. Moreover, much larger widths (up to 10 mm) of the irradiated gauge volumes can be investigated when just slightly affecting the resolution of the experimental setting.
First attempts of testing a three-axis diffractometer set-up equipped with a bent Si monochromator and analyzer for investigation of stress fields in polycrystalline materials can be found, namely, in the nineties [6,13,16]. However, due to an important drawback consisting in a requirement of a much larger measurement time, the use of the setting appeared unpractical for rather a long measurement time even though the offered resolution was considerably higher with respect to usually used a conventional double-axis neutron diffraction scanner equipped with a position sensitive detector. The conventional neutron scanners have been found very effective, namely, in elastic strain investigations based on the measurement of small lattice parameter variations giving rise to shifts of diffraction peak profiles. However, the plastic strain is related to stress fields resulting from microstructural defects (dislocations, stacking faults etc.) which cause broadening of the diffraction profile. Then, various shape analysis procedures can be applied to quantify e.g. the density of dislocations and the mean crystalline size [2–4,8].
In this paper we present extensive experimental results obtained by testing the resolution and luminosity properties of the three-axis diffractometer setting with the Si(111) BPC monochromator in combination with the Si(220), Ge(111), Ge(311) or Si(400) BPC slabs as analyzers and with a polycrystalline sample in between. This paper can be considered as a continuation of our previous one presenting the properties of the dispersive DC (n,-m) monochromator of the BPC Si(111) slab in combination with the Si(220), Ge(111), Si(311) or Si(400) BPC slabs in relation with possible use in neutron diffractometry [11].
Theoretical background
Diffraction by a cylindrically bent perfect crystal
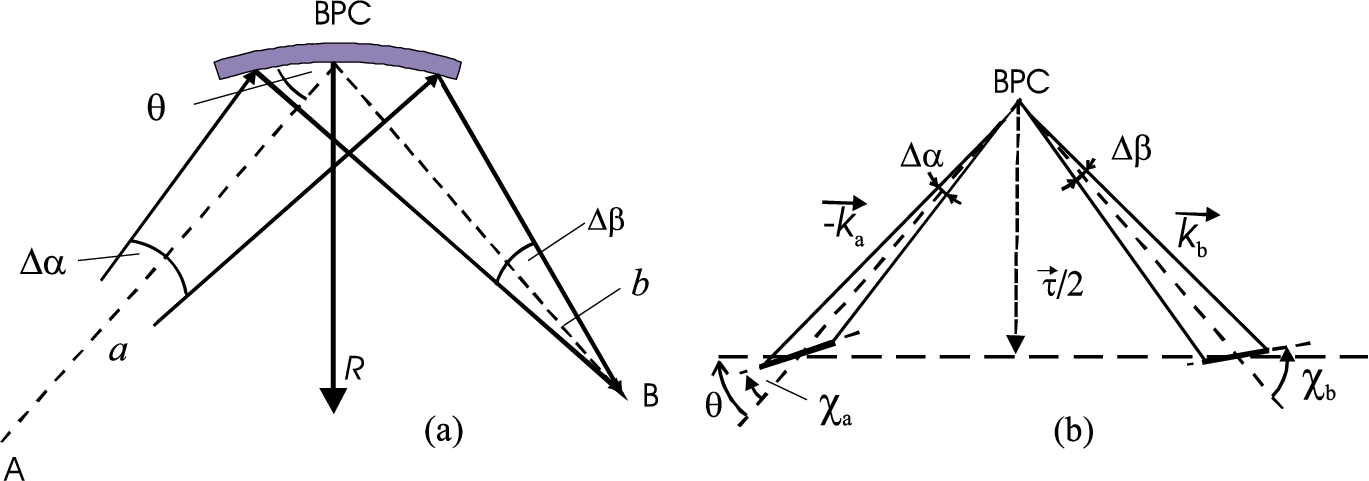
Schematic drawings of the real – (a) and momentum – (b) space representations of the diffraction by a cylindrically bent-perfect-crystal slab for (focal length).
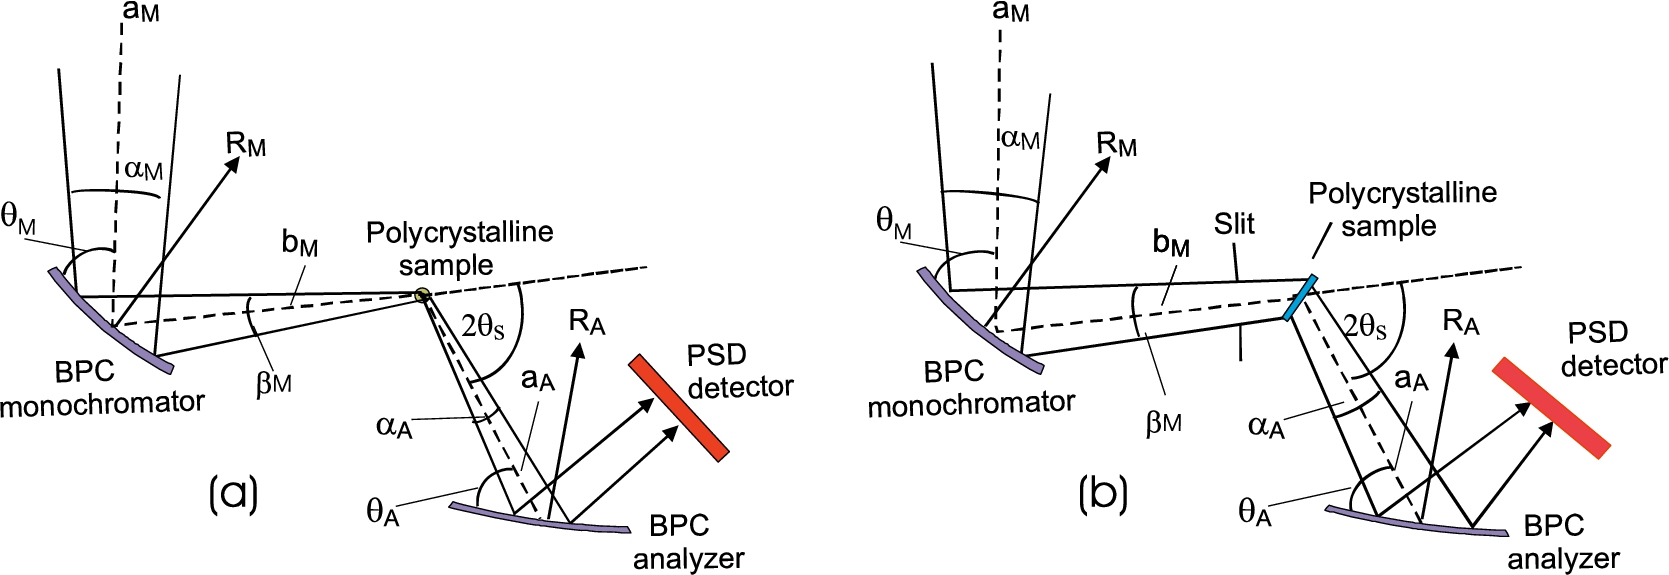
For the simplicity let us suppose a thin bent perfect crystal (BPC) monochromator and analyzer slabs bent to radii of curvature and , respectively and a point like sample in order to avoid small uncertainties, namely, coming from nonnegligible thickness of the crystal slabs and the dimensions of the sample in the scattering plane (see Fig. 1). We also assume the most usual symmetric reflection geometry.
First, let us start with the basic formulae for diffraction by one cylindrically BPC slab [12] (in this reference variety of different diffraction geometries are represented in momentum space). The general equation for imaging by lens with a horizontal radius of curvature R is usually introduced in the general form (see Fig. 1)
where
are the focal lengths for incident and reflected rays, a and b the distances of the object A and image B, respectively, α and β are the angles for incident and diffracted beams and θ is the nominal Bragg angle. Thus, for symmetric reflection geometry () . If we denote as a total change of the angle of incidence over the irradiated crystal-slab length
On the basis of Fig. 1 it is possible to derive the following parameters (in absolute values):
where
In practice, when the BPC slab is employed as a monochromator, the monochromator-sample distance of the diffractometer is fixed and should coincide with the image distance b. Supposing a negligible small width of the sample, on the basis of above written formulae, it is possible to derive
and correspondingly
Then,
Generally, the formulae derived for and show a possibility of rotation of abscissas and (i.e. the change of the angles and ) in the k-space through the variation of the curvature of the crystal slabs and therefore, it permits the optimization of the curvature of the monochromator and analyzer setting in order to achieve the best resolution with respect to the investigated sample.
Three-axis diffractometer setting
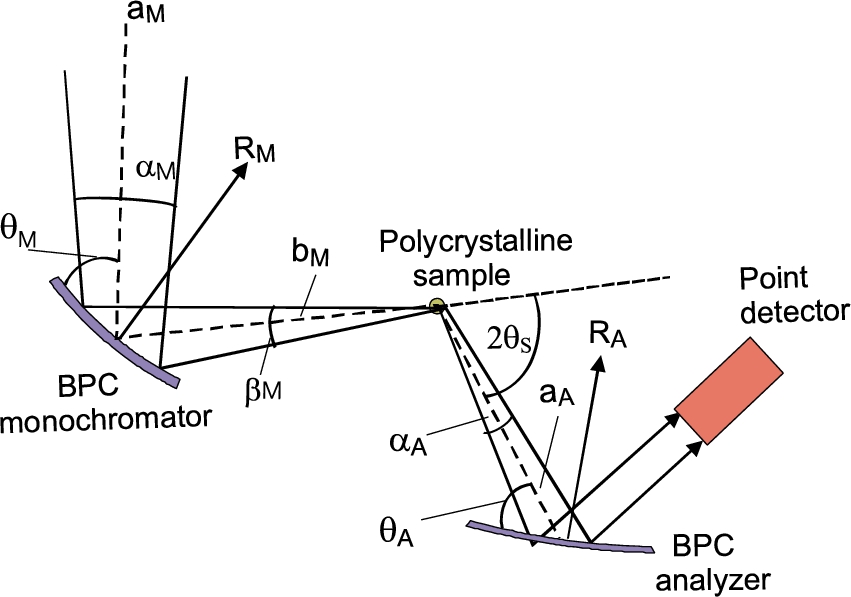
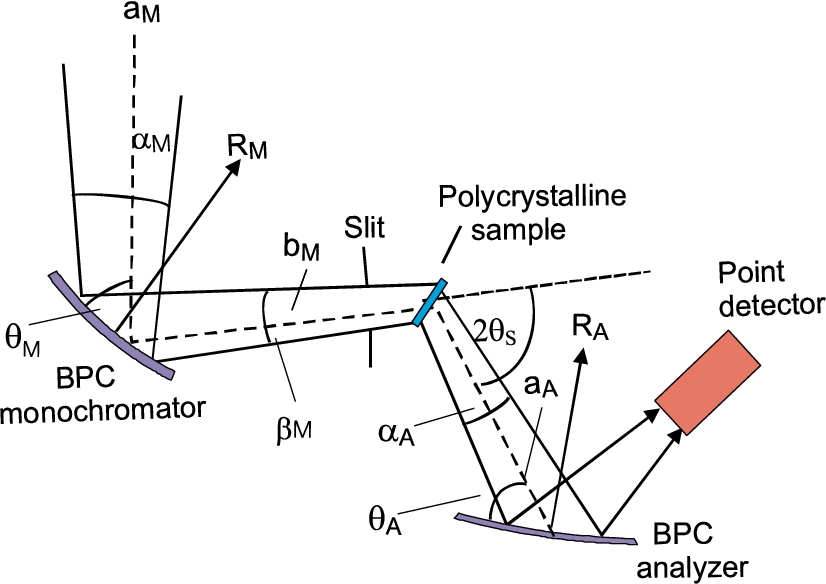
Schematic drawing of the three-axis diffractometer setting employing BPC monochromator and analyzer.
Following the schematic sketch displayed in Fig. 2, it can be expected that a maximum resolution from this arrangement can be achieved for minimum dispersion of the whole system. When treating it in momentum space, this means that the orientation of the domains (where the all k-vectors end) related to the monochromator and analyzer are matched to that of the sample. By neglecting the thickness of the crystal slabs as well as the diameter of the pin-sample, the diffraction conditions of the experimental setting shown in Fig. 2 can be easily expressed by means of the used geometry and the Bragg conditions related to the monochromator, polycrystalline sample and analyzer in the forms [16]:
where is the mean wavelength of the neutrons reflected by the monochromator and and describe the neutron wavelength distribution dependent on and between the monochromator and the sample (on the path ) and the sample and analyzer (on the path ). It means that the neutron beam is strongly correlated. and are the radii of curvature of the monochromator and the analyzer slabs, respectively, while and are related Bragg angles. The requirement for neutron passing through the whole system without necessity of rocking the analyzer results in condition . If
is fulfilled simultaneously, only neutrons of one wavelength pass through the system and we obtain the so called monochromatic focusing not depending on the sample Bragg angle . For
a general form for focusing in momentum space (not dependent on and ) which minimizes the dispersion between all elements can be derived as [16]
When fulfilling the condition (16) a maximum peak intensity and a minimum FWHM of the rocking curve obtained by rocking the analyzer can be expected. However, it should be pointed out that in many cases it is difficult to fulfil, namely, some geometrical parameters and some compromise can be found experimentally.
Experimental details
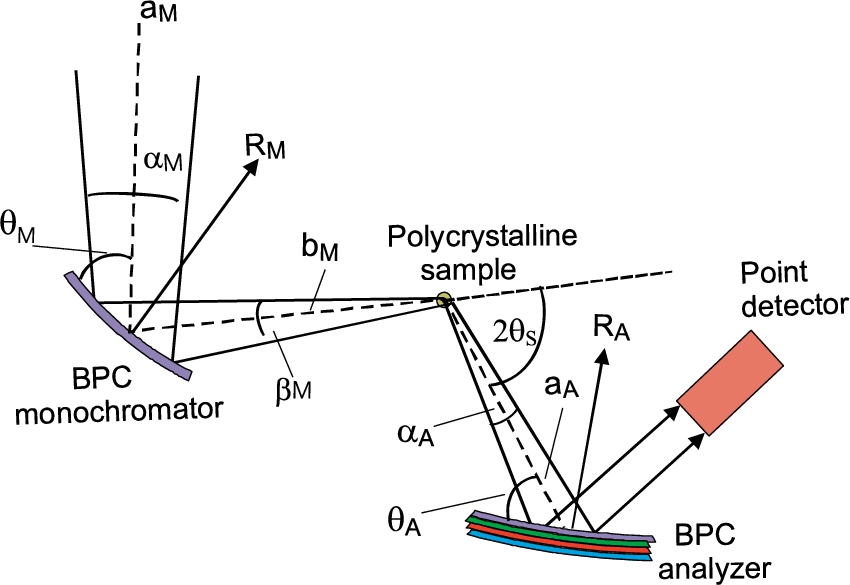
Schematic drawing of the configuration of the diffractometer setting as operating in NPI Řež.
For the experiment we used testing neutron optics diffractometer installed at the research reactor LVR-15 in Řež operating at the constant neutron wavelength of 0.162 nm which is provided by the BPC Si(111) slab (see Fig. 3). Si(111) slab having the planes (111) parallel to the main surface was of the dimensions of 200 × 40 × 4 mm3 (length × height × thickness) with a fixed radius of curvature of about 12 m. BPC analyzer was in the form of the sandwich of thin slabs Ge(111) + Si(220) + Ge(311) + Si(400) each of the dimensions of 200 × 40 × 1.3 mm3, which permitted an easy change of the analyzer and keeping e.g. the fully comparable curvatures. Small thickness of the individual slabs permitted us to bend the analyzer sandwich by a four-point bending device in a large range of curvatures. Moreover, thanks to a small thickness of the analyzer, an effective mosaic spread induced by the bending of the crystal slab and defined as , where is the thickness of the analyzer slab [9,12], has a negligible role in the resolution conditions. The monochromator – sample distance, , being 1.7 m and the sample – analyzer distance , being 0.5 m, were fixed. Two well annealed α-Fe standard polycrystalline samples of the cylindrical form and of the diameters of 8 mm and 2 mm were used which resulted in the irradiated sample volume of about 2 cm3 and 0.1 cm3, respectively. The diffractometer operates in the open beam mode without any Soller collimators. The aim of the experiment was to measure resolution and luminosity of the experimental setting on the basis of rocking curves of the analyzer slabs for both diameters of the sample and the α-Fe(211) and α-Fe(110) reflections at and , respectively. The following lattice parameters of the crystal slabs and the sample used in the setting were considered: Si(111) – , Ge(111) – , Ge(311) – , Si(220) – , Si(400) – , α-Fe(110) – and α-Fe(211) – . During the optimization procedure of the three-axis setting, in all cases of using the four-BPC-slab analyzers, rocking curves for different bending radii were first carried out. The rocking curves provided us with the luminosity of the three-axis setting and FWHM related to the angular resolution.
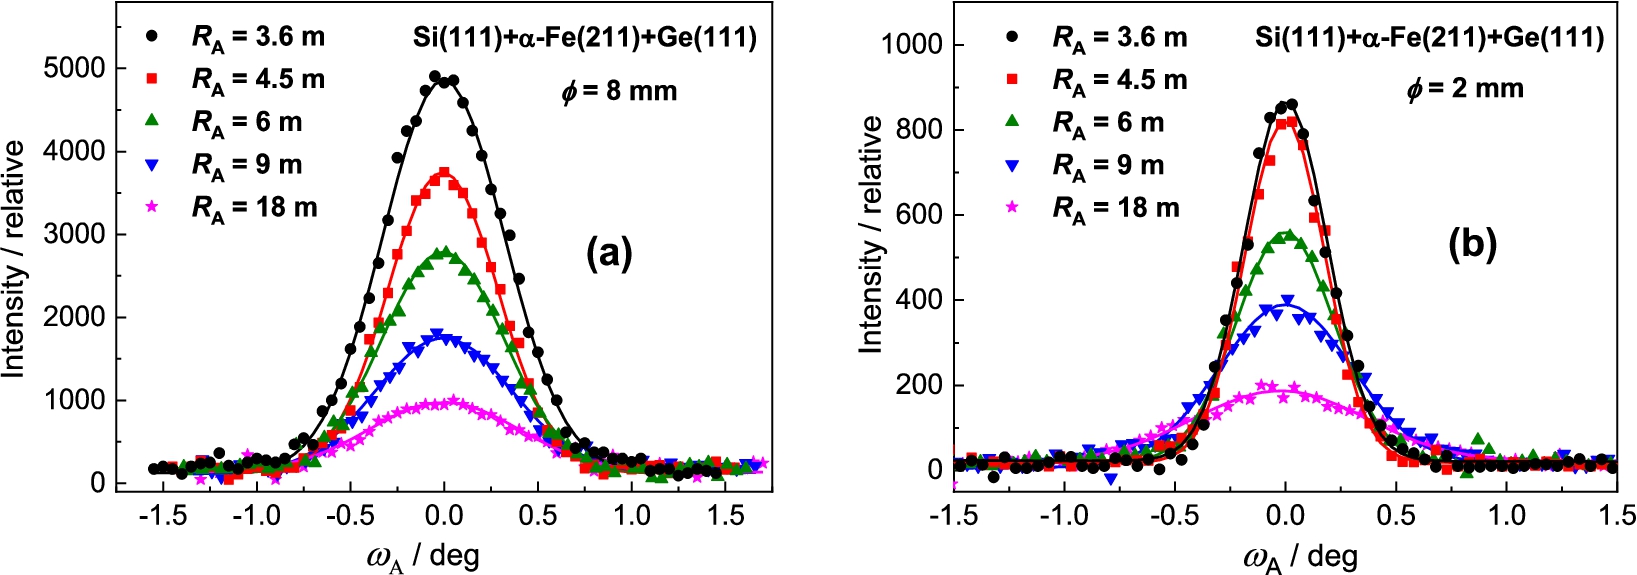
Analyzer rocking curves of the diffracted beam from the α-Fe(211) polycrystalline sample of – (a) and – (b) as analyzed by the Ge(111) BPC slab.
Experimental results for the α-Fe(211) sample reflection
Measurement results with the Ge(111) analyzer
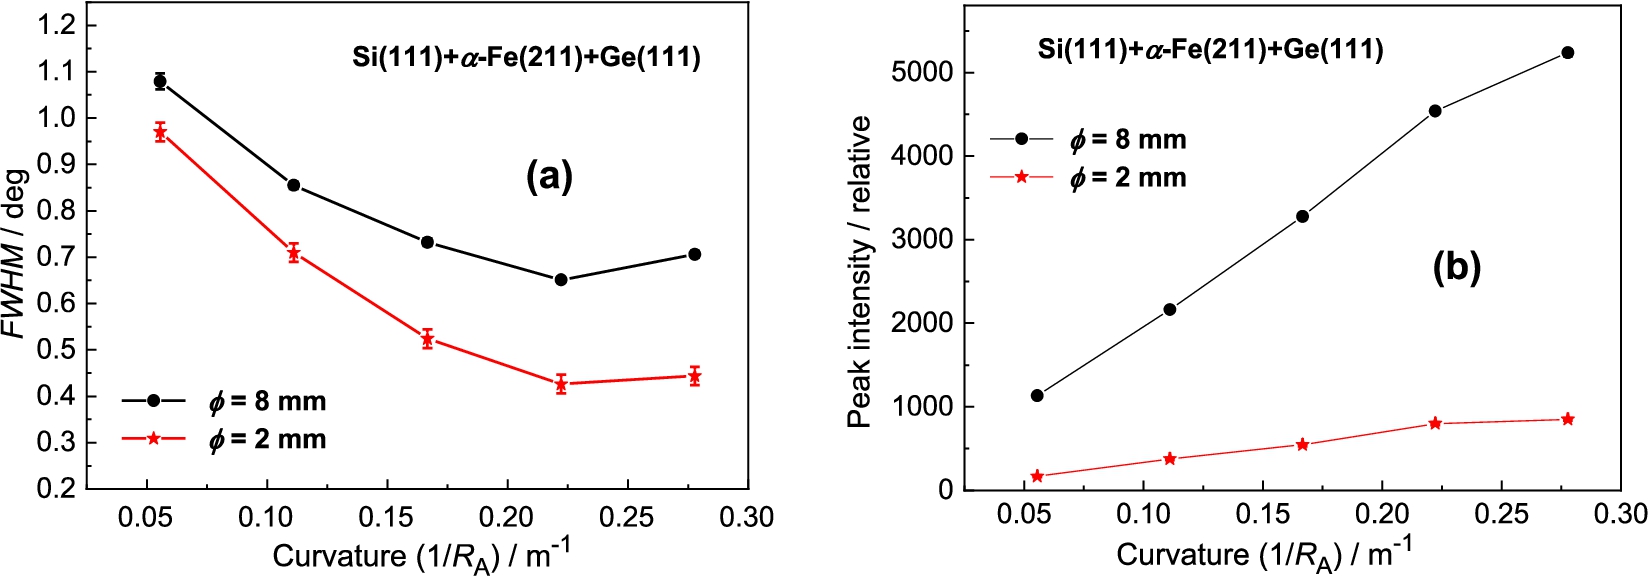
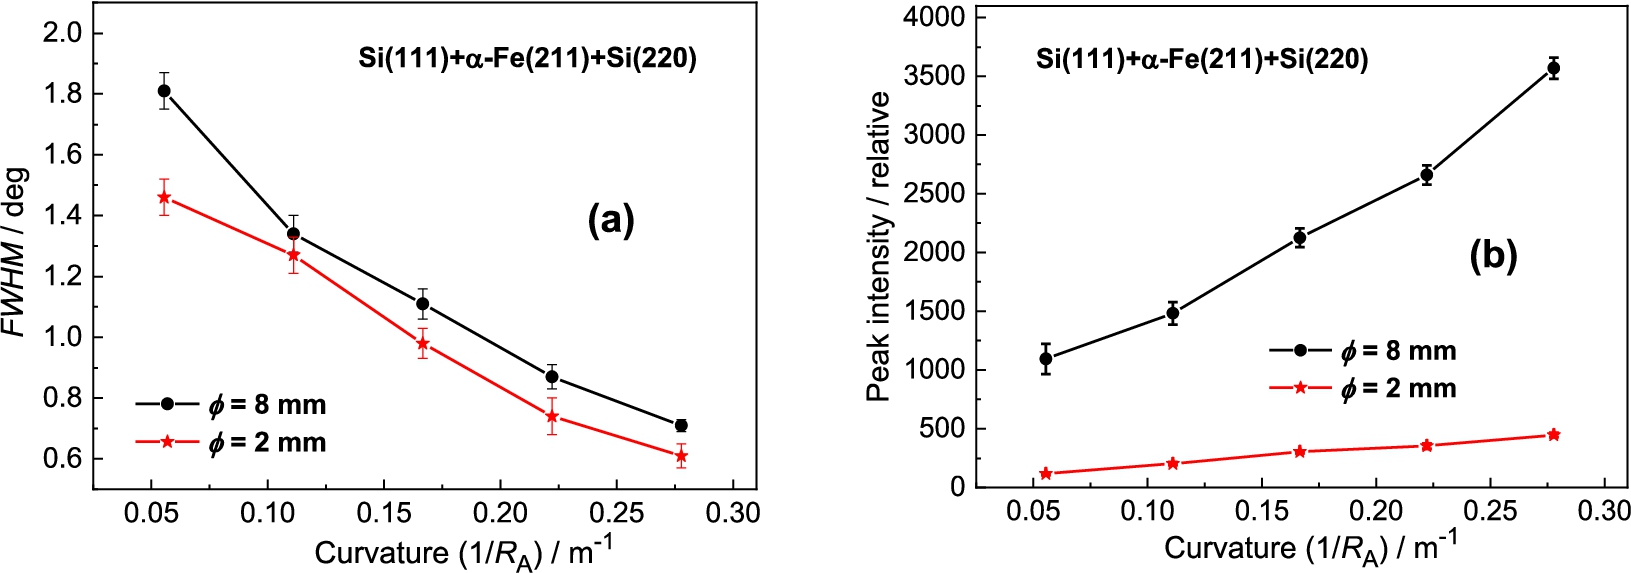
The dependences of FWHM – (a) and the peak intensity of the analyzer rocking curve on the analyzer curvature – (b).
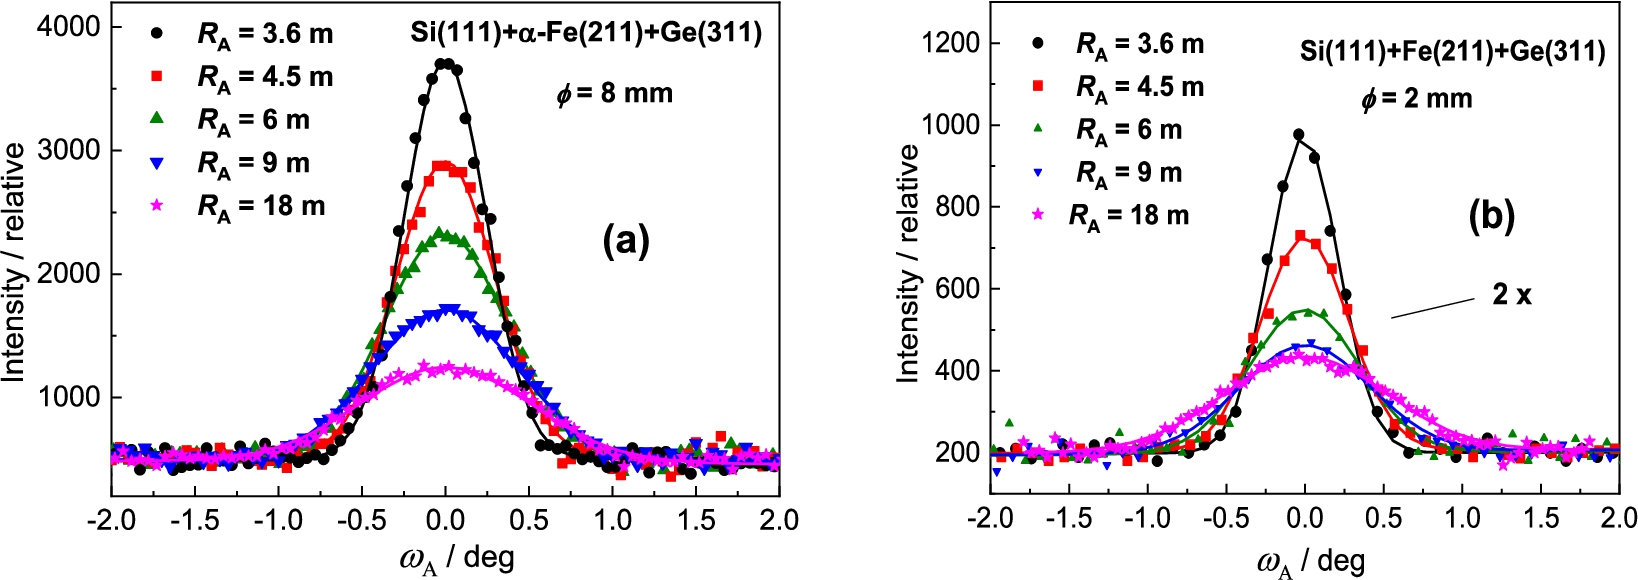
Analyzer rocking curves of the diffracted beam from the α-Fe(211) polycrystalline sample of – (a) and – (b) as analyzed by the Ge(311) BPC slab.
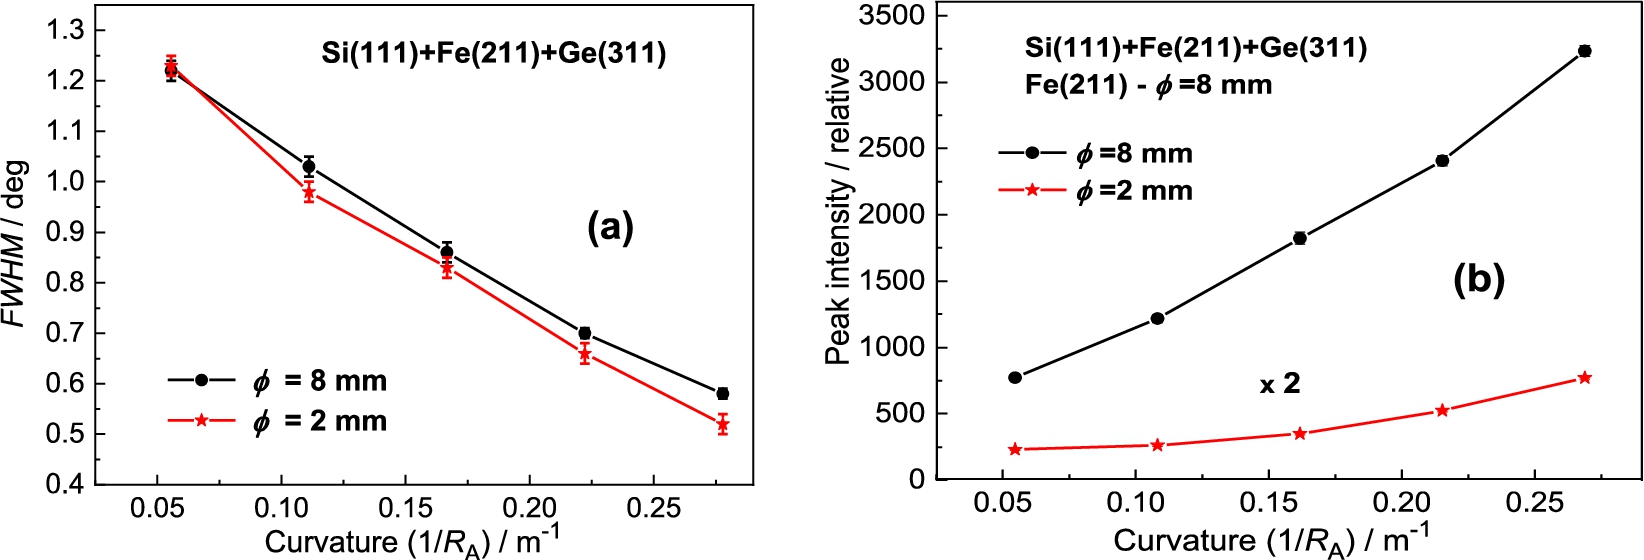
The dependences of FWHM – (a) and the peak intensity of the analyzer rocking curve on the analyzer curvature – (b).
Figure 4 shows the obtained results of analyzer rocking curves for the sample diameter of and . Inspection of the obtained results reveals that for the sample of the peak intensity is by a factor of 6.5 higher than in the case of the sample of while the ratio of FWHM is about 1.25. It is clear that from the practical point of view an exploitation of thicker samples in the experiments of this type could be more advantageous. Inspection of Fig. 5 reveals that the best resolution was obtained for the curvature of 0.22 m−1 accompanied by the peak intensity close to the maximum value.
Measurement results with the Ge(311) analyzer
In the next step, the Ge(311) analyzer was used (see Fig. 6). The principal difference in comparison with the previous setting consists in the fact that the value of the lattice distance with respect to is much closer to of the sample which could result in an improvement of the angular resolution of the three-axis setting. However, as can be seen from Fig. 7 it has not been confirmed within the range of analyzer curvatures. However, in comparison with the previous case, no minimum in the FWHM-dependence on the analyzer curvature was observed. Therefore, a further improvement of the resolution can be expected for larger curvatures above 0.27 m−1. It can be seen from Fig. 7 that the difference in FWHM for sample diameters of 2 mm and 8 mm is very small and an exploitation of thicker samples in the related experiments is naturally advantageous. It can also be seen from Fig. 6 that the best resolution was obtained for the limit curvature of 0.27 m−1. However, in our case, the range of the curvature was limited by the mechanical construction of the used bending device.
Measurement results with the Si(220) analyzer
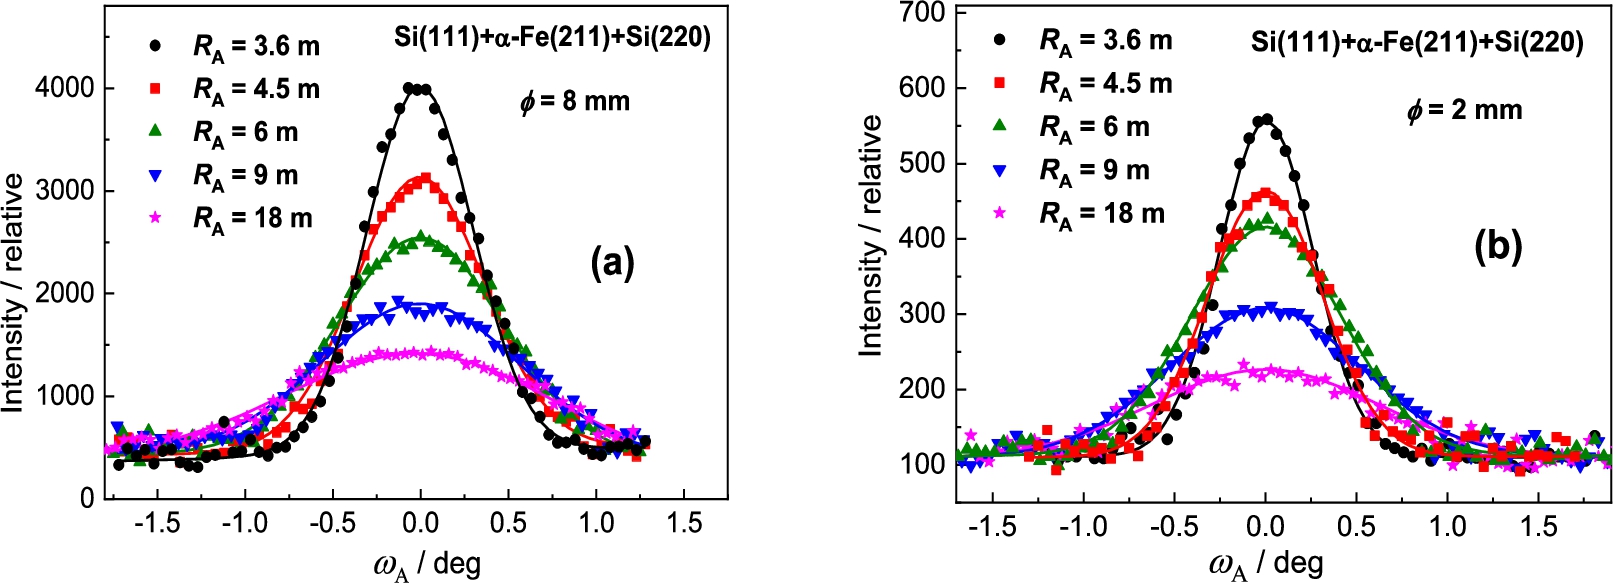
Analyzer rocking curves of the diffracted beam from the α-Fe(211) polycrystalline sample of – (a) and – (b) as analyzed by the Si(220) BPC slab.
The dependences of FWHM – (a) and the peak intensity of the analyzer rocking curve on the analyzer curvature – (b) related to the Si(220) slab.
In the next step the Si(220) analyzer was used (see Fig. 8). In this case of the setting with Si(220) BPC analyzer, the value of the lattice distance is lying between the values of and of the Ge-slab. Therefore, we can expect the resolution properties slightly worse. It was confirmed as can be seen in the following Fig. 9a. However, similarly to the Ge(311) analyzer, the difference in the peak intensity for the both samples is considerable (see Fig. 9b). In this way, it should be pointed out, that by using a Ge(220) slab instead of Si(220) one, there can be expected some increase of the luminosity of the three-axis setting because BPC Ge(220) slab has a higher reflection probability (usually called as peak reflectivity) than BPC Si(220) one [5,7,9].
Measurement results with the Si(400) analyzer
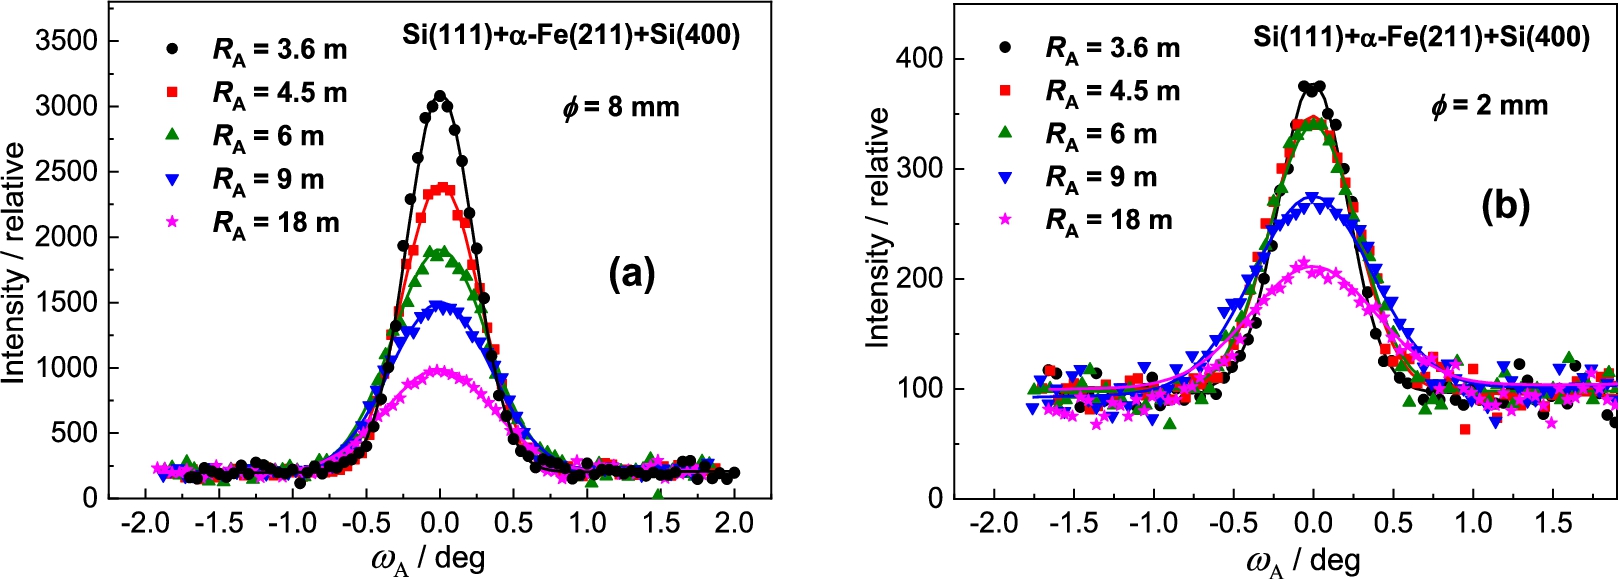
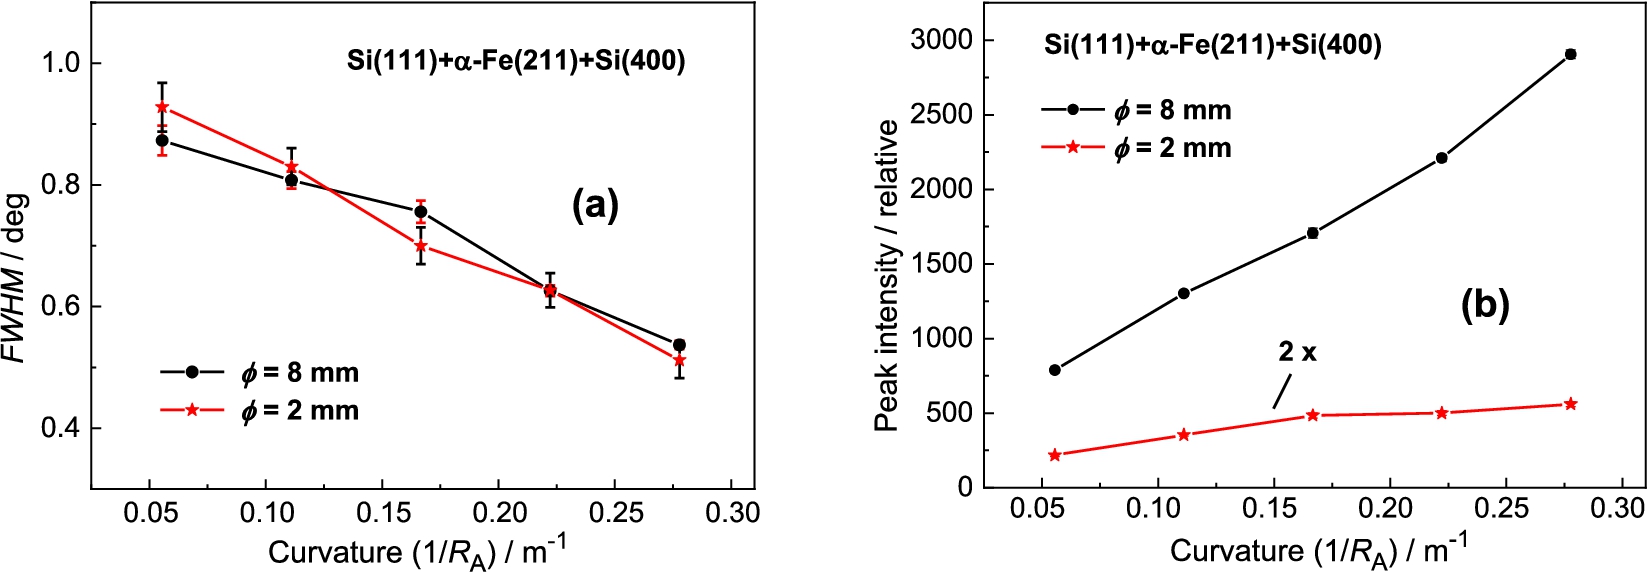
Finally, we have tested also BPC Si(400) analyzer, which in comparison with the previous BPC slabs has the shortest lattice spacing and its value is even closer to the lattice spacing of the α-Fe(211) sample. Figure 10 shows the related rocking curves of the BPC Si(400) analyzer and Fig. 11 shows the summarized luminosity and FWHM properties. Also, in this case no minimum value in the FWHM-dependence was reached and it could be expected that for larger crystal curvatures (above 0.27 m−1) the value of FWHM decreases below 0.5°. In the case of the sample of , it can be seen from Fig. 11 that the resolution represented by FWHM was practically not improved and moreover, the luminosity is rather poor. Therefore, some practical exploitation of the three-axis setting could only be for samples of larger diameters (dimensions). Also in this case it is valid that by using a BPC Ge(400) slab instead of Si(400) one, some increase of the luminosity of the setting can be expected, namely for strong curvatures.
Analyzer rocking curves of the diffracted beam from the α-Fe(211) polycrystalline sample of – (a) and – (b) as analyzed by the Si(400) BPC slab.
The dependences of FWHM – (a) and the peak intensity of the analyzer rocking curve – (b) on the curvature of the analyzer.
Experimental results for the α-Fe(110) sample reflection
As a continuation of the studies carried out on α-Fe(211) samples at the scattering angle of , in the next step, a similar optimization procedure was carried out on the α-Fe(110) sample reflection at the scattering angle of , where a higher luminosity and resolution can be expected.
Measurement results with the Ge(111) analyzer
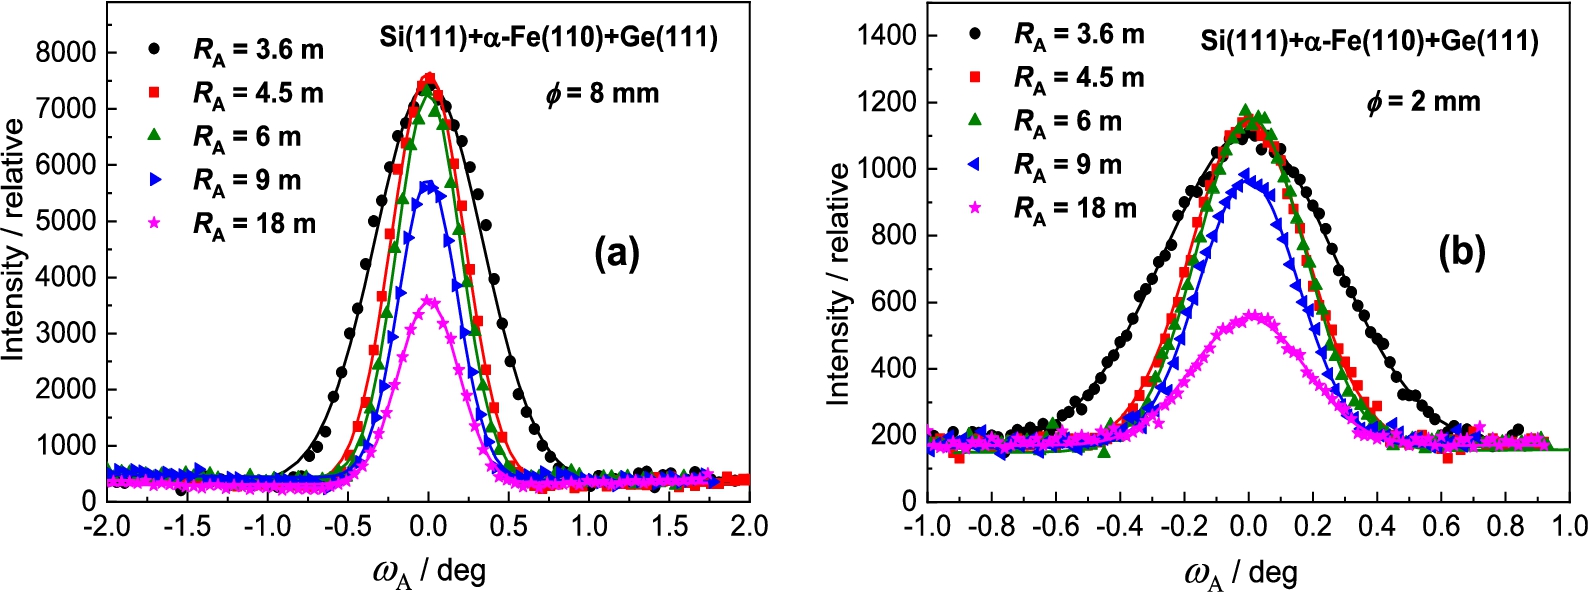
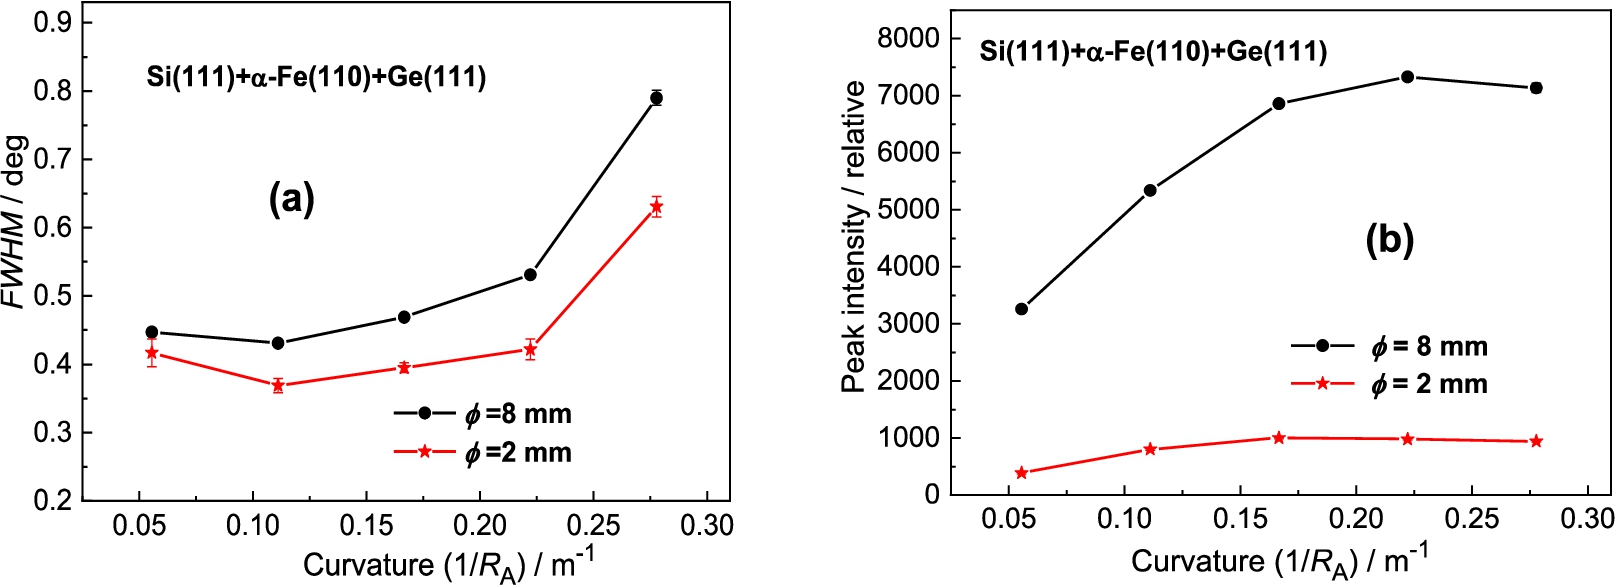
Figure 12 shows the obtained results of the analyzer rocking curves for the α-Fe(110) sample diameter of 8 mm and 2 mm and Fig. 13 shows the summarized luminosity and FWHM properties. The best resolution was observed for the curvature . Inspection of the obtained results reveals that for the sample of the peak intensity is about 6.5 higher than in the case of the sample of while the related ratio in FWHMs is only of about 1.25. It is clear that from the practical point of view the use of thicker samples in the real experimental studies would be more advantageous.
Analyzer rocking curves of the diffracted beam from the α-Fe(110) polycrystalline sample of – (a) and – (b) as analyzed by the Ge(111) BPC slab.
The dependences of FWHM – (a) and the peak intensity of the analyzer rocking curve – (b) on the curvature of the analyzer.
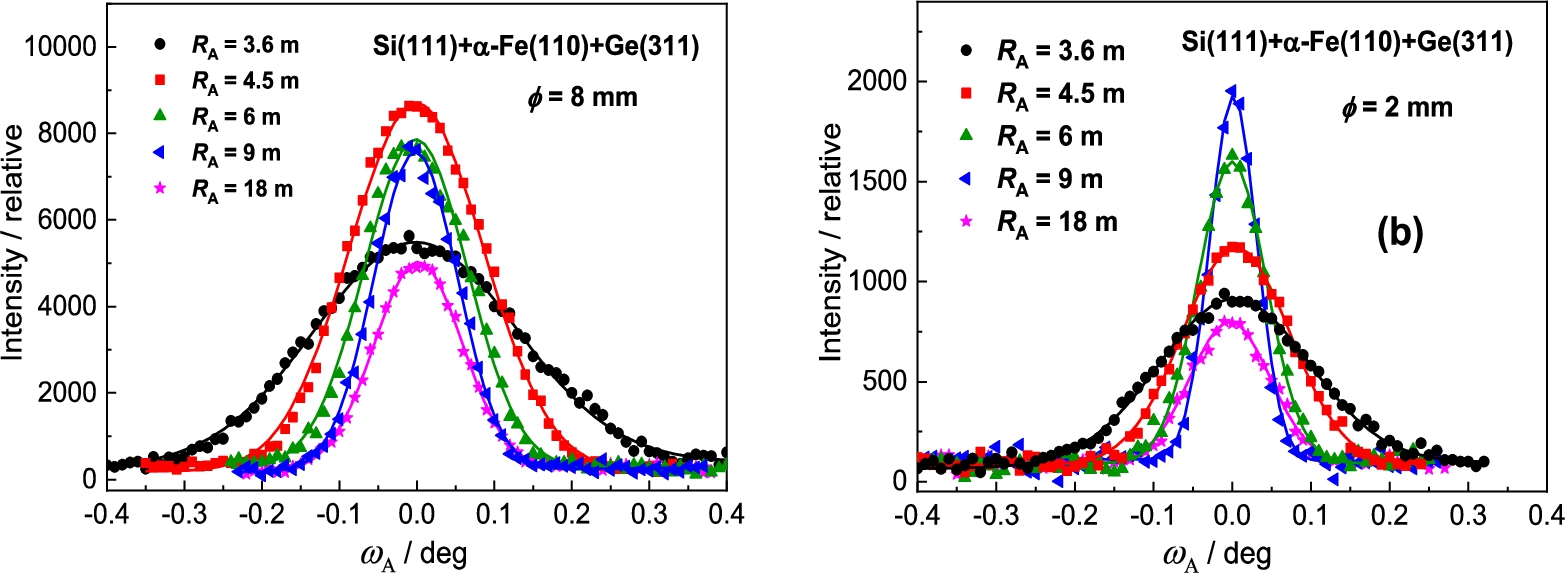
Analyzer rocking curves of the diffracted beam from the α-Fe(110) polycrystalline sample of – (a) and – (b) as analyzed by the Ge(311) BPC slab.
Measurement results with the Ge(311) analyzer
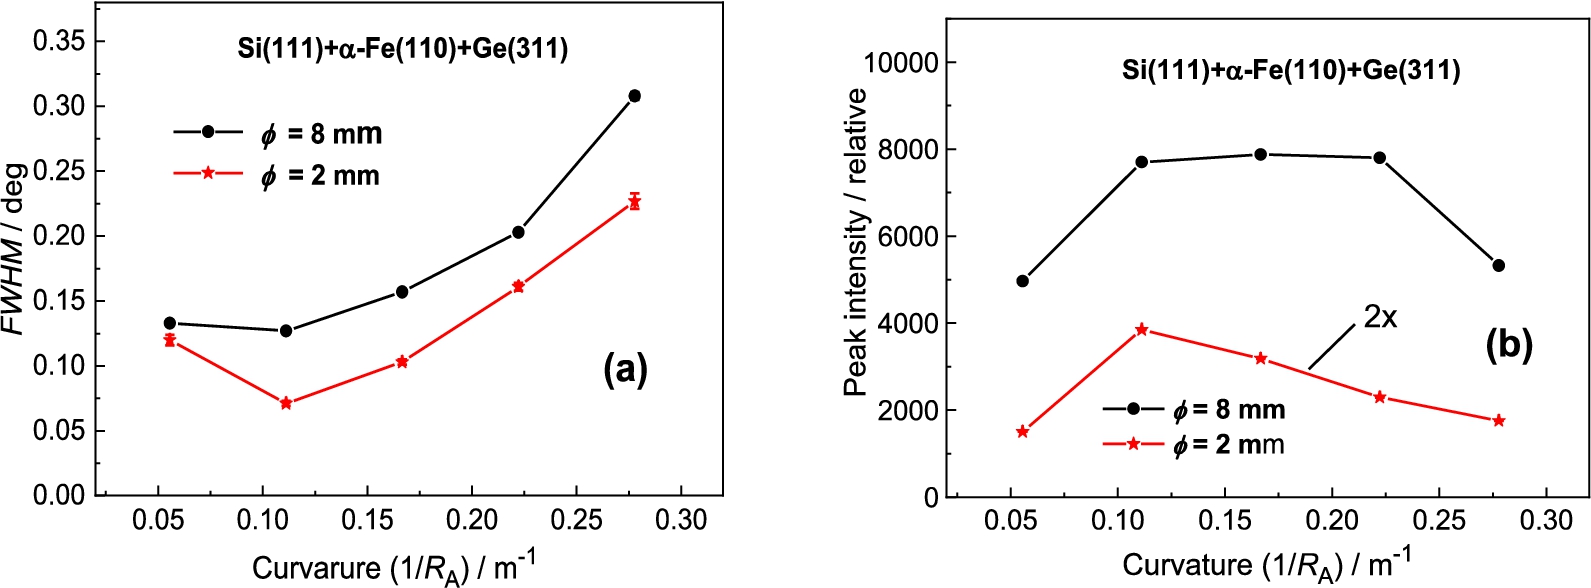
In this case of the Ge(311) analyzer (see Fig. 14), contrary to the previous Ge(111) one, the value of the lattice distance of Ge(311) is much closer to the of the sample which could result in improving the angular resolution of the three axis setting. It was really confirmed, as can be seen from the following Fig. 15. The best resolution was observed for the curvature . It can also be seen from Fig. 15 that the difference in FWHM for sample diameters of 2 mm and 8 mm is small and an exploitation of thicker samples in the related experiments is naturally advantageous.
The dependences of FWHM – (a) and the peak intensity of the analyzer rocking curve – (b) on the curvature of the analyzer.
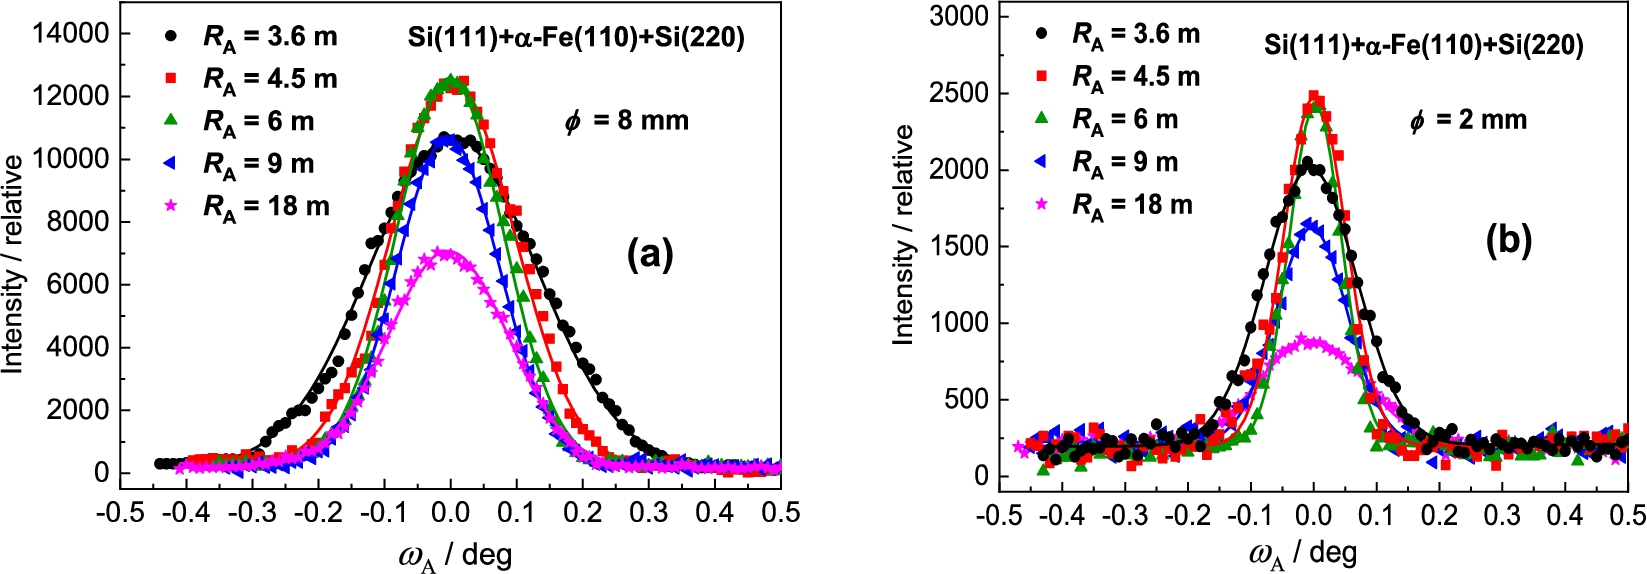
Analyzer rocking curves of the diffracted beam from the α-Fe(110) polycrystalline sample of – (a) and – (b) as analyzed by the Si(220) BPC slab.
Measurement results with the Si(220) analyzer
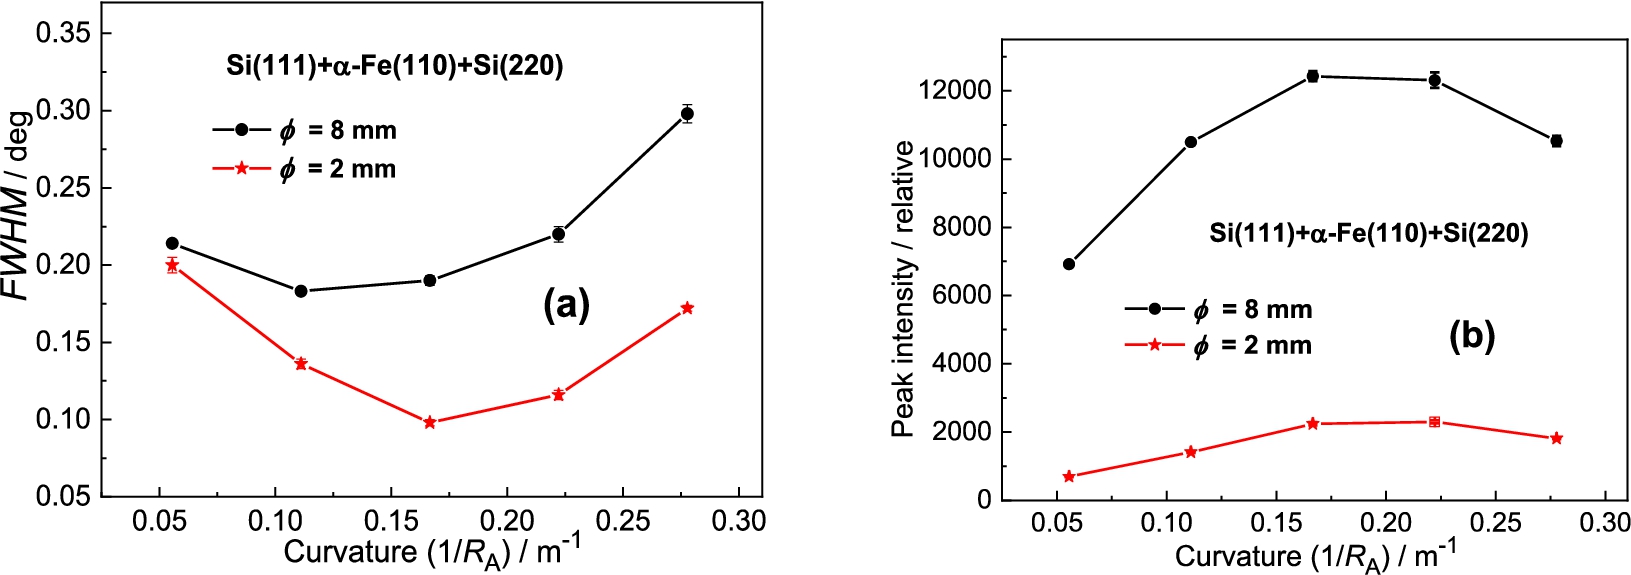
As a third analyzer the BPC Si(220) slab was used. In this case the lattice distance is lying between the values of and of the Ge-slab. Therefore, in comparison with the Ge(311) analyzer, we can expect slightly worse the resolution properties of the three-axis setting. It was confirmed and the related results are shown in the following Fig. 16 and Fig. 17. It can be seen from Fig. 17 that FWHM dependences have minima for the curvatures of about 0.17 m−1 and 0.11 m−1 for the sample of and , respectively.
The dependences of FWHM – (a) and the peak intensity of the analyzer rocking curve – (b) on the curvature of the Si(220) slab.
Measurement results with the Si(400) analyzer
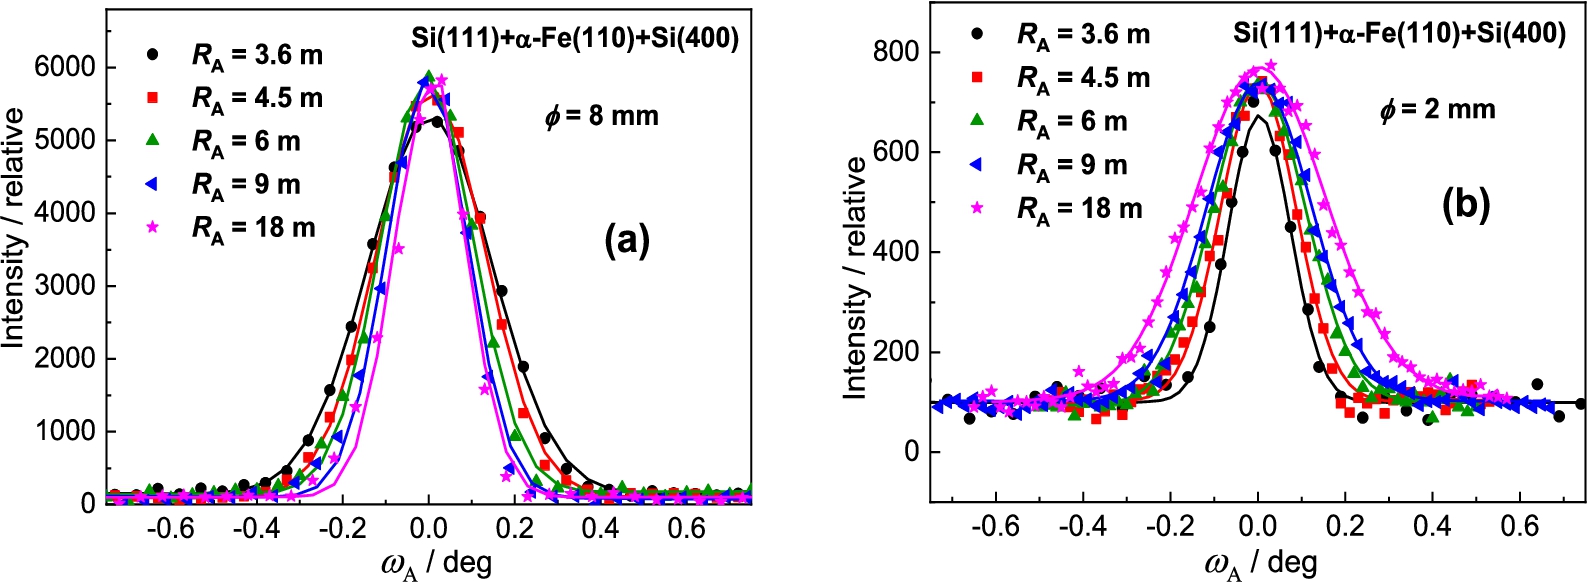
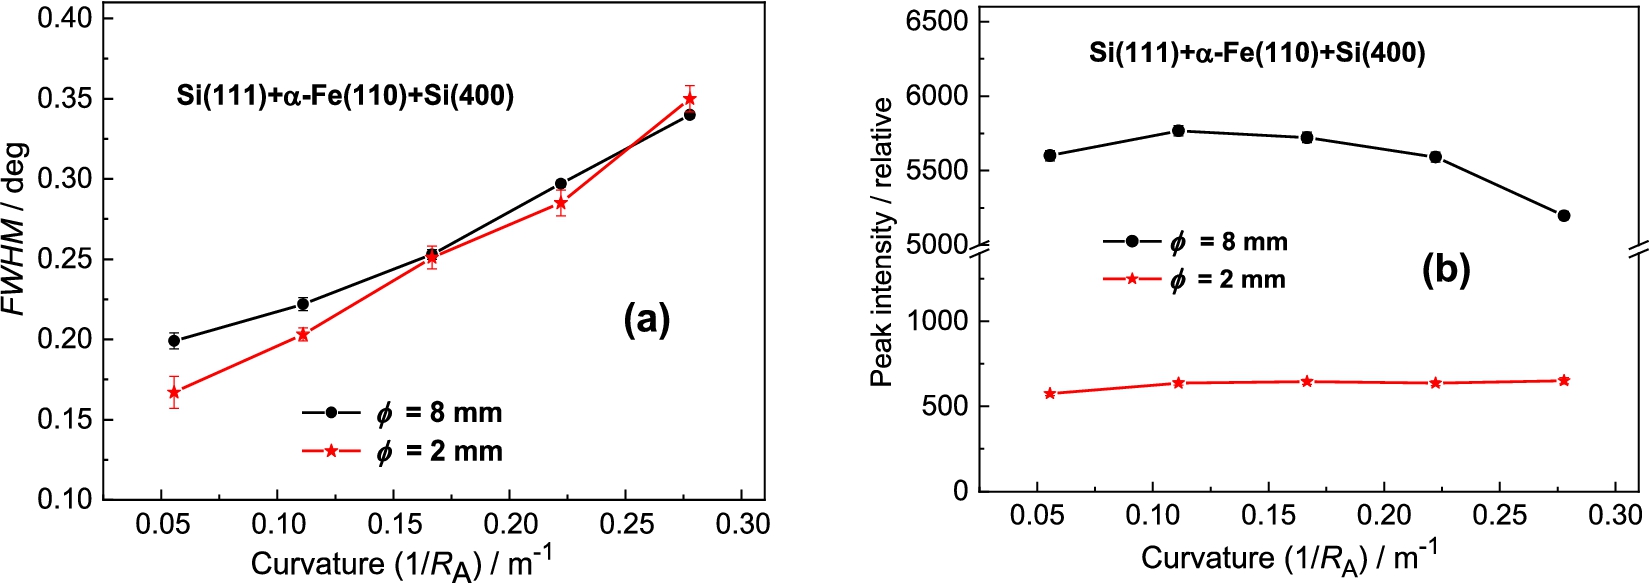
Finally, it was tested the BPC Si(400) analyzer, which in comparison with the previous BPC analyzer slabs has the shortest lattice spacing and the largest difference with respect to the lattice spacing of the α-Fe(110) sample. Similarly to previous tested analyzers, Fig. 18 and Fig. 19 show the related rocking curves of the BPC Si(400) analyzer and the summarized peak intensities and FWHM properties for the samples of the diameters of 8 and 2 mm. Inspection of Fig. 18 and Fig. 19 reveals that the peak intensity on the curvature is not significant and also a small difference of FWHM dependence for two diameters of the samples. It points out a possibility to use successfully the samples of larger diameters with a good enough resolution. In this case (see Fig. 19a) no minimum value in the FWHM-dependence was reached and a higher resolution could be expected by further relax of the curvature. However, it would not be practical in the experiment because the luminosity of the three-axis setting would decrease.
Analyzer rocking curves of the diffracted beam from the α-Fe(110) polycrystalline sample of – (a) and – (b) as analyzed by the Si(400) BPC slab.
The dependences of FWHM – (a) and the peak intensity of the analyzer rocking curve – (b) on the curvature of the analyzer.
Testing of bulk samples
Schematic drawing of the configuration of the diffractometer setting for a sample of a rather large width.
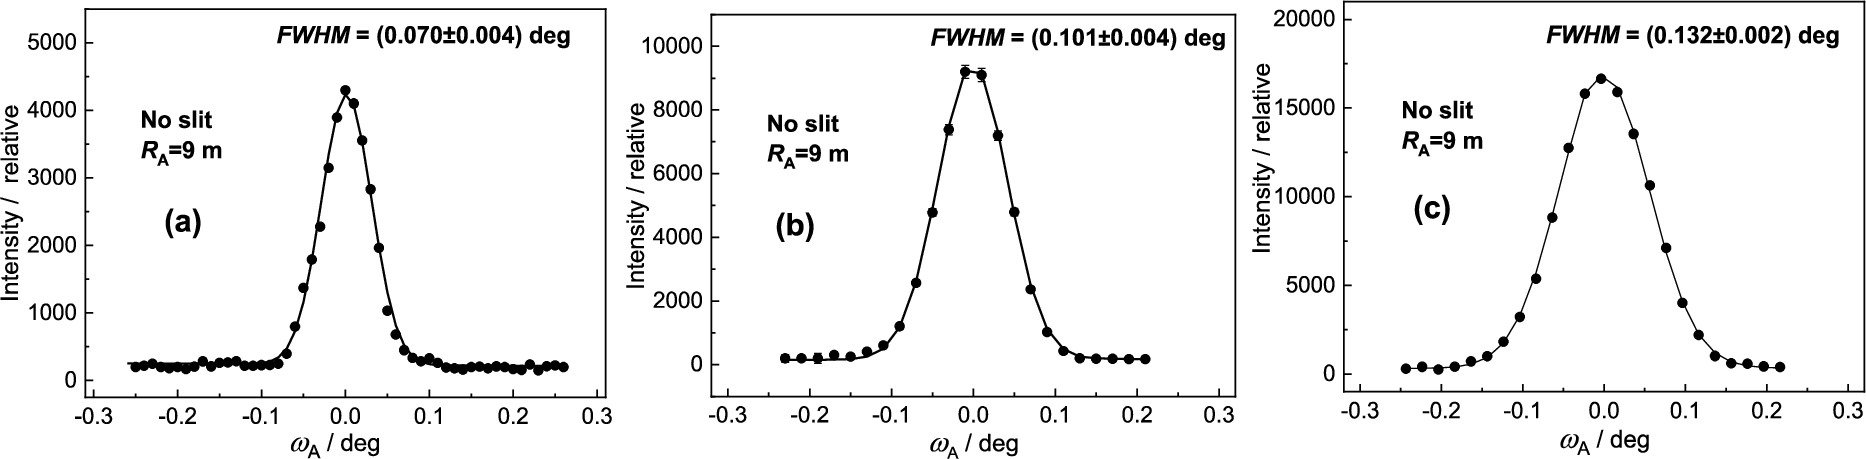
Ge(311) analyzer rocking curves for the standard α-Fe(110) cylindrical solids of three diameters situated in the vertical position: (a) – , (b) – and (c) – .
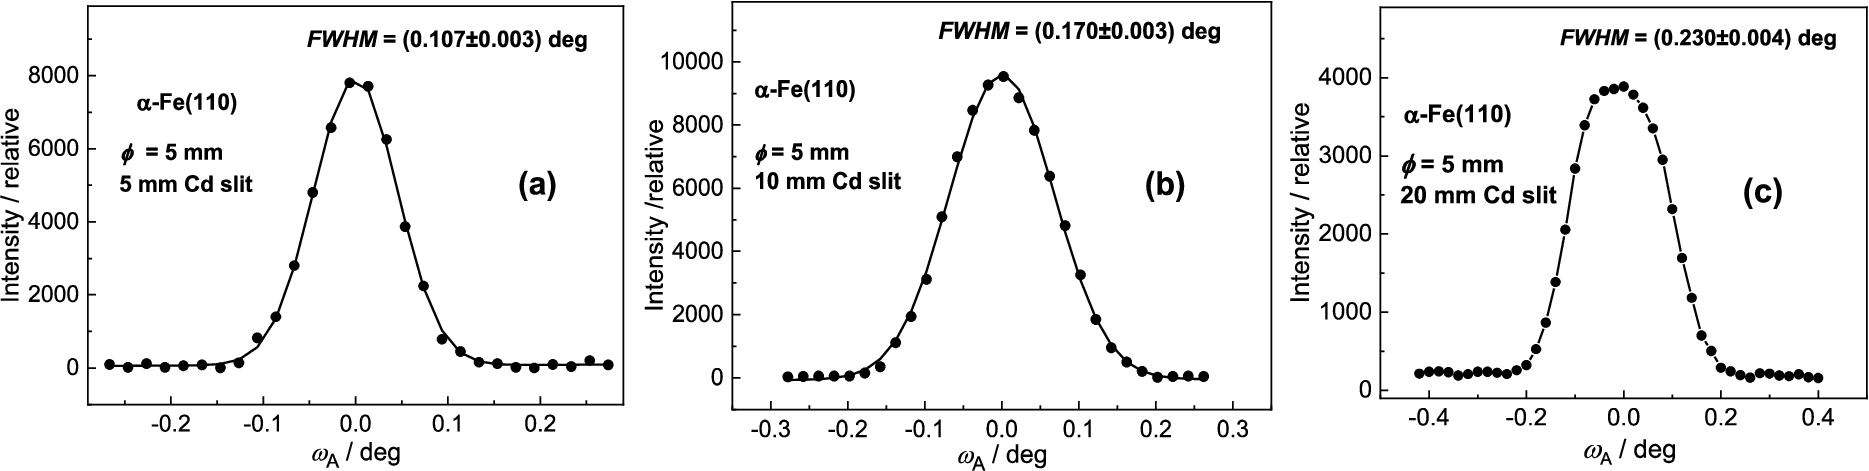
Ge(311) analyzer rocking curves related to the 5 mm standard cylindrical solid situated in the horizontal position for three widths of the slit and optimum analyzer curvature ().
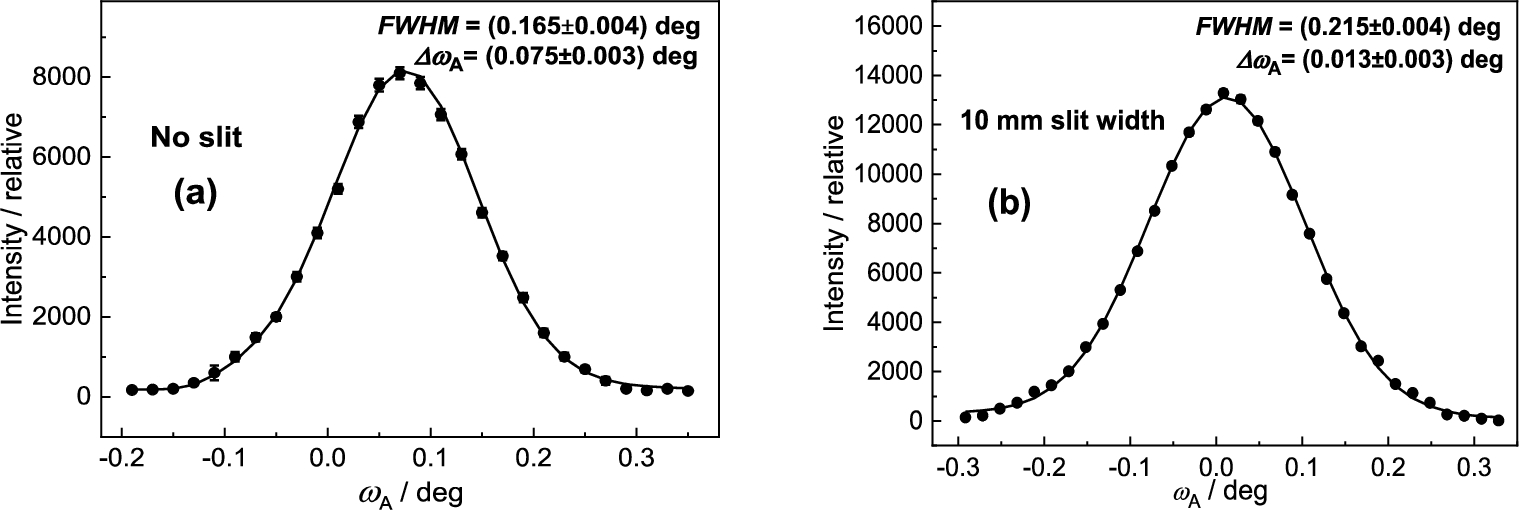
In the next section, some resolution properties of the three-axis setting on standard samples of large dimensions were investigated. In some cases, in addition to the results obtained with the cylindrical samples situated in the vertical position (see Fig. 2), for simulation of the larger width, cylindrical samples were situated in horizontal position (see Fig. 20). After choosing the best resolution, Ge(311) analyzer rocking curves related to α-Fe(110) standard samples of different diameters situated in vertical position for the optimum curvature of the analyzer slab were carried out as shown in Fig. 21. On the other hand, the next Fig. 22 shows the Ge(311) analyzer rocking curves related to 5 mm α-Fe(110) cylindrical solid situated in horizontal position for different widths of the slit limiting the monochromatic beam impinging the sample (see Fig. 20). Inspection of Fig. 22 reveals that the profile of the rocking curve ceases to be of the Gaussian form. However, the resolution is still sufficient for investigation of macrostrains based on the measurements of shifts even for 20 mm slit width. It is clear that in such a case of a large irradiated gauge volume, conventional double axis instrument would not be usable. Finally, Fig. 23 demonstrates the effect of plastic deformation on of the analyzer rocking curves. In this case, a 5 mm plastically deformed sample of the same material (Grade 08G2S GOST 1050) was tested. The virgin sample was submitted to shear deformation (23%) as well as to drawing deformation (23.2%). Figure 22 shows the rocking curves related to the deformed 5 mm cylindrical solid situated in vertical and horizontal position. When comparing Fig. 23a with Fig. 21a and Fig. 23b with Fig. 21b, the effect of plastic deformation on FWHM of the analyzer rocking curve, is evident, even for the sample of a 10 mm width. The rest elastic deformation (strain) brought about the shift of is also clearly seen.
Ge(311) analyzer rocking curves related to the same plastically deformed standard sample situated in the vertical – (a) and horizontal position – (b).
Three axis alternative employing PSD
Three-axis diffractometer alternative with the fixed position of the analyzer in combination with the PSD detector for vertical – (a) and horizontal – (b) positions of the polycrystalline sample.
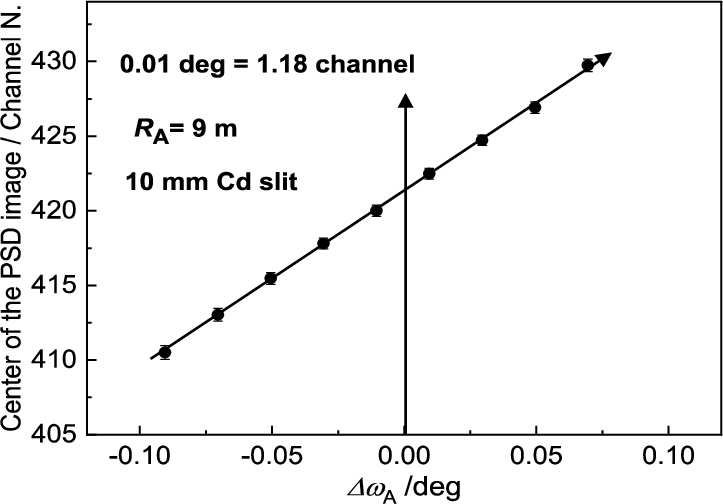
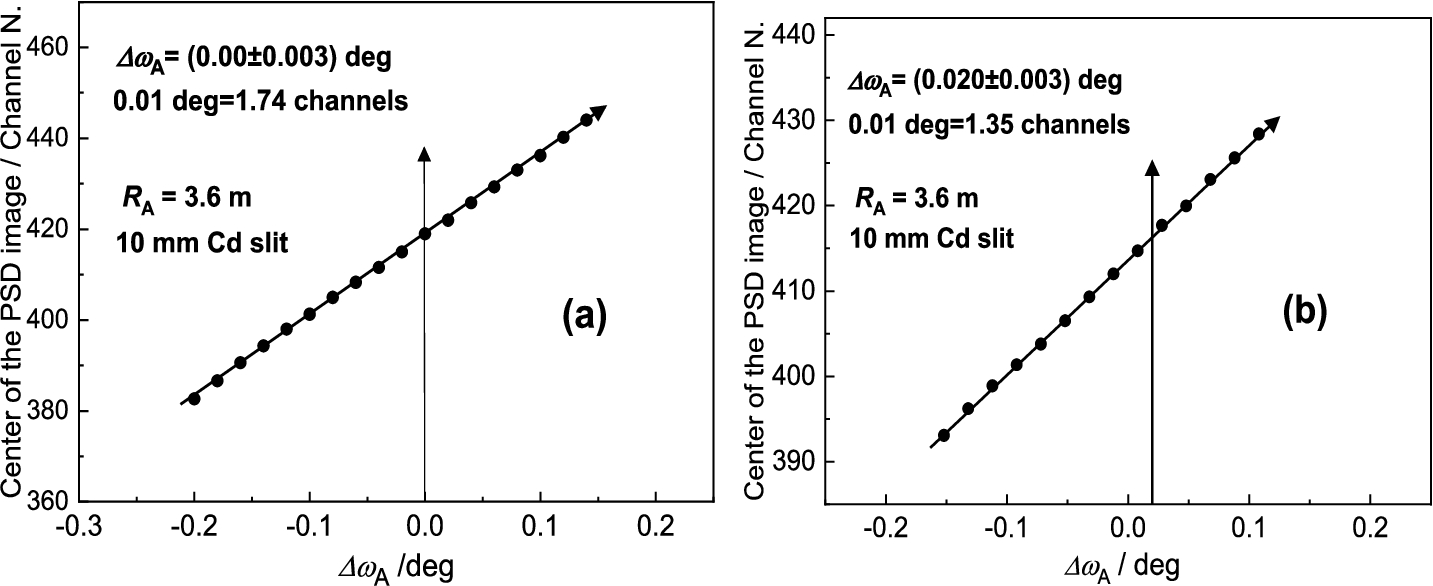
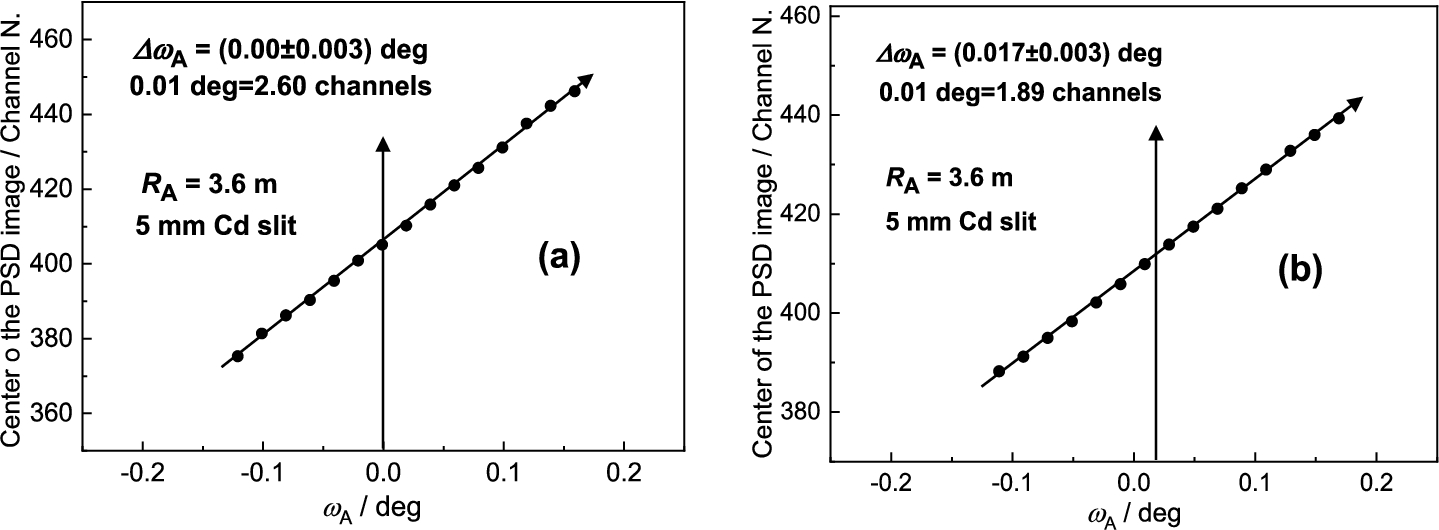
It has been found that for each point of in the close vicinity of the peak position of the rocking curve, the diffraction profile imaged by the PSD linearly shifts in correspondence with the change of the scattering angle (see Fig. 24). In fact, the shift of the diffraction image is connected just with the value of . The range of linearity depends on of the rocking curve. Figure 25 shows an example of this linear dependence which can be used for calibration of against the center position of the diffraction image in the PSD which can be applied in the vicinity of the peak position of the analyzer rocking curve (). It comes from the fact that the strain in the sample changes the scattering angle by a value . The corresponding bunch of neutrons impinges the analyzer at some deviation and is diffracted at the deviation . Naturally, it results in a shift of the PSD image of the diffraction profile with respect to the strain free position (). As usual the strains bring about a smaller effect than the -span of the calibration function and therefore, it can be used for macro-strain scanning as e.g. in the samples subjected to a thermo-mechanical load. Furthermore, it has been found that the strain resolution derived from the calibration function depends on the curvature of the analyzer as well as the width of the slit for the incident beam on the sample situated in the horizontal position. These properties are documented in Figs 26 and 27 for the radius of curvature and the widths of the slit of 10 mm and 5 mm, respectively. However, as can be seen, it has practically no effect on the determination of the elastic strain observed in the deformed sample (compare values from Figs 26b and 27b). Nevertheless, the change of the line inclination due to the plastic deformation deserves further studies. For evaluation of the obtained data in our case it is possible to use simple formulae for large values of and for smaller values of from which the change of the lattice spacing of the sample can be determined by means of the relation .
Linear calibration function as taken for the standard sample in horizontal position.
Linear calibration functions as taken for the standard sample – (a) and the deformed one – (b) both in the horizontal position for .
Linear calibration functions as taken for the nondeformed standard sample – (a) and the deformed one – (b) both in the horizontal position and for width of the Cd slit of 5 mm.
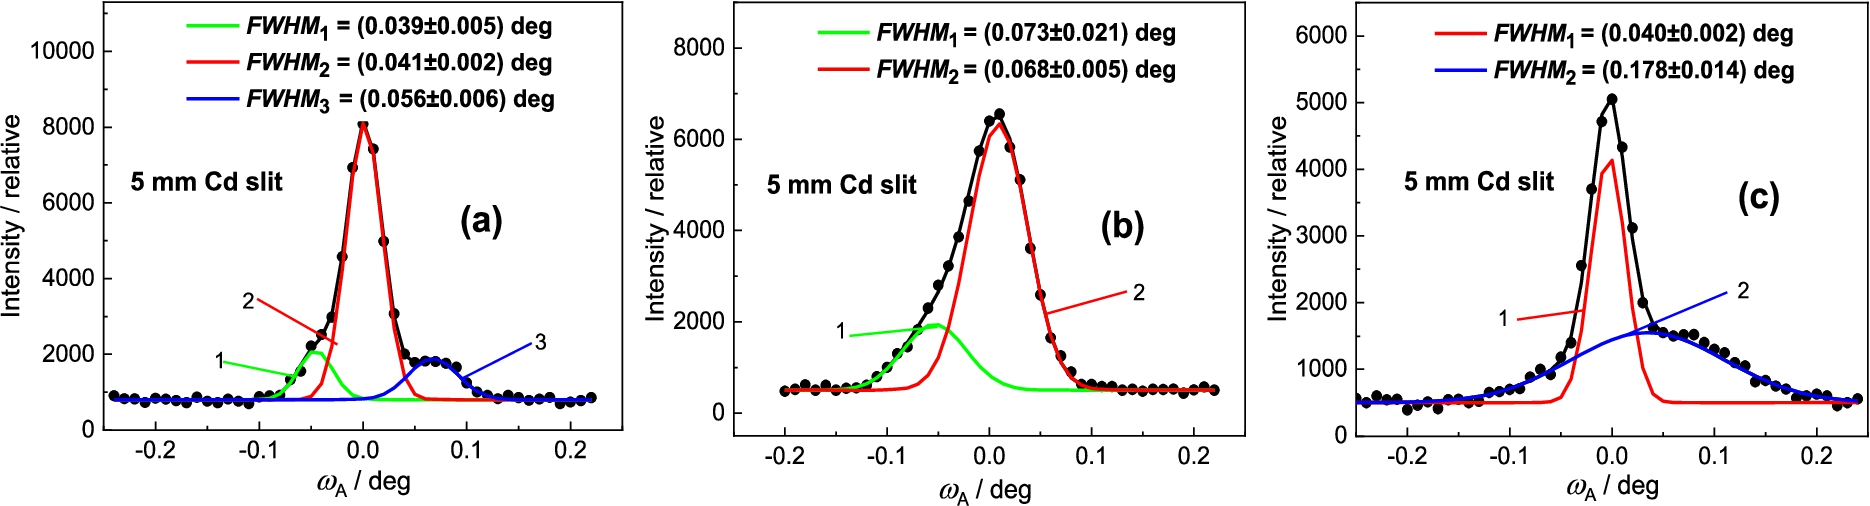
Analyzer rocking curve related to the wrought – (a), SLM – (b) and wrought-aged – (c) samples of Inconel 718.
Some experimental results
High-resolution of the setting was used for studying special material research tasks e.g. determination and volume content of different material phases having very close values of lattice spacing [1,10]. In this case we used several samples of Inconel 718 of the dimensions of 2 × 7 × 18 mm3 situated on the diffractometer in the vertical position. Figure 28 shows several results obtained on the wrought, SLM (selective laser melting) and wrought–aged samples of Inconel 718. The inspection of Fig. 28a reveals that the main maximum (the red line 2) corresponds to the γ phase of the matrix while the small maxima at the shoulders correspond to the separated (green line – 1) and (blue line – 3) phases, respectively. Then, Fig. 28b reveals that the main maximum (the red line – 2) corresponds to the γ phase while the small maximum at the shoulder (green line – 1) corresponds to the phase. On the other hand, Fig. 28c shows that together with the main γ phase (line – 1), there is a considerable contribution of a mixture of and phases (blue line – 2).
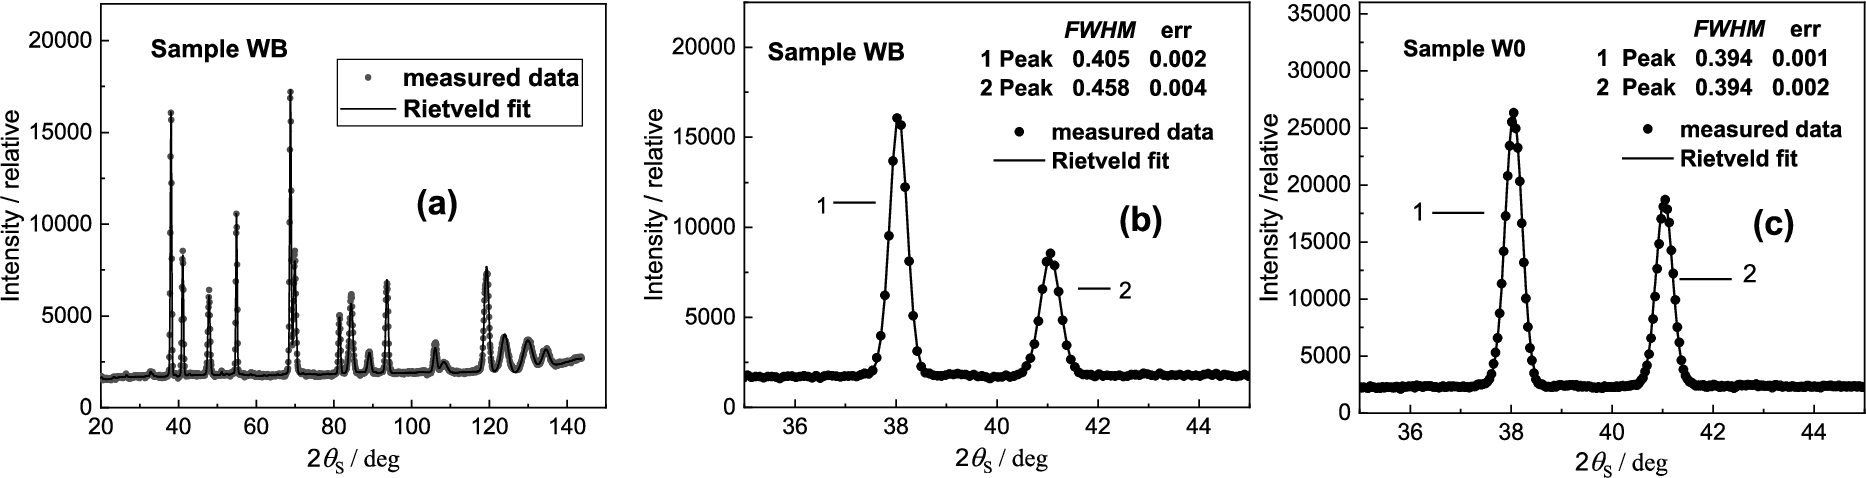
Powder diffraction spectrum for the sample WB – (a), the cut part of it for smaller scattering angles – (b) and the cut part related to the reference sample W0; 1 – W matrix (BCC structure, 2 – NiCo2W phase (FCC structure).
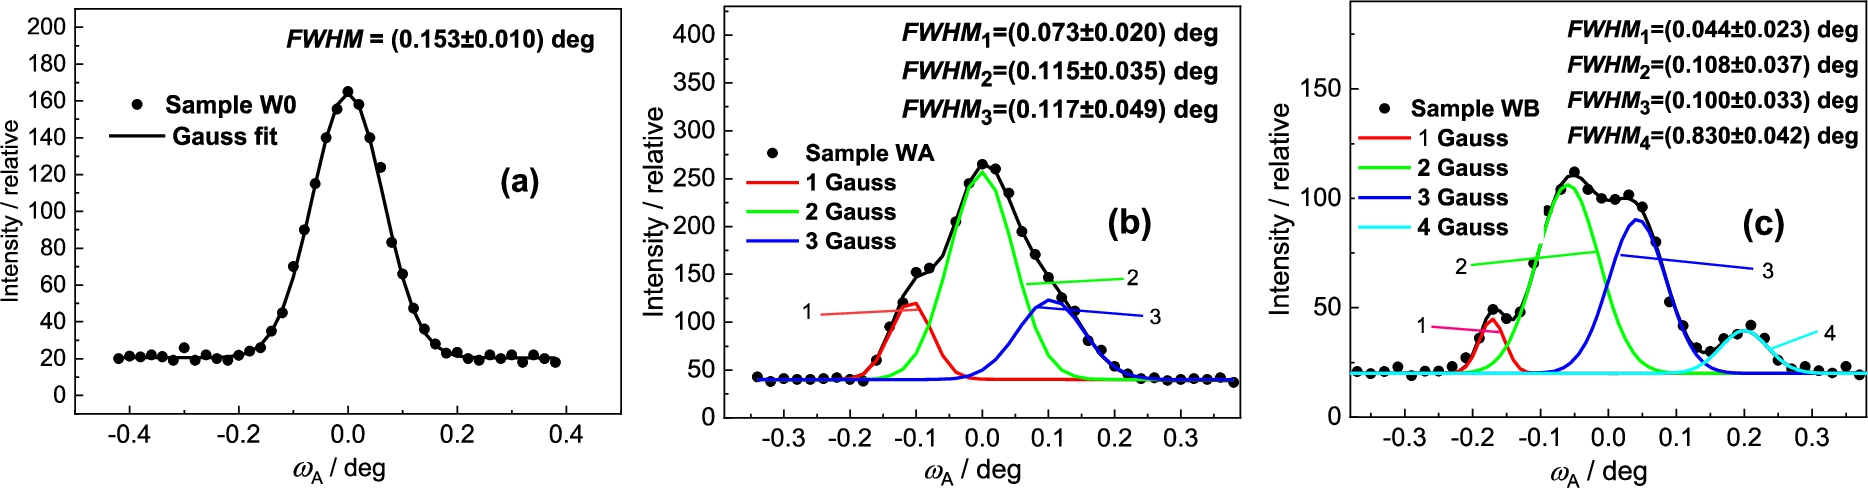
Next Figs 29 and 30 show the results obtained on the samples of the W-Ni-Co (93-6-1) wt.% (80.9-16.4-2.7 at. %) pseudo-alloy which was produced by powder metallurgy. The particle size of initial W, Ni and Co powders was in the range of 2–4 μm. The weighted mixture of the powders was homogeneously mixed and then sintered at 1500°C under H2 protective atmosphere, and subsequently quenched in water. The as-sintered material, i.e., bars with approximately 12 × 18 mm2 elliptical cross- sections, is denoted as W0 throughout the following text. The sintered bars were further processed by rotary swaging (RS) into circular swaged bars with a diameter of 10 mm. RS was performed in two different ways: At room temperature (sample WA) and at 900°C (sample WB). For the sake of comparison, we have reprinted from the paper [15] the whole powder diffraction spectrum shown in Fig. 29a and cut out first two peaks related to the samples WB and W0 as shown as Figs 29b and 29c. In our case, we focused our attention to the peak N.2 and analyzed it by the high-resolution setting. The obtained results are shown in Fig. 30. The detailed inspection of the analyzer rocking curves reveals that in the case of WA and WB samples, after the swage deformation a fine substructure was identified which was earlier not detected by using the conventional medium-resolution powder diffractometer.
Analyzer rocking curves analyzing the peak N.2 from Fig. 29 for all three samples of the NiCo2W phase (FCC structure).
Conclusion
Resolution properties of the three axis settings employing BPC monochromator and four different analyzers with the α-Fe(211) and α-Fe(110) polycrystalline standard samples between them were tested on the NPI neutron optics diffractometer. Then, the feasibility of using such setting for investigation in some special cases of bulk samples requiring a higher resolution than conventional instruments is presented.
Inspection of the obtained results related to the α-Fe(211) polycrystalline sample reveals the following general tendencies (see Section 4): Taking into account the limitation that only one BPC-Si(111) monochromator was used, the maximum luminosity of the setting related for α-Fe(211) reflection is provided by the Ge(111) analyzer having the largest value of the lattice spacing d. When comparing individual analyzers, the minimum achieved resolution does not differ considerably. As can be seen from the formula (6), the resolution represented by FWHM of the analyzer rocking curve depends on many parameters, where other parameters, namely, the thickness of the monochromator and the analyzer slabs and the dimension of the sample are not included. For optimization incorporating all free parameters, Monte Carlo simulations are recommended [14]. The resolution for the Ge(111) analyzer shows a minimum in the vicinity of , however, for the Ge(311), Si(220) and Si(400) analyzers there is a tendency that it can still be improved by applying a stronger curvature above 0.27 m−1, which was in our case inaccessible because of mechanical limitation of the construction of the bending device. It should be mentioned, that stronger curvatures of the analyzers imply a decrease of the reflection probability r of neutron fulfilling the Bragg condition in the analyzer crystal (resulting in a decrease of the peak intensity of the diffraction profile) which for the cylindrically bent crystal is defined as [5,9], where Q is the kinematical reflection power. Therefore, from the point of the crystal reflectivity, Ge-BPC slabs would be more efficient than the Si-BPC slabs, however, the latter ones permit much larger curvatures than the Ge-BPC slabs which are more brittle. It can also be seen from the obtained resolution dependences that the diameter of the sample did not play a considerable role in the measurements of the resolution represented by FWHM. It opens a possibility to use the samples even with a larger diameter. It can be stated that the focusing in momentum space by fulfilling the relation (6) could not be fully realized in this case, however, the setting could profit from a higher luminosity due to a small take-off angle of the bent Si(111) monochromator. The minimum reached FWHM of the rocking curves was in the range from 0.5° to 0.6° the values of which can be considered as good for a practical experimental use for the scattering angle close to 90°. The following best values of FWHM were obtained: 0.651 deg – and 0.43 deg – for Ge(111) analyzer; 0.58 deg – and 0.52 deg – for Ge(311) analyzer; 0.71 deg – and 0.61 deg – for Si(220) analyzer; 0.54 deg – and 0.51 deg – for Si(400) analyzer. Considering that the BPC analyzes the range of the beam scattered by the sample and no collimators were used, the luminosity of the three- axis setting can be considered as very good.
As expected, in comparison with previous cases using the α-Fe(211) sample, the three axis settings with the α-Fe(110) sample appear to be much more luminous as well as providing considerably better angular resolution FWHM because they exploit much more simultaneous focusing in real and momentum space (see Section 5). In this case the lattice spacing of α-Fe(110) is much closer to those of analyzer crystals, namely, of the Ge(311) and Si(220) ones. It can also be seen from the related figures that contrary to the previous experiment with the α-Fe(211) sample the best resolution for each setting is situated within the range of the analyzer curvatures, namely, for smaller curvatures which is also expected from relation (16). Therefore, some increase of the luminosity of the setting can be achieved by using a thicker crystal analyzer up to 4 mm. The following best values of FWHM were obtained: 0.41 deg – and 0.37 deg – for Ge(111) analyzer; 0.13 deg – and 0.07 deg – for Ge(311) analyzer; 0.18 deg – and 0.10 deg – for Si(220) analyzer; 0.20 deg – and 0.17 deg – for Si(400) analyzer. Thanks to the much higher resolution, the dependence on the sample diameter is in this case more pronounced. It can be said that the resolution obtained with the Ge(311) analyzer is remarkable.
Section 6 documents the feasibility of the three-axis setting for some high-resolution studies of the bulk samples of a rather large width which was simulated by different slit widths. Even for 10 mm slit width the slightly relaxed resolution is still sufficient for a possible application of the analysis of diffraction peak profiles influenced e.g. by plastic deformation [2,4,8]. In comparison with the conventional 2-axis set-up, this alternative instrument could be successfully applied, namely, in the strain/stress measurements in bulk samples exposed to an external load, e.g. in tension/compression rig, in aging machine etc. when the whole powder diffraction spectrum is not required and the position of the sample is fixed. Thus, it provides average strain values over a large irradiated volume. Otherwise, for comparison of different samples an attention should be paid to keeping the central point of the irradiated gauge volume in the same position with a high accuracy to avoid an additional shift error to as well as to . Of course, that the presented setting can also be used for macro-strain scanning, but due to the step-by-step analysis with the analyzer, the measurement would be rather time consuming.
On the other hand, Section 7 shows the way for reducing the principal drawback of the wider use of the setting for experimental investigations, which is namely, the time-consuming measurement based on the step-by-step scanning of the diffraction profiles for some strain investigations.
The results presented in Section 8 show examples of application possibility of the high-resolution setting when identifying a fine substructure phases having very close values of the lattice spacings which potentially could have some influence on the mechanical properties of the material. When using the values of the lattice spacings from ref. [1,10,15] and a simple formula valid for large values of (), the differences of the lattice spacings of the individual phases in the particular sample can be easily determined.
Finally, we would like to mention the principal difference between using the double bent crystal dispersive monochromator with the sample on the third axis as referred in [11] and the present three-axis setting. In the former case, one can strongly manipulate with the spreading (or limiting) the phase space of the monochromatic beam by changing the curvature of both crystals and to study the influence on some effects (refraction, FWHM of the powder diffraction profiles). In the present case, there is no limitation on the divergence and the high resolution (by a factor of 2 or more) is achieved by means of the focusing in momentum space minimizing the dispersion of the whole system by optimizing the radius of curvature . Therefore, this three-axis setting is also more luminous. As in both cases there are more free parameters which could not been incorporated for the optimization procedures, Monte Carlo simulations are recommended [14].
In conclusion, we hope that the presented neutron diffraction settings can offer an additional support to complement the information achieved by using the other conventional characterization methodologies.
Footnotes
Acknowledgements
Measurements were carried out at the CANAM instrument of NPI CAS Řež installed at the CICRR infrastructure, which is financially supported by the Ministry of Education and Culture – project LM2023041. The authors acknowledge support from ESS participation of the Czech Republic – OP (CZ.02.1.01/0.0/0.0/16_013/0001794) and from the project ESS Scandinavia-CZ II (LM2018111), respectively. Furthermore, they acknowledge support from the Czech Academy of Sciences in the frame of the program “Strategie AV21, No. 23”. The authors thank B. Michalcová from NPI CAS for significant help with measurements and data elaborations.
References
1.
J.Čapek, E.Polatidis, M.Knapek, C.Lyphout, N.Casati, R.Pederson and M.Strobl, The effect of and δ phase precipitation on the mechanical properties of Inconel 718 manufactured by selective laser melting: An in-situ neutron diffraction and acoustic emission study, JOM75 (2021), 223–232. doi:10.1007/s11837-020-04463-3.
2.
V.Davydov, P.Lukáš, P.Strunz and R.Kužel, Single-line diffraction profile analysis method used for evaluation of microstructural parameters in the plain ferritic steel upon tensile straining, Materials Sc. Forum571–572 (2008), 181–188. doi:10.4028/www.scientific.net/MSF.571-572.181.
3.
R.Delhez, T.H.de Keijser and E.J.Mittemeijer, Determination of crystallite size and lattice distortions through X-ray diffraction line profile analysis, Fresenius’ Zeitschrift für analytische Chemie312(1) (1982), 1–16. doi:10.1007/BF00482725.
4.
P.Klimanek, T.Kschidock, P.Lukáš, P.Mikula, A.Mücklich and M.Vrána, Substructure analysis by means of neutron diffraction, Journal de Physique, Coll. C73 (1993), 2143–2148. doi:10.1051/jp4:19937340.
5.
J.Kulda, A novel approach to dynamical neutron diffraction by a deformed crystal, Acta Cryst. A40 (1984), 120–126. doi:10.1107/S0108767384000271.
6.
J.Kulda, P.Mikula, P.Lukáš and M.Kocsis, Utilisation of bent Si crystals for elastic strain measurements, Physica B180&181 (1992), 1041–1943. doi:10.1016/0921-4526(92)90545-4.
7.
J.Kulda, P.Mikula and J.Šaroun, Elastically bent perfect Ge crystal analyzer, Physica B276–278 (2000), 73–74. doi:10.1016/S0921-4526(99)01340-X.
8.
K.Macek, P.Lukáš, J.Janovec, P.Mikula, P.Strunz, M.Vrána and M.Zaffagnini, Austenite content and dislocation density in electron beam welds of a stainless maraging steel, Mat. Sci. Eng. A208 (1996), 131–138. doi:10.1016/0921-5093(95)10047-4.
9.
P.Mikula, J.Kulda, M.Vrána and B.Chalupa, A proposal of a highly efficient double crystal monochromator for thermal neutrons, J. Appl. Cryst.17 (1984), 189–195. doi:10.1107/S0021889884011274.
10.
P.Mikula and V.Ryukhtin, High-resolution neutron diffraction studies of additively manufactured Inconel 718 samples, in: Proc. of the Int. European Research Reactor Conf. 2022, 6–10 June 2022Budapest, Hungary, 2022, pp. 130–134. https://www.euronuclear.org/download/rrfm-2022-proceedings/?wpdmdl=26332&refresh=62a70b871c4061655114631.
11.
P.Mikula, J.Šaroun, P.Strunz and V.Ryukhtin, Properties of the dispersive double bent crystal monochromator setting with a multicrystal sandwich at the place of the second axis, Journal of Neutron Res.24 (2022), 1–14. doi:10.3233/JNR-210032.
12.
P.Mikula, V.Wagner and R.Scherm, On the focusing in neutron diffraction by elastically bent perfect crystals, Report PTB Braunschweig, June 1994, PTB-N-17.
13.
M.Popovici, A.Stoica, W.Yelon and R.Berliner, Curved-crystal three-axis neutron spectrometry with position-sensitive detection, in: Proc. Int. SPIE Symposium: X-Ray, and Neutron Optics and Sources, Vol. 3767, Denver, USA, 1999. doi:10.1117/12.371130.
14.
J.Šaroun and J.Kulda, Monte Carlo simulations of resolution functions and scan profiles for neutron three-axis spectrometer, Journal of Neutron Research6 (1997), 125–133. doi:10.1080/10238169708200102.
15.
P.Strunz, L.Kunčická, P.Beran, R.Kocich and C.Hervoches, Correlating microstrain and activated slip systems with mechanical properties within rotary swaged WNiCo pseudoalloy, Materials – MDPI13 (2020), 208–224. doi:10.3390/ma13010208.
16.
M.Vrána, P.Lukáš, P.Mikula and J.Kulda, Bragg diffraction optics in high resolution strain measurements, Nucl. Instrum. and Methods in Phys. Res. A338 (1994), 125–131. doi:10.1016/0168-9002(94)90172-4.