
Abstract
Background:
Sensitive, objective, and longitudinal outcome measures applicable to both pre-clinical and clinical interventions are needed to assess muscle health in Duchenne muscular dystrophy (DMD). Electrical impedance myography (EIM) has the potential to non-invasively measure disease progression in mice and boys with DMD.
Objective:
We sought to evaluate how electrical impedance values (i.e., phase, reactance, and resistance) correlate to established measures of disease in both D2-mdx and wild type (WT) mice and boys with and without DMD.
Methods:
Histological, functional, and EIM data collected from previous studies of WT and D2-mdx mice at 6, 13, 21 and 43 weeks of age were reanalyzed. In parallel, previously collected functional outcome measures and EIM values were reanalyzed from boys with and without DMD at four different age groups from 2 to 14 years old.
Results:
In mice, disease progression as detected by histological, functional, and EIM measures, was appreciable over this time period and grip strength best correlated to longitudinal phase and reactance impedance values. In boys, disease progression quantified through commonly utilized functional outcome measures was significant and longitudinal phase demonstrated the strongest correlation with functional outcome measures.
Conclusion:
Similar changes in EIM values, specifically in longitudinal reactance and phase, were found to show significant correlations to functional measures in both mice and boys. Thus, EIM demonstrates applicability in both pre-clinical and clinical settings and can be used as a safe, non-invasive, and longitudinal proxy biomarker to assess muscle health in DMD.
Keywords
INTRODUCTION
Duchenne muscular dystrophy (DMD) is the most common and one of the most devastating neuromuscular diseases (NMD) of childhood, affecting approximately 1 in 5000 live male births [1, 2]. Patients with DMD first demonstrate clinical symptoms of delayed gross motor skills of development around 3—4 years of age, eventually becoming wheelchair dependent by their teenage years [3 —6]. A pipeline of therapeutics has advanced management and treatment have emerged, providing hope for prolonged quality of life, though further clinical trials are necessary to demonstrate this. As drug development continues, both pre-clinical and clinical trials rely on outcome measures to demonstrate efficacy to advance therapeutics to market.
An ideal outcome measure is quantitative, independent of patient involvement, cost-efficient, longitudinal, and translatable from pre-clinical to clinical investigations. While functional assessments represent the ultimate outcome intended, functional tests are inherently different between humans and animals, and depend on motivation and compliance, which may be limited in both animals and young children [7, 8]. Though biopsies are adequate for pre-clinical models of disease, they are not ideal for clinical subjects because they are not longitudinal by nature, only capture a snapshot of the pathology, prone to sampling error, and can be psychologically traumatizing to young boys [9]. Muscle MRI offers the ability to quantify the state of health in both pre-clinical and clinical studies, but is expensive, requires complex imaging processing, and demands patient cooperation during exams [10 —12]. As the DMD therapeutic pipeline continues to advance, biomarker selection remains crucial to assess therapeutic efficacy of novel interventions.
One non-invasive methodology that may serve to fill this role is electrical impedance myography (EIM). Briefly, EIM provides data on alterations in the composition and structure of muscle by assessing the electrical properties of tissue [7, 13]. In surface EIM, a weak, multi-frequency (1 kHz -1 MHz) electrical current is passed across a set of electrodes on the skin overlying a muscle of interest and the resultant voltages are measured. Alterations in the measured impedance values (i.e., resistance, reactance and phase) provide data on muscle condition. EIM has been applied to several neuromuscular conditions, including amyotrophic lateral sclerosis (ALS) [14, 15], spinal muscular atrophy (SMA) [16, 17], disuse atrophy [18], myositis [19], and DMD [20 —22] and demonstrates the ability to identify diseased muscle, progression of disease, and response to therapeutics.
Similar to other diseases, no pre-clinical model of DMD perfectly parallels that of the human disease. Historically, the C57BL/10ScSn-Dmdmdx/J (BL10-mdx) mouse model has been utilized to study DMD, though this model has a much milder phenotype than that of humans. More recently the D2.B10-Dmd mdx /J (D2-mdx) model was created by crossing BL10-mdx-mice onto a DBA/2J background [23, 24]. The resultant D2-mdx mice demonstrate a much more severe phenotype than traditional BL10-mdx mice, including impaired muscle function, regeneration, and increased fibrosis within muscle [23, 25]. The primary clinical differences between D2-mdx and BL10-mdx mice result from a polymorphism in Ltbp4 locus and a dysfunctional Anxa6, which are identified as genetic modifiers that increase fibrosis and impair satellite cells' self-renewal capabilities within muscle, respectively, causing a more severe phenotype that resembles human disease more accurately [23, 25].
In the present study, we compare the relationship of various EIM values (i.e., phase, reactance, and resistance) to functional changes in both pre-clinical (D2-mdx) and clinical (human) studies. This work compares data obtained in two earlier studies (one pre-clinical, one clinical) [21 , 27], but that were reported separately. The preclinical study evaluated EIM in D2-mdx and wild type mice [26] and compared it to functional and histological data. The human study evaluated disease progression and response to therapy in DMD to see how EIM related to functional measures only [21, 27]. Our overall goal here was twofold: to determine which, if any, particular EIM values best correlated with both human and animal results, including established functional measures in mice (front or hindlimb grip strength) and humans (supine to stand test, 10 meter walk run, and 6 minute walk test), and secondarily to assess the utility of EIM as a proxy for functional tests at both pre-clinical and clinical investigations, such that it could serve as an analogous biomarker in both settings.
MATERIALS AND METHODS
Mice and pre-clinical models of Duchenne muscular dystrophy
All animal procedures were approved by the Institutional Animal Care and Use Committee at the Beth Israel Deaconess Medical Center. Male D2-mdx (D2.B10-Dmd mdx /J) and wildtype (DBA/2J) mice, aged 6, 13, 21, and 43 weeks were obtained from Jackson Labs (Bar Harbor, Maine) to assess the natural progression of disease by comparison to age matched controls. The data used in the present study were gathered as part of a larger study as recently described [26].
Functional tests (forelimb and hindlimb grip strength) were performed via a grip strength meter single computerized sensor with standard pull bards for mice as previously described [28]. Compound muscle action potential (CMAP) amplitudes were measured as previously described [29].
Surface EIM measurements were performed with the mice under 1% isoflurane anesthesia delivered by nose cone, while body temperature was maintained with a heating pad. After shaving and depilating the hindlimbs, the skin was cleaned with 0.9% saline solution. A fixed rigid four-electrode impedance measuring array was positioned over the gastrocnemius (GA) muscle in the longitudinal direction [30]. All EIM measurements were performed using an impedance spectroscopy system (mView; Myolex, Inc., Boston, MA). Surface EIM measurements (acquiring resistance, reactance, and phase values at 41 frequencies between 1 kHz to 10MHz) were repeated twice and averaged to ensure consistent values. After longitudinal data were collected, the array was rotated 90° and measurements were repeated to obtained transverse values.
Following surface EIM data collection, mice were humanely euthanized by CO2 and histological analysis was performed [26]. The left GA muscles were fixed, sectioned, and stained to identify myocyte cell membranes and nuclei, and imaged to determine myofiber cross-sectional area (CSA) as previously described [26]. On average, 312 myofibers were counted per animal at each time point.
To obtain hydroxyproline (HP) content, the contralateral GA muscle was excised in its entirety, immediately snap frozen, and a portion (~10 mg) later analyzed for HP content using a commercially available assay (Kit #6017; Chondrex, Inc., Redmond, WA) as previously described [26, 31]. Results are reported as micrograms of HP per milligram of muscle.
Human studies
The clinical data used in the present study were collected as a part of a larger study as previously described [21, 27]. Boys with DMD (n = 26), aged 2 to 14 years old were recruited through the Neuromuscular Clinic at Boston Children's Hospital. Boston Children's Hospital Institutional Review Board approved the protocol, and parents and children provided informed consent and verbal assent, respectively. All boys with DMD had genetic confirmation of disease and a characteristic clinical picture. Boys with DMD were excluded if they were concurrently enrolled in a therapeutic clinical trial or had comorbidities that substantially impacted health. Boys with DMD were enrolled regardless of corticosteroid use. Sixteen boys with DMD were on steroids at the time of enrollment, and 10 were not. Healthy boys (n = 28), recruited via advertisement and word of mouth, had no history of NMD or any disorder that would affect muscle health. Boys with and without DMD were cohorted into four equivalent sized groups based on age (Table 1).
Human subject ages by quartile
The ages of each subject group in each quartile are shown for subjects with and without DMD. *Indicates p < 0.05 of DMD versus control cohorts.
EIM measurements were obtained using the Impedimed SFB7 device (Impedimed, Inc., Sydney, Australia) attached via cables to a custom designed handheld array, as previously described [27, 32]. Being cognizant that electrode size and positioning will impact results, details regarding probe size, angle, depth of penetration, and device specifications are thoroughly described [33 —35]. Briefly, given that the children ranged in age and size, three differently sized electrode arrays were utilized throughout the study. For purposes of this study, measurements were performed on the medial gastrocnemius of the dominant side, if able to be established (and if dominant side unable to be established, measurements were arbitrarily performed on the right). The probe was placed over the bulk of the muscle, and measurements were performed with the array placed longitudinally (in parallel to muscle fibers) and then transversely (array perpendicular to muscle fiber orientation).
The timed supine-to-stand (S2S), 10 meter walk/run (10MW), and six minute walk (6MWT) tests were administered to all boys who could follow directions and perform the tests safely as previously described [32]. Supine-to-Stand and 10MW tests were measured to the nearest second, and 6MWT were calculated based on the percent predicted value per individual ages.
Data analyses
Surface EIM data for mice and boys were reviewed for quality and any spurious data (as suggested by erratic multifrequency and low-frequency artifact suggesting poor electrode contact) were excluded. Data were specifically extracted at 100 kHz for further analyses.
Statistical analyses of the physiological, histological, biochemical, and impedance data were performed using GraphPad Prism v9 (GraphPad Software, Inc., La Jolla, CA). Unless otherwise noted, all data were reported as mean ± SEM. Multiple group comparisons were performed with one-way analysis of variance (ANOVA) with Tukey's multiple comparisons tests. Multifrequency EIM values were compared using the two-way ANOVA using Sidak's multiple comparison test. For correlation analyses, the Pearson correlation coefficient r2 was calculated (Table 2). Data were considered significant with p <0.05. Baseline demographic comparisons were performed using unpaired tests, 2-tailed, alpha = 0.05.
Mouse linear correlations
Linear correlations showing r 2 values, p values, and confidence intervals (CI) between physiological, histological, biochemical and functional measures versus EIM values (Resistance, Reactance, and Phase in the longitudinal direction at 100 kHz) in D2-mdx and DBA/2J mice.
RESULTS
Baseline physiological, histological, and functional measures in D2-mdx and dba mice
Physiological, histological, and functional characteristics of D2-mdx and WT (DBA/2J) mice at 6, 13, 21, and 43 weeks are shown in Fig. 1. Body mass (Fig. 1A) is shown to increase as mice age for both the D2-mdx and DBA/2J mice, though at 21 and 43 weeks the mass is significantly greater in DBA/2J mice than in comparably aged D2-mdx mice. CSA (Fig. 1B) of myocytes are significantly larger in DBA/2J mice at ages 13 and 21 weeks as compared to age matched D2-mdx mice. HP content (Fig. 1C) is significantly elevated in D2-mdx mice, most notably at 21 and 43 weeks. The only significant difference in CMAP (Fig. 1D) is appreciated at 13 weeks between DBA/2J and D2-mdx mice. As expected, DBA/2J mice have significantly stronger front paw grip strength (Fig. 1E) as compared to D2-mdx mice at all ages. There are no significant differences measured between hind paw grip strength at any age groups between the two mouse phenotypes (Fig. 1F).
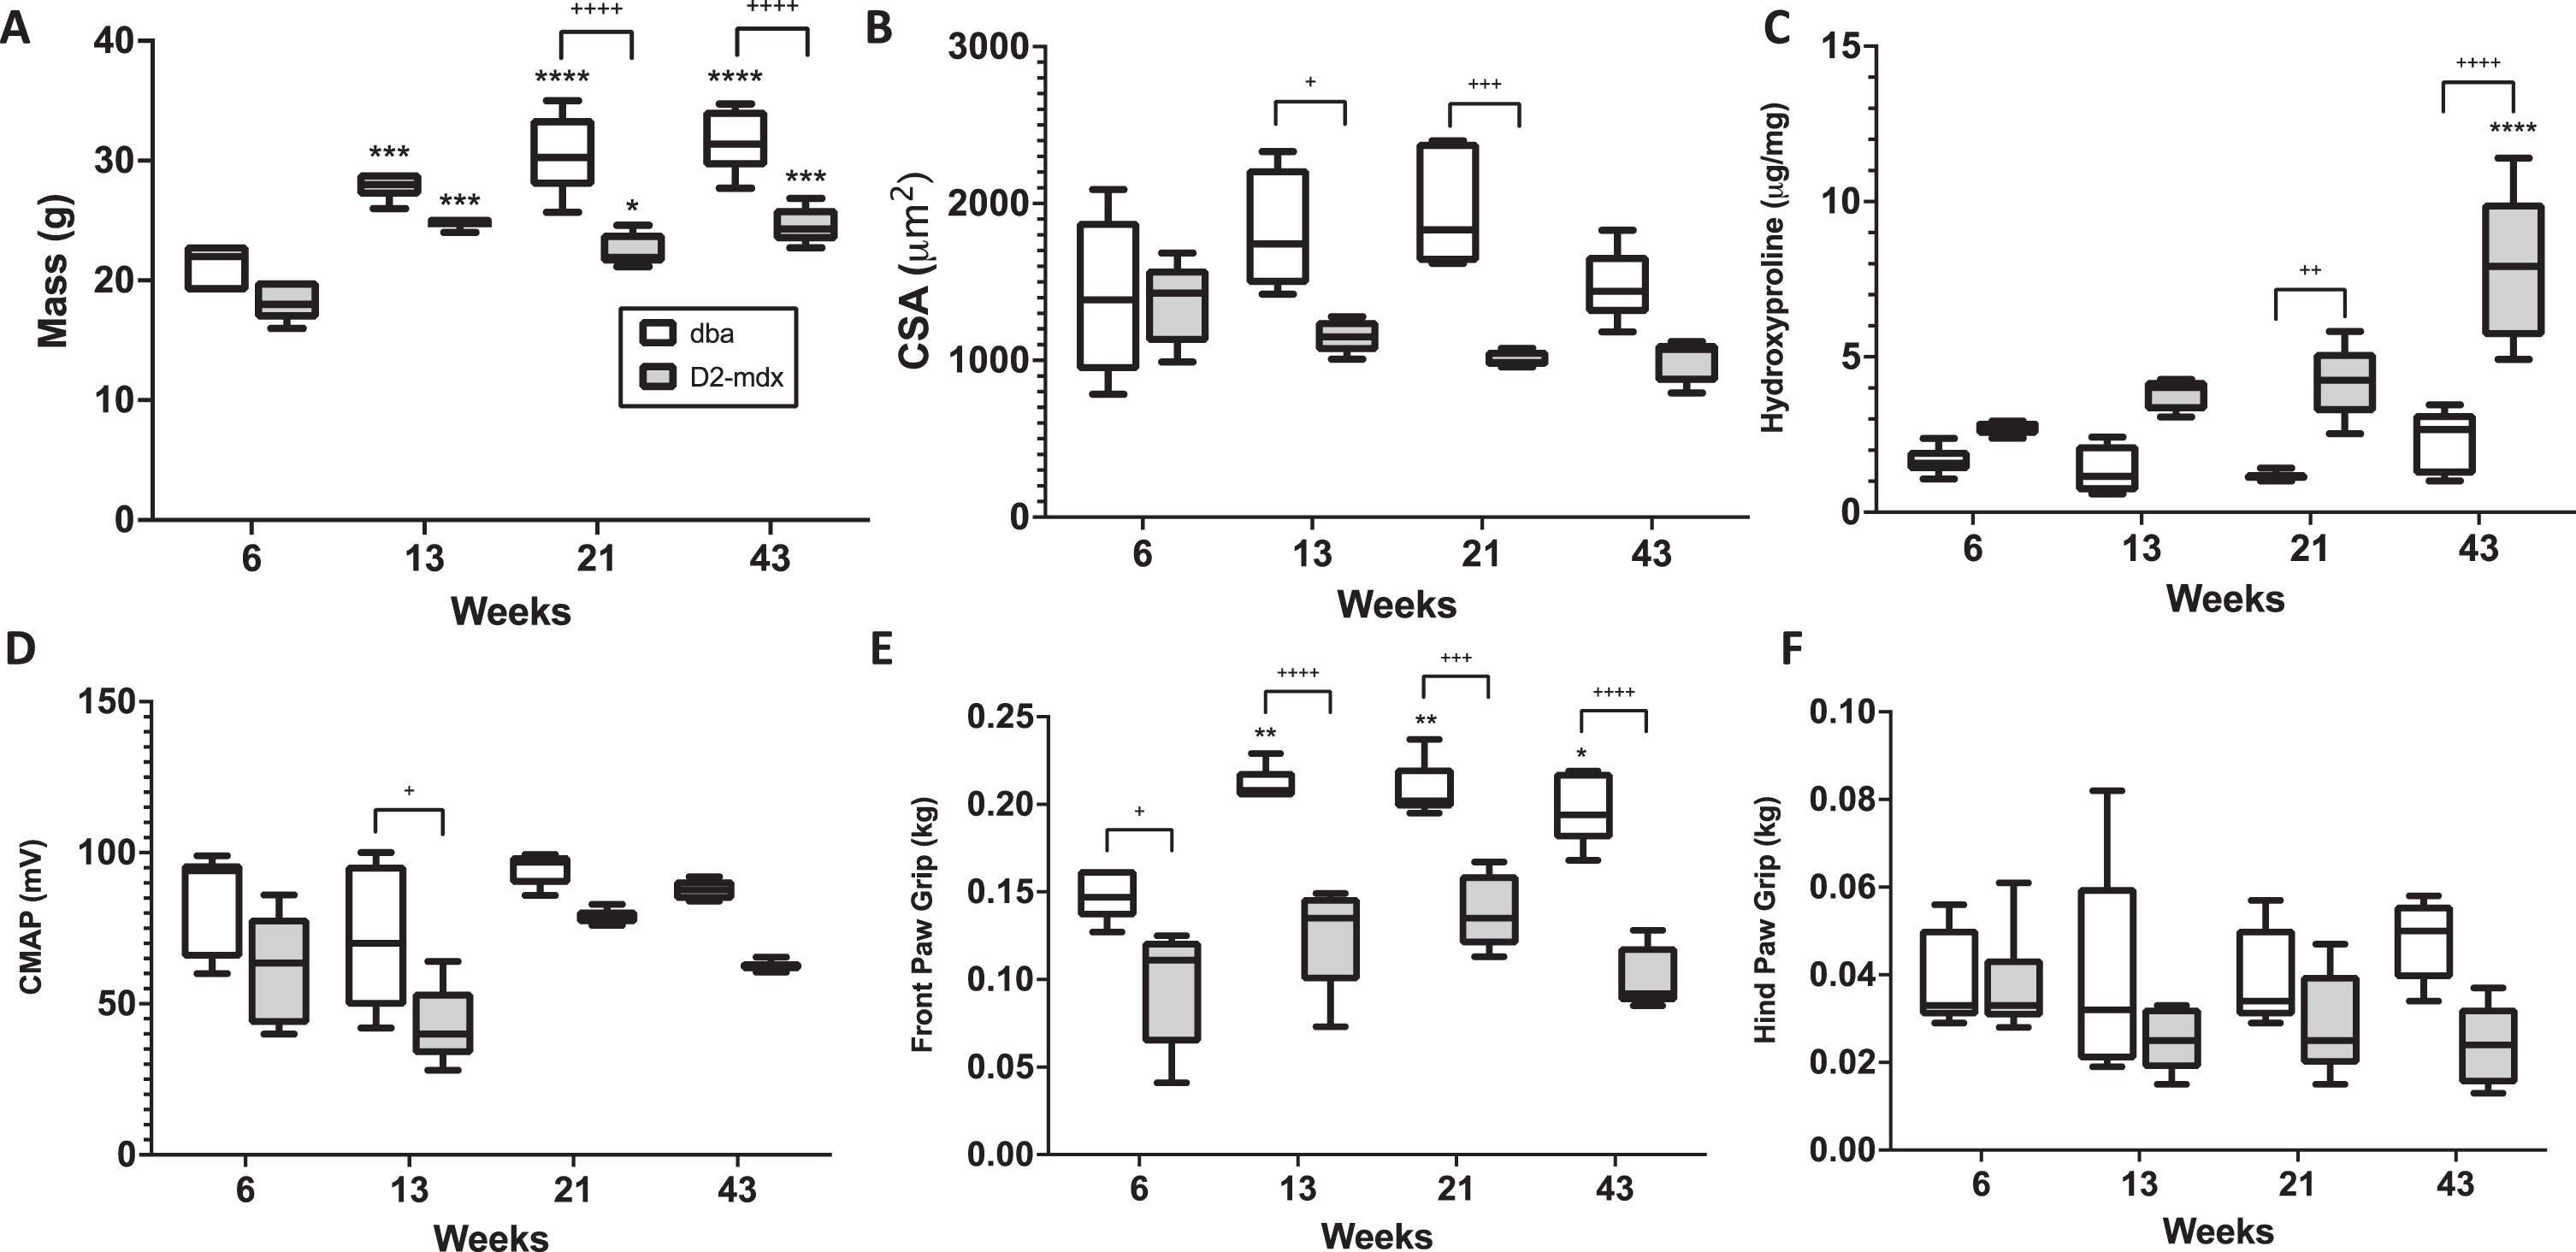
Physiological, histological, and functional measures in D2-mdx and DBA/2J mice. Differences in body mass (A), myofiber cross sectional area (B), hydroxyproline content (C), compound muscle action potential (CMAP) (D), front paw grip strength (E), and hind paw grip strength (F) are shown.+ indicates significance between phenotypes, and * indicates significance versus 6 week version of same phenotype.+ or * indicates p <0.05, ++or ** indicates p <0.01, +++or *** indicate p <0.0001.
Human demographic and functional data in boys with and without DMD
Human subjects with and without DMD were divided into four quartiles based on age (Table 1). There were no differences appreciated between age matched cohort groups. Functional data for each quartile group are shown in Fig. 2. The results of the S2S test are shown in Fig. 2A, demonstrating significant differences between the control and DMD cohorts in Q2 and Q3. Of note, five of seven subjects in Q1 (DMD) could complete the S2S test, all subjects of Q2 completed the S2S test, but only three DMD subjects were able to complete the S2S test in Q3 and no subjects in Q4 were able to complete the S2S test. Of the control subjects, in Q1 (Control), six of eight completed the S2S test, and all remainder control subjects completed the S2S test. The results of the 10MW test are shown in 2B. Significant differences are appreciated between groups in Q2, Q3, and Q4. In Q1 (DMD), six of seven boys completed the 10MW, all boys in Q2 (DMD) completed the 10MW, but only three boys with DMD were able to complete the 10MW test in Q3, and only one boy with DMD completed the test in Q4. In the control cohort, one boy in the Q1 (Control) cohort could not complete the 10MW test, but all others did. Lastly, the 6MWT (percent predicted) is shown in Fig. 2C. In Q1 (DMD) and Q3 (DMD), only two boys could complete the 6MWT, all boys in Q2 (DMD) completed the 6MWT, and only one boy with DMD could complete the test in Q4. In the control cohort, in Q1 (Control), only 2 boys could complete the 6MWT, but the remainder of control subjects successfully completed the 6MWT.
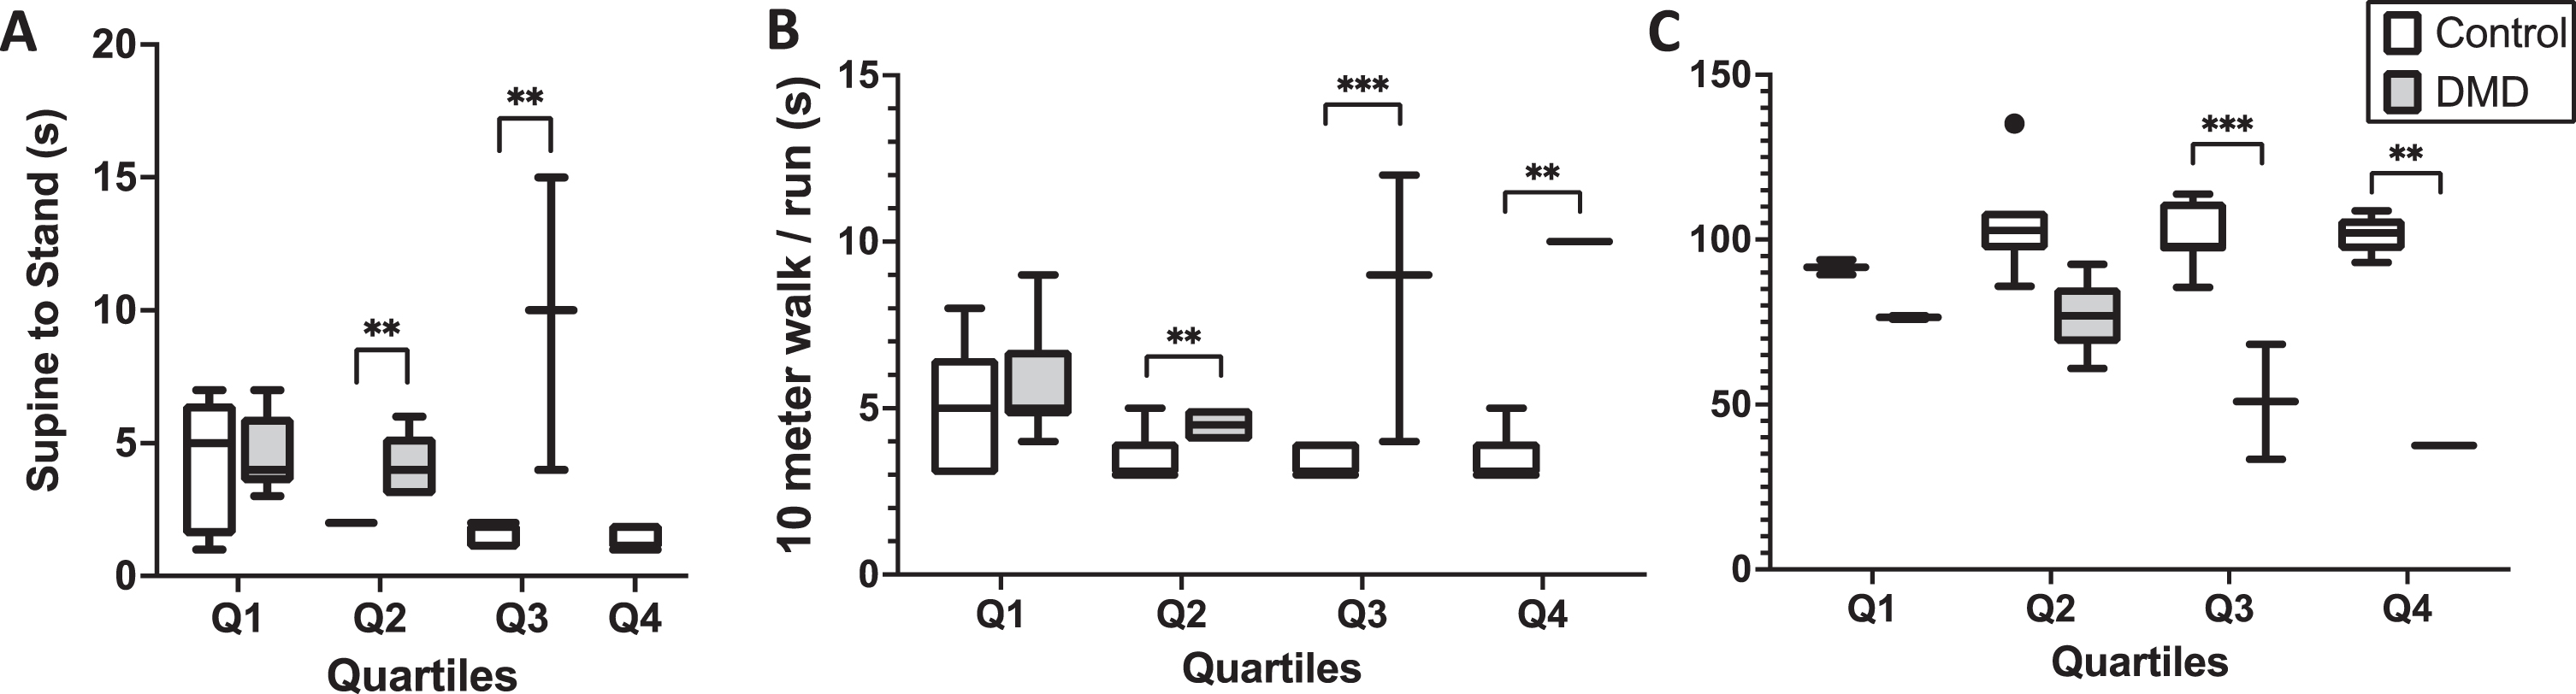
Functional data is presented for subjects with and without DMD by quartiles. Differences in the Supine to Stand test (A), the 10 meter walk/run test (B), and 6 minute walk test percentage predicted (C) are shown. Of note, only 3 subjects in Quartile 3 (DMD) were able to complete the supine to stand and 10 meter walk run, and only 2 of those subjects could complete the 6 minute walk test. There was only one subject in quartile 4 (DMD) that was able to complete the 10 meter walk run and 6 minute walk test and none were able to complete the supine to stand test.+ or * indicates p <0.05, ++or ** indicates p <0.01, +++or *** indicate p < 0.0001.
Single frequency longitudinal reactance and phase assessments over time
Longitudinal resistance, reactance, and phase values at 100 kHz are shown for mice (Fig. 3A, 3B, and 3C, respectively) and humans (Fig. 3D, 3E, and 3F, respectively). Whereas no significant differences in longitudinal resistance between D2-mdx and DBA/2J mice were detected at any time point (Fig. 3A), significant differences in longitudinal reactance between DBA/2J and D2-mdx mice at 6, 13, and 43 weeks are appreciated (Fig. 3B) and at all age groups in longitudinal phase (Fig. 3C). In humans, significant differences are appreciated in longitudinal resistance (Fig. 3D) between Q3 and Q4, in longitudinal reactance between Q1, Q2, and Q4 for (Fig. 3E), but only in Q4 in longitudinal phase (Fig. 3F). It should be noted that, although a majority of the resultant EIM data likely corresponded to the most superficial gastrocnemius muscles immediately under the EIM electrodes, there may be contributions from the deeper soleus muscle.
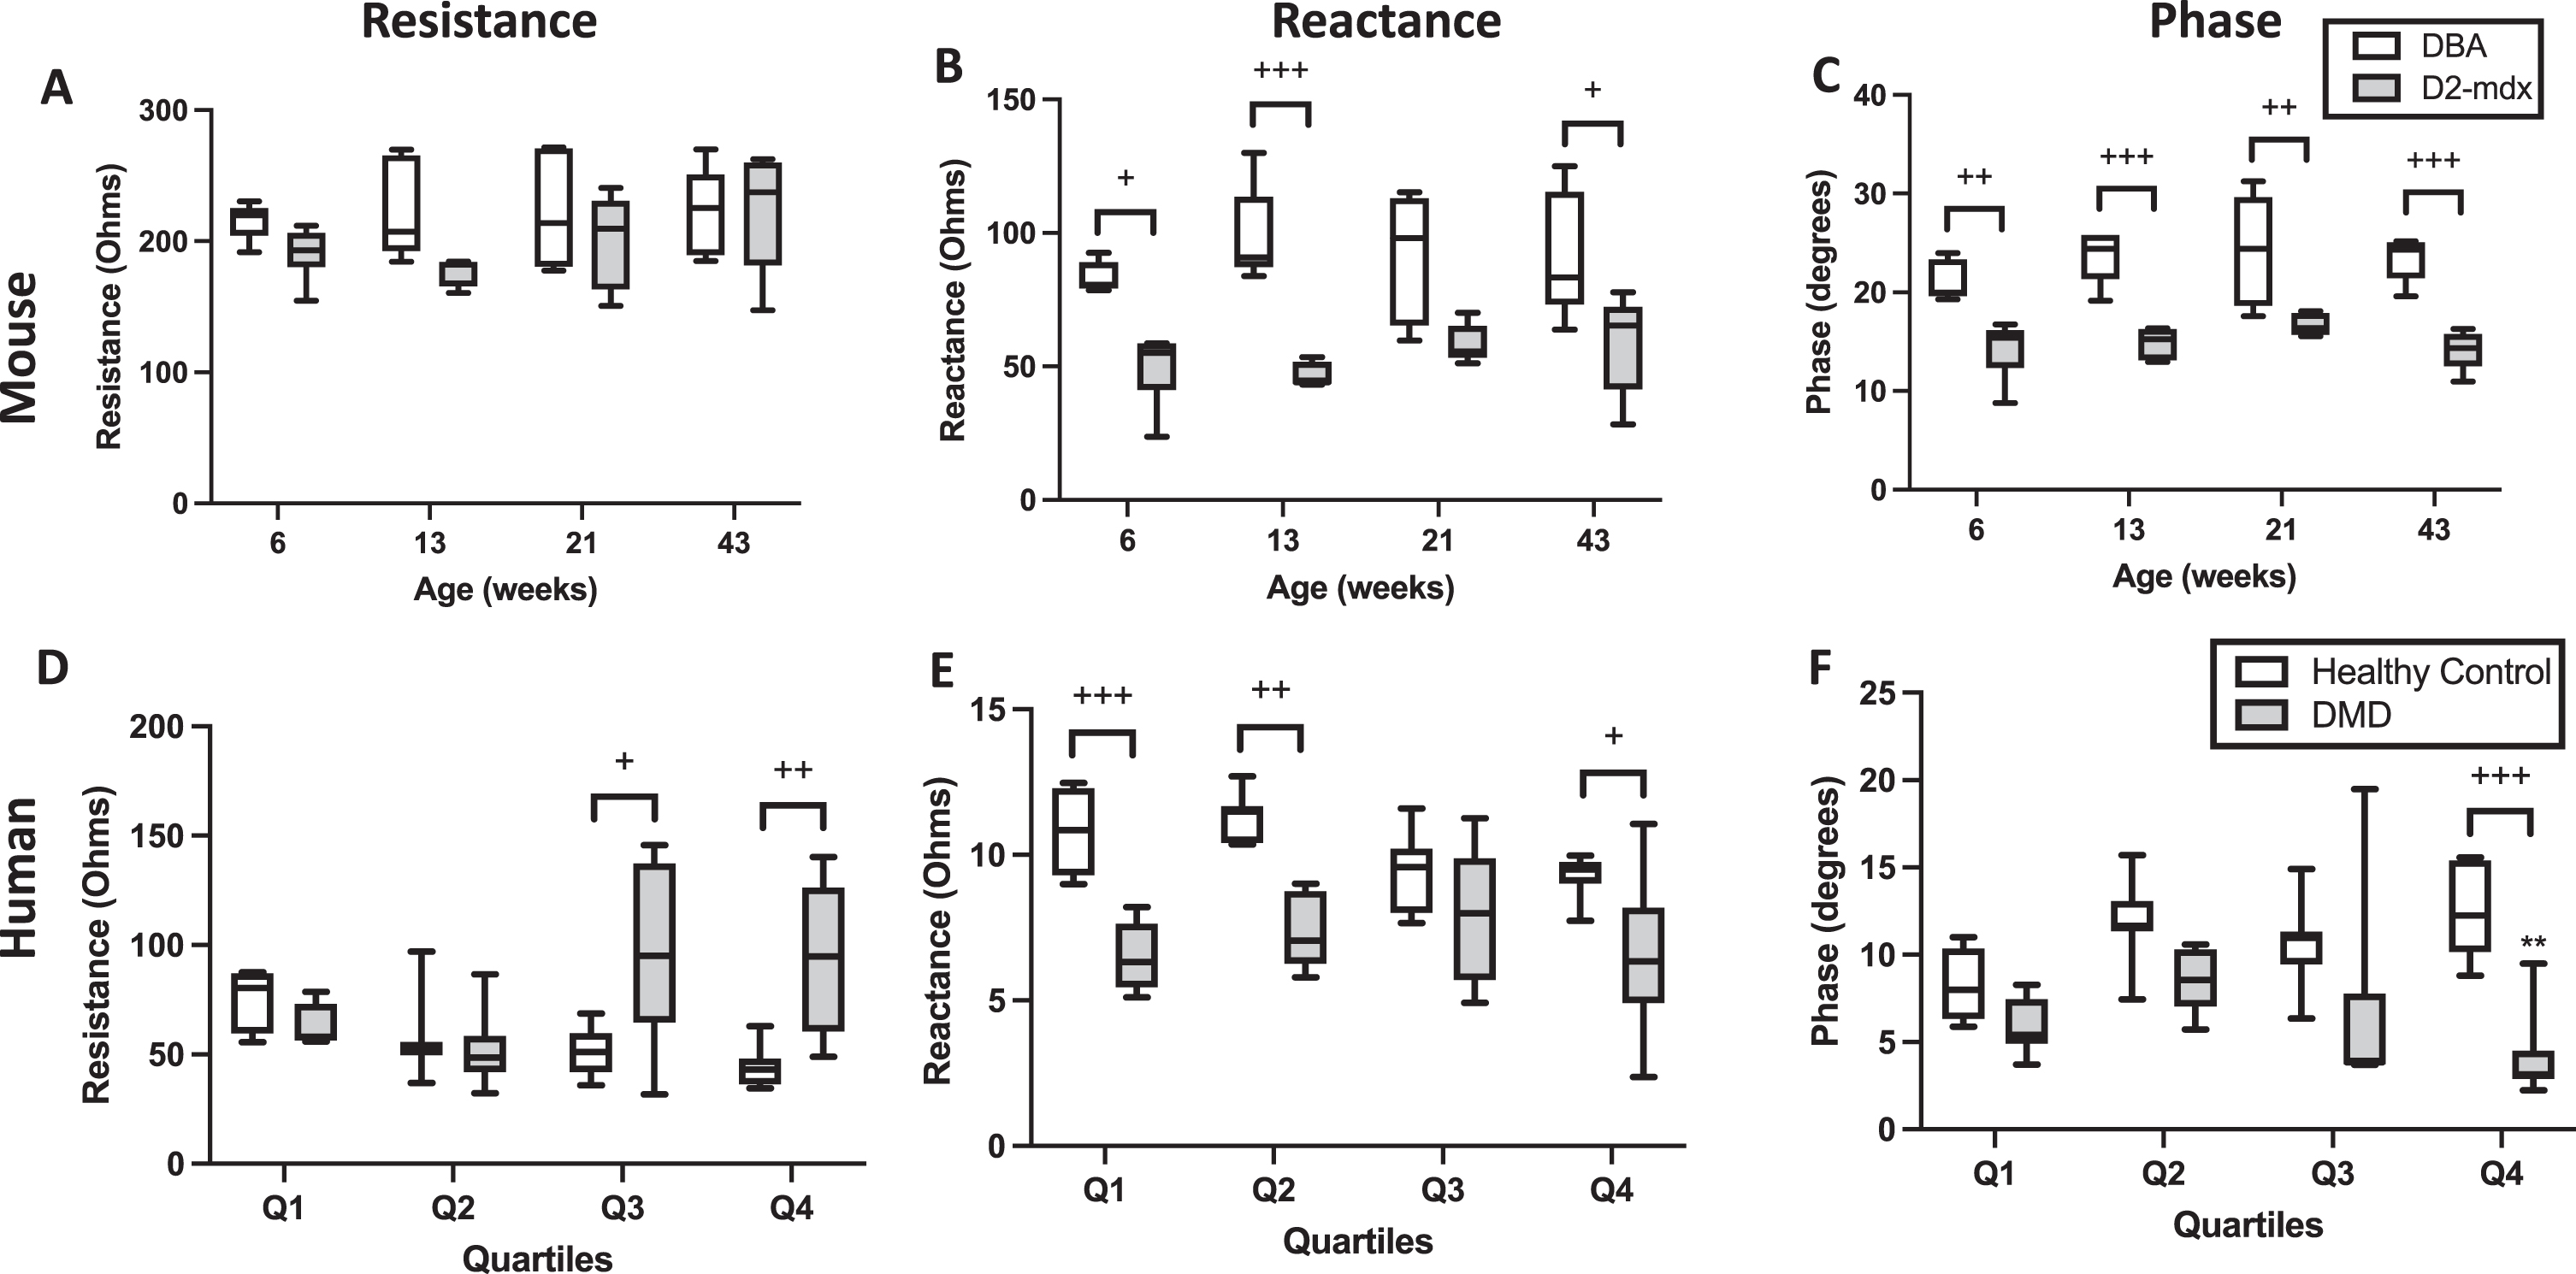
Longitudinal resistance, reactance, and phase measurements at 100 kHz in mice and humans with and without DMD. * indicates significance versus the same age group of the control phenotype.+ or * indicates p < 0.05,++or ** indicates p < 0.01,+++or *** indicate p < 0.0001.
Linear Correlations between EIM values at 100 kHz and various physiological, histological, biochemical, and functional measurements
Table 2 demonstrates numeric values of linear correlations between all three EIM measures at 100 kHz and various physiological, histological, and functional measures in the D2-mdx and DBA2/J mice. Significant correlations are particularly appreciated in the front limb strength for all three EIM measures. Table 3 similarly shows linear correlations between all EIM measures at 100 kHz versus age and functional measures in human subjects. Graphically, the correlation between mouse front limb strength to resistance (Fig. 4A), reactance (Fig. 4B), and longitudinal phase (Fig. 4C) are visualized. Similarly, the S2S test versus longitudinal resistance (Fig. 4D), reactance (Fig. 4E), and phase (Fig. 4E) are shown for the human participants of this study. Note that for the human studies, the S2S test and 10MW test were approximated to the closest second, thus the ‘stacked' appearance of the data points.
Human linear correlations
Linear correlations showing r 2 values, p values, and confidence intervals (CI) between physiological and functional measures versus EIM values (resistance, reactance, and phase in the longitudinal direction at 100 kHz in humans with and without DMD with.
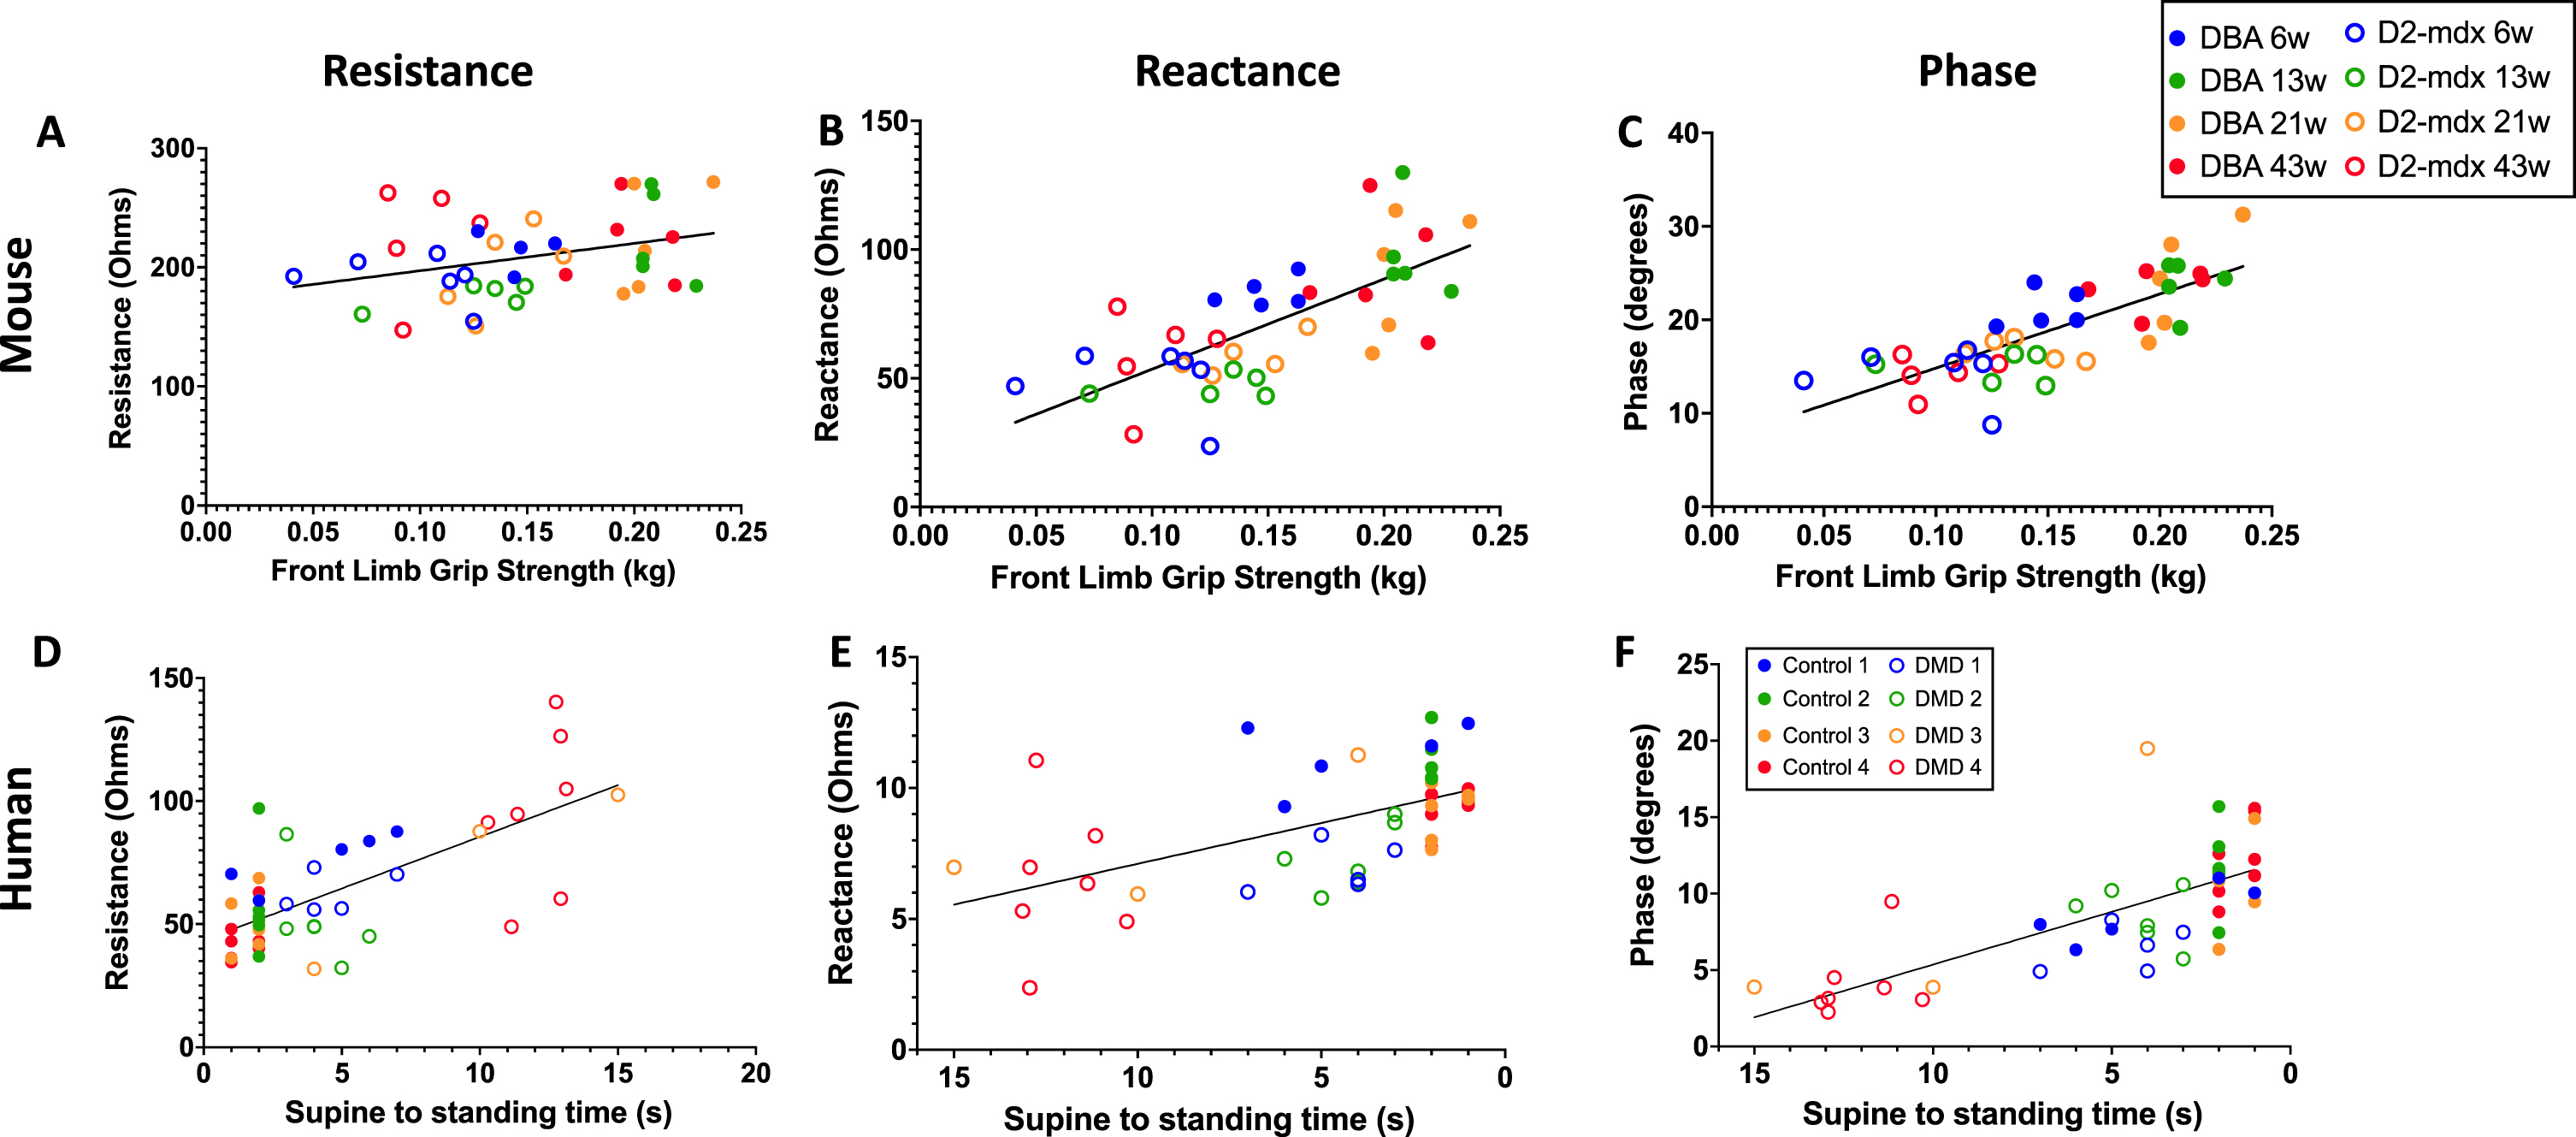
Linear correlations between D2-mdx and DBA/2J front limb grip strength versus longitudinal resistance, longitudinal reactance and longitudinal phase measurements at 100 kHz. Figures 4A, 4B, and 4C represent comprehensive mouse (DBA and D2-mdx) mice data at all ages for longitudinal resistance, reactance, and phase, respectively. In parallel, Figures 4D, 4E, and 4F represent comprehensive human (control and DMD) data at all ages for longitudinal resistance, reactance, and phase, respectively. Linear correlations in humans with and without DMD of the Supine-to-Stand test versus longitudinal reactance and longitudinal phase measurements at 100 kHz.
DISCUSSION
The results of this study support the conclusion that EIM can serve analogously as a biomarker of disease progression in a pre-clinical DMD model and in actual DMD, as EIM values (at 100 kHz) correlate with functional deterioration in both situations. This is the first attempt to directly compare the correlation of functional measures to EIM values in both D2-mdx mice and a human dystrophinopathy. As new therapeutics continue to be developed, adequate biomarkers that are easily translatable from pre-clinical to clinical studies are necessary, and EIM has the potential to fill the role of such a biomarker given EIM's quantitative, repeatable, and relatively inexpensive nature.
In humans, as the dystrophinopathy progresses, healthy muscle becomes grossly inflamed and is gradually replaced with lipid and connective tissue. This results in variably sized myocytes interspersed with endoymysial fibrosis and lipid deposition. Generally stated, increased endomysial lipid will increase resistance values, whereas inflammation and resultant edema will reduce resistance. Reactance is primarily affected by sarcolemmal surface area, thus is particularly sensitive to myocyte atrophy, evident by the most affected mice and boys having lower reactance and phase values (Fig. 3). Phase is a function of the ratio of resistance and reactance, thus is determined by a combination of both resistance and reactance values.
The development of the D2-mdx mouse model to replace the formerly utilized BL10-mdx model is important as D2-mdx more meaningfully mimics the severity of human DMD [23, 25]. Due to the different background (DBA/2J) and genetic modifiers (Ltbp4 and Anxa6), D2-mdx mice are more susceptible to increased fibrosis and impaired regeneration within muscle, in turn causing a more severe phenotype. Indeed, until recently, our lab focused on the BL10-mdx mouse model, but have recently started investigating D2-mdx mice [26 , 37]. As anticipated, the D2-mdx mice were significantly weaker, and the GA muscles had significantly increased HP content and smaller myocyte CSA as compared to their DBA/2J control counterparts (Fig. 1). Though the D2-mdx mouse model is better than the BL10-mdx model for the aforementioned reasons, a critical difference between humans and mice remains, i.e., mice develop little intramuscular lipid deposition, whereas boys with DMD have significant lipid depositions within their muscle. In addition, the D2-mdx mice develop heterotopic calcification, which is less a feature of human disease. However, inflammation and fibrosis, which are significant contributors to the pathophysiologic degeneration of dystrophic human muscle, are more characteristic of the D2-mdx than traditional BL10-mdx mice.
Ultimately, the ability to prevent muscle deterioration and to preserve or restore clinical function is the ultimate goal of any new therapy for the spectrum of neuromuscular diseases. However, function as an outcome measure in a clinical trial remains challenging because of the subjective nature of tests and the requirement of motivation and compliance, specifically in a pediatric population. As a proxy for functional assays, other non-invasive, objective, and longitudinal outcome measures have demonstrated utility in correlation to function and prediction of loss of function, specifically through the use of EIM for a variety of neuromuscular disorders [14 , 26—28]. Previously, our lab demonstrated correlations between histologic and functional measures in BL10-mdx mice and EIM measures [31, 36]. Until recently, such an analysis has not been performed in D2-mdx mice [26]. Unique compared to previous studies in the BL10-mdx mice, the current study uses 4 cohorts of different aged mice to assess longitudinal changes, paralleling the study of boys with DMD. In the D2-mdx mice, data are consistent with characteristic features of dystrophic muscle, including decreased CSA with aging and increased hydroxyproline content [26]. However, as histologic markers of disease are far more difficult to apply than functional measures in clinical studies, EIM more easily (i.e. non-invasively) provides insight into pathophysiological changes and correlations to functional measures in both mice and humans in the aforementioned work.
Although EIM records resistance, reactance, and phase values in both the longitudinal and transverse directions at multiple frequencies, for the sake of simplicity, we have chosen to focus on the surface EIM data collected specifically at 100 kHz. We have focused on reactance and phase values at 100 kHz for several reasons. From a practical sense, previous work that assessed anisotropy throughout several frequencies highlights 100 kHz as a peak difference between subjects with and without DMD [38]. Theoretically, as disease disrupts the sarcolemma causing reduced myofiber size and increased fiber density, the capacitive nature of muscle is disrupted, likely impacting reactance more so than the other values. Phase is a function of the ratio of resistance and reactance, thus is affected by alterations in either or both of these values. Previous work within our lab showed that reactance is more sensitive in BL10-mdx mice than resistance, so phase results were included in this study [36]. Despite size and physiologic differences between mice and humans, 100 kHz reliably demonstrates differentiation between disease and healthy states for both models of disease (Fig. 3).
This analysis has several limitations. The decision to assess the clinical data in longitudinal fashion led to a smaller number of subjects within each cohort, most appreciated in the youngest and eldest cohorts of boys with DMD that were unable to complete several functional tests. However, the ability for EIM to be performed in boys unable to complete functional testing supports EIM's use as a biomarker, as it is applicable to an expanded population as compared to many traditional functional measures. Furthermore, by grouping the subjects as such, we are able to appreciate the natural history of DMD at the cost of lower numbers of subjects able to complete functional testing, appreciated as subjects continued to gain milestones until they physically plateaued and declined. Second, though our lab usually employs multi-frequency EIM investigations, the present study intentionally chose to employ EIM values at a single frequency (i.e., 100 kHz) to highlight the simplicity of correlations between function and EIM measures at a single frequency, as has been done in other NMDs, including SMA, disuse atrophy, and ALS [14 —17]. Additional data may be able to be elucidated through multi-frequency analyses, though that was not the purpose of this study. Third, different EIM devices and surface electrodes were utilized for the pre-clinical and clinical portions of this study, and although the principle of the EIM technology remains consistent, practical differences exist between the different devices. Lastly, this study focused on a single muscle (gastrocnemius) in both boys and mice. While further insight is to be gained from easily testing multiple muscle groups, EIM is valuable to be able to assess changes of targeted muscles in a longitudinal manner, which may allow clinicians to individualize monitoring to the muscles most affected in patients.
This study supports the basic concept that EIM outcomes are relatable between pre-clinical and clinical investigations, demonstrating correlation to functional (mouse and human) and pathophysiologic markers (mouse) of disease. Given EIM's translatability from pre-clinical to clinical studies, ease of use, longitudinal capabilities, and quantifiable nature, EIM warrants further study as a biomarker in dystrophinopathy and other NMDs.
Footnotes
ACKNOWLEDGMENTS
This work was funded by the NIH grants R01AR060850 and R01NS055099.
CONFLICTS OF INTEREST
Stephen Chrzanowski, Janice Nagy, and Sarbesh Pandeya all have no conflicts of interest nor financial disclosures to declare. Dr. Rutkove has equity in, and serves as a consultant and scientific advisor to, Myolex, Inc, and Haystack Diagnostics, Inc. two companies that designs impedance devices for clinical and research use; he is also a member of Myolex's board of directors. Myolex also has an option to license patented impedance technology of which Dr. Rutkove is named as an inventor.
Correction (March 2025):
Article has been updated online to correct “Longitudinal Resistance„ to “Longitudinal reactance„ in the second row of Tables 2 and 3.