
Abstract
Background:
Duchenne Muscular Dystrophy (DMD) is a neuromuscular disorder that presents in childhood and is characterized by slowly progressive proximal weakness and lower extremity contractures that limit ambulatory ability [1, 2]. Contractures develop in the ankles, knees, and hips due to muscle imbalances, fibrotic changes, loss of strength, and static positioning [2, 5]. Currently, standards of care guidelines emphasize the importance of maintaining good musculoskeletal alignment through stretching, bracing, and glucocorticoid (GC) therapy to preserve strength and function.
Methods:
This is a retrospective analysis of prospectively collected data through the CINRG Duchenne Natural history study (DNHS). The objectives of this analysis are to understand the progression of ankle contractures for individuals with DMD and to investigate the relationship between progressive lower limb contractures, knee strength, and Timed Function Tests.
A collection of TFTs including supine to stand (STS), 10 meter walk test (10MWT), and timed stair climbing (4SC) have been used to monitor disease progression and are predictive of loss of ambulation in these patients [4]. Multiple factors contribute to loss of ambulation, including progressive loss of strength and contracture development that leads to changing biomechanical demands for ambulation. A better understanding of the changes in strength and range of motion (ROM) that contribute to loss of function is important in a more individualized rehabilitation management plan. In this longitudinal study, we measured strength using quantitative muscle testing (QMT) with the CINRG Quantitative Measurement System (CQMS)), ROM was measuresed with a goniometer and TFTs were measured using a standard stopwatch and methodology.
Results:
We enrolled 440 participants; mean baseline age was 8.9 (2.1, 28.0) years with 1321 observations used for analysis. GC use was stratified based on duration on drug with 18.7%at < 6 months or naïve; 4.3%<1 year; 58.0%1 < 10 years; and 19.3%between 10-25 years of GC use. Ankle ROM was better for those on GC compared to GC naive but did not significantly influence long-term progression rates. QMT, ROM, age and GCs contribute to speed of TFTs. Knee extension (KE) strength and Dorsiflexion (DF) ROM are significant predictors of speed for all TFTs (p < 0.001). Of the variables used in this analysis, KE strength is the primary predictor of walking speed, estimating that every pound increase in KE results in a 0.042 m/s improvement in 10MWT, and a smaller similar increase of 0.009 m/s with every degree of ankle DF ROM.
Conclusion:
GC use provides an improvement in strength and ROM but does not affect rate of change. Knee strength has a greater influence on speed of TFTs than DF ROM, although both are statistically significant predictors of speed. Results show that retaining knee strength [1, 2], along with joint flexibility, may be important factors in the ability to perform walking, climbing and supine to stand activities.
ABBREVIATIONS
10 Meter Walk/run Test Cooperative International Neuromuscular Research Group CINRG Quantitative Measurement System Duchenne muscular dystrophy CINRG Duchenne Natural History Study Passive Range of Motion Quantitative Isometric Muscle Strength Testing Range of Motion Timed Function Tests
INTRODUCTION
Duchenne muscular dystrophy (DMD) is a progressive genetic neuromuscular disease affecting 1 in every 7250 males from ages 5–24 years [3–5]. This X-linked developmental disorder causes progressive muscle weakness, usually leading to death by early adulthood from cardiorespiratory insufficiency [1, 6–13]. Individuals with DMD have a mutation in the dystrophin gene that leads to musculoskeletal impairments including progressive muscle weakness, imbalances, and contracture development which eventually result in loss of ambulation [14]. Strength loss is the primary impairment leading to loss of ambulation in DMD, but an important secondary impairment affecting the biomechanics of gait is the development of contractures [15–17]. Discovery of the dystrophin gene over 30 years ago has led to improved diagnostic and treatment capabilities in people with DMD. Improved physical therapy (PT) management strategies and glucocorticoid (GC) therapeutic interventions result in a longer lifespan for individuals with DMD and contribute to the increased variability in rates of disease progression. Phenotypical progression varies in DMD but occurs in a predictable, sequential manner that includes the loss of functional abilities (e.g. ability to rise from the floor, climb stairs, walk, and self-feed) [1, 6–13].
Maintaining ambulation has been a long-standing goal for boys with DMD and therapeutic efforts focus on addressing muscle imbalances around joints to promote optimal kinematics for movement and energy conservation. A combination of strength declines and contracture development leads to biomechanical changes with resultant loss of ambulation [17, 18]. Proximal hip flexor, hip extensor, and knee extensor muscle weakness is seen initially [13, 20]. Contractures typically first develop distally at the ankles followed by the hip flexors, iliotibial bands, and forearm/finger musculature [7]. Significant contractures are rare in children younger than 9 and tend to develop more aggressively with greater strength loss and increased difficulty with standing and walking [7]. Due to the high rate of fibrosis in DMD, muscles with poor anti-gravity strength positioned in a shortened position will develop contractures [6, 20–26]. Additionally, studies have found increased stiffness in ankle plantarflexors in boys with DMD compared to normal controls [16, 17]. Physiological components attributing to to ankle stffiness include increased subcutaneous fat, joint capsule tightening, tendinous adherence and/or muscle shortening [26–28]. Progressive muscle weakness and the development of contractures change musculoskeletal alignment and affect muscle force demands, which translates functionally into decreased gait speed and eventual loss of ambulation [29–32]. For boys with DMD, plantar flexion contractures impact gait speed with a premature foot strike and energy generation instead of absorption compared to normal controls [16, 17].
Currently, standards of care guidelines for DMD emphasize an anticipatory care approach by maintaining appropriate musculoskeletal management through physical therapy and glucocorticosteroids (GC) to maintain strength and function [33, 34]. GCs are frequently used for individuals with DMD and have beneficial effects on TFTs as reported by multiple studies [1, 35–40]. However, few studies have investigated the possible effect of GCs on the onset and progression of ankle contractures, nor their impact on TFTs in DMD.
Consensus for recommended clinical outcomes to be used in clinic include TFTs because of their ability to track disease progression and prognostic capabilities [41]. Since gait speed has been shown to be a good predictor of loss of ambulation [19, 35], It is important to understand the multifaceted dimensions of gait speed including pathophysiological contributions. MRI studies of dystrophic muscles have demonstrated the presence of inflammation, fat infiltration and sarcolemma disruptions that result in poor muscle health impacting muscle weakness, contracture development and skeletal malalignment [13, 43]. Contracture management and GC use are the few published interventions that have changed the natural history of the disease [1, 44–48]; therefore, understanding the effects of shortening in specific muscle groups can be clinically meaningful.
Muscle imbalances and associated ankle contractures change the biomechanics of gait and may contribute to loss of ambulation [8, 49]. For example, a minimum of neutral ankle range of motion (0 degrees) allows for better vertical alignment of the body’s center of gravity in standing and assists in accomplishing foot clearance through the swing phase of ambulation [30, 32].
The 10MWT has been typically used to assess gait speed in DMD and is an important predictor in loss of ambulation [35]. For clinicians, understanding how TFTs, strength assessments, and ankle range of motion are associated with the loss of ambulation will help make proactive care management decisions, including timing of equipment or orthotic recommendations. In clinical trials, this information may be beneficial for trial design to determine the appropriate efficacy endpoint, study population, and timeline; as well as better explain variances in functional tests. Currently, there is minimal evidence to guide quality anticipatory physical therapy plans of care for contracture management.
Objective
The objectives of this study are 1. Describe ankle contracture onset and progression in boys with DMD and 2. Explore the impact of contributing factors such as ankle ROM, knee strength, age, and GC use on losses of functional abilities such as the ability to walk, supine to stand, and climb stairs.
METHODS
Data was collected through the CINRG Duchenne Natural history study, a consortium of 22 sites in over 9 countries. Design and methodology were based on previously published study design and methodology [50, 51]. All clinical sites had institutional or ethics review board approvals prior to data collection. Informed consent/assent was obtained for each participant and/or caregiver prior to study procedures. The study collected data from 440 individuals between 2006 and 2016. Assessments were performed at baseline and months 3, 6, 9, 12, 18, 24 (ambulatory) or months 6, 12, 18, 24 (non-ambulatory) followed by annual visits after year 3. Ambulatory status was based on reported full time wheelchair use(non-ambulatory). Historical and current GC use was obtained throughout the study. Contracture management information was not captured in the study. Each summary statistic calculated or statistical model performed used data from a subset of participants who had the requisite outcomes assessed. Result tables identify the number of participants who were part of each model or summary.
Standardized methods and training were observed throughout the trial for all physical therapy assessments to ensure consistency of measurements per previously published protocols [52, 53]. Data extracted for analysis included TFTs, specifically supine to stand (STS), climb 4 stairs (4SC), and 10 Meter walk/run (10MWT); fixed quantitative strength measures (QMT) of knee extension (KE)/flexion (KF); and passive range of motion (ROM) measurements which included knee extension and ankle dorsiflexion. Knee flexion and extension strength both were significant and equal contributors to TFT speed. Because of the dependency of KE and KF, we chose to use KE for analysis. Thus knee extension strength and ankle dorsiflexion ROM were reported as part of the analysis as key factors associated with TFT speed. TFT variables were assessed in seconds but expressed as speeds for analysis and reporting. ROM was measured in degrees, and QMT was measured in pounds (lb.) of force. For both ROM and QMT, the maximum value assessed from the right and left sides was used for all analyses.
Timed tests were measured using a standard stopwatch and Sammons Preston 4 stairs with bilateral handrails. Instructions included standard start and stop positions. All timed tests started with hands by side and feet within base of support. The end positions for supine to stand and stairs were the same as the start position. The 10MWT end position included when the patient’s first leg passed the 10-meter line. Fixed quantitative muscle testing (QMT) was assessed using the CINRG Quantitative Measurement System (CQMS), a strain gauge device mounted to a fixed system to measure maximal voluntary isometric contraction (MVIC), developed and validated as a reliable measure for strength in boys with DMD [52, 53]. Passive ROM measurements were assessed using a standard goniometer. Knee and ankle ROM were measured in supine (Fig. 1). Ankle ROM was measured in the best obtainable subtalar neutral position. Passive measurement into dorsiflexion was measured with positive values indicating more dorsiflexion, while negative values indicated loss of dorsiflexion from neutral (0 degrees). Methodology for all assessments followed a detailed manual and worksheets with standard test positions throughout the trial. All physical therapists participating in this study followed CINRG standards for certification including central training and support provided by the Central Evaluations Manager (CEM). Certification encompassed initial hands-on training and reliability testing, annual webinar to review data quality and reduce drift in administration of items, and bi-annual face to face hands-on meetings.

Passive range of motion testing procedures: all measured bilaterally
Statistical analysis was performed using STATA V15 (College Station, TX). Clinical outcomes in this study included range of motion assessments, knee strength, 10MWT, supine to stand, and 4-stair climb measures which were continuous and quantitative variables. Descriptive analyses were grouped based on the distribution of data.
For continuous measures, histograms, box and whisker plots and Q-Q plots were used to assess normality and the need for transformation of data. Normality was assessed using a combination of the Shapiro-Wilk normality test and visual inspection of histograms. Measurements were summarized for each visit including the 12-month change from the baseline assessment. The operational definition for a 12-month change is considered 305-426 days. If the outcome’s distribution was approximately normal, mean and standard deviation were reported. For non-normal distributions, median, minimum-maximum, and interquartile ranges were reported. For categorical data, frequencies and percentages were reported.
TFTs were collected using a standard stopwatch. Statistical analysis utilized the data expressed as speed: (1) 10MWT=m/s, (2) supine to stand = rise/second, and (3) 4 stair climb = 4 stairs/second. To get a true representation of the cohort, patients who lost the ability to perform the TFTs during the study were included in analyses by unit imputation of zero for the respective test. If the participant lost the ability to perform a task since the previous visit due to progression of disease, a value of 0 was entered for the first visit where they could not accomplish the task. The participant was then excluded for that test in subsequent visits. The three TFTs were treated independently.
Due to differences in definition for ambulation and steroid use, we operationally defined these descriptions in this study. Patients were considered non-ambulatory if they reported full-time wheelchair use at the time of the visit, or if they reported the age at which a wheelchair was used full-time. All other patients were categorized as ambulatory, encompassing both household and community ambulators. GC use was defined for each visit and based on patient report of GC use at time of the visit. Descriptive analysis also summarized the total duration of GC use up to each visit.
Summary statistics of both absolute values of knee extensor and ankle dorsiflexion and 12-month changes in knee extensor and ankle dorsiflexion were calculated and reported with several different categorizations. Summaries were calculated for each of the above-named outcomes, stratified by 4-year age groups and either GC use or ambulatory status. In these observational summaries, all available data points were used for each participant; therefore many participants contributed more than one observation per stratified group. The number of data points and the number of unique participants is reported for each stratified group. For summaries of 12-month changes, the GC and ambulation status at the beginning of the 12-month period were used for purposes of stratification. For this analysis participants were divided into the 5 stages based on age. For example, if a participant was 4.5 years old at the start of the 12-month period, they were included in the 0 to 4.9 year age group, even though they were older than 4.9 years at the end of the interval.
To assess the change in knee and ankle ROM over time and the effect of GC use, we performed mixed models with repeated measures. Each model included the ROM outcome as the dependent variable, age (representing time) as the independent variable, and a random coefficient for each participant. Models were run separately for those currently using GCs and those who were not. A third model assessed an interaction between age and GC use.
To assess the relationship between knee extensor strength, knee ROM, and ankle dorsiflexion ROM and functional ability, we again used mixed models with repeated measures. The goal was to assess how useful these strength and ROM assessments are at predicting functional abilities (i.e. the 10 meter walk, climb stairs, or stand from supine). In each model, the functional ability was considered the dependent variable, and strength or ROM was the independent predictor. Age and GC use (yes/no dichotomous variable describing use at the time of the visit) were included as covariates. Each model included a random coefficient for each participant. Models included only data on participants who were defined as ambulatory at the time of the visit. The models allowed us to assess the relationship between the predictor and the dependent variable while allowing for multiple related assessments per participant. Each model provided an estimate of the amount of change in functional outcome that can be attributed to the predictor, while accounting for covariates and repeated measurements taken on the same participants. In addition, the model provided a significance test for each predictor. Several models were built. These included models where 1) 10MWT, STS, 4SC speed was defined as the dependent variable; and the absolute value of knee extensor strength, knee ROM, or ankle ROM was the independent predictor and 2) the 12-month change in 10MWT, STS, 4SC speed was the dependent variable; and the 12-month change in knee extensor strength, knee ROM, or ankle ROM was the independent predictor.
Patient demographics
Lastly, to assess the combined effect of knee extension strength and ankle ROM on functional ability, three additional mixed effects linear regression models were performed. Variables used were based on known clinical observations and published research on significant predictors of functional decline in DMD [1, 51]. In these models, both knee extension strength and ankle ROM were included as independent predictors and walking speed, climbing speed, or standing speed was the dependent variable. Models again included covariates for age and GC use and a random coefficient for each participant.
RESULTS
A cohort of 440 participants and 1321 observations were used for analysis. Patient demographics are in Table 1. Glucocorticoid use was stratified based on duration on drug with 18.7%with < 6 months or naïve; 4.3%<1 year; 58.0%1 < 10 years; and 19.3%between 10–25 years of GC use.
CQMS Quantitative Muscle Testing (QMT) positioning
Glucocorticoids appear to influence ankle ROM in boys beginning at age 9, since those taking GCs have a greater observed ankle ROM than those not taking GCs. Figure 2 shows the summary statistics of ankle ROM by age and stratified by GC use. Table 3 reports the statistical comparison of ankle ROM over time in ambulatory and non-ambulatory boys. Boys who were ambulatory demonstrated more dorsiflexion ROM compared to the non-ambulatory group, with the greatest difference in ROM (25 degrees) in the 12.0–16.9 years age band. For those who are ambulatory, the median value for any participant who was still ambulatory was –10 degrees (Table 3). Ankle and knee contractures were observed to increase after ambulation was lost based on typical age at loss of ambulation. Figure 3 shows the effect of GC use on ankle ROM where there is a steep decline over time in those not taking GCs. Ankle ROM declined an average of –3.28 degrees per year in those not taking steroids, but only –1.86 degrees per year in those taking steroids (Table 4).
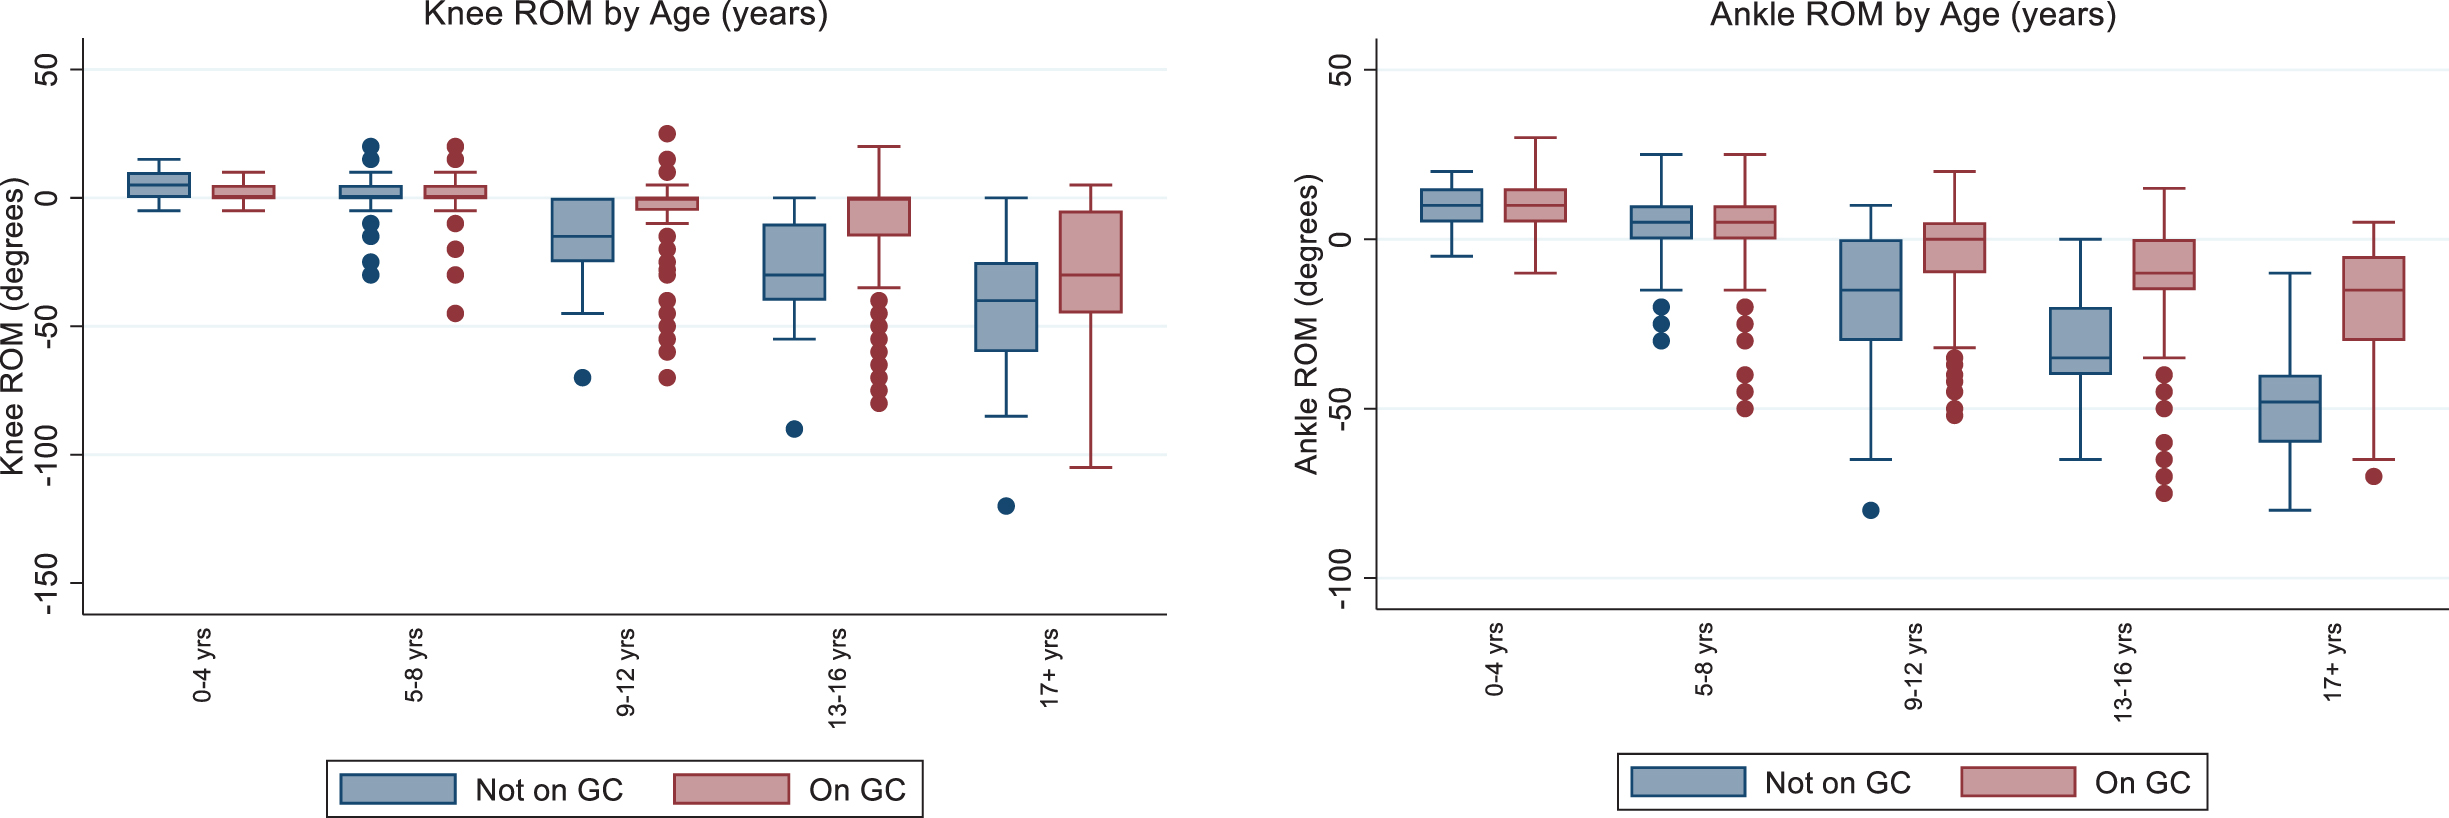
ROM stratified by GC use. Abbreviations: GC = Glucocorticoid, ROM = Range of Motion.
Summary statistics of ankle dorsiflexion measurements by age
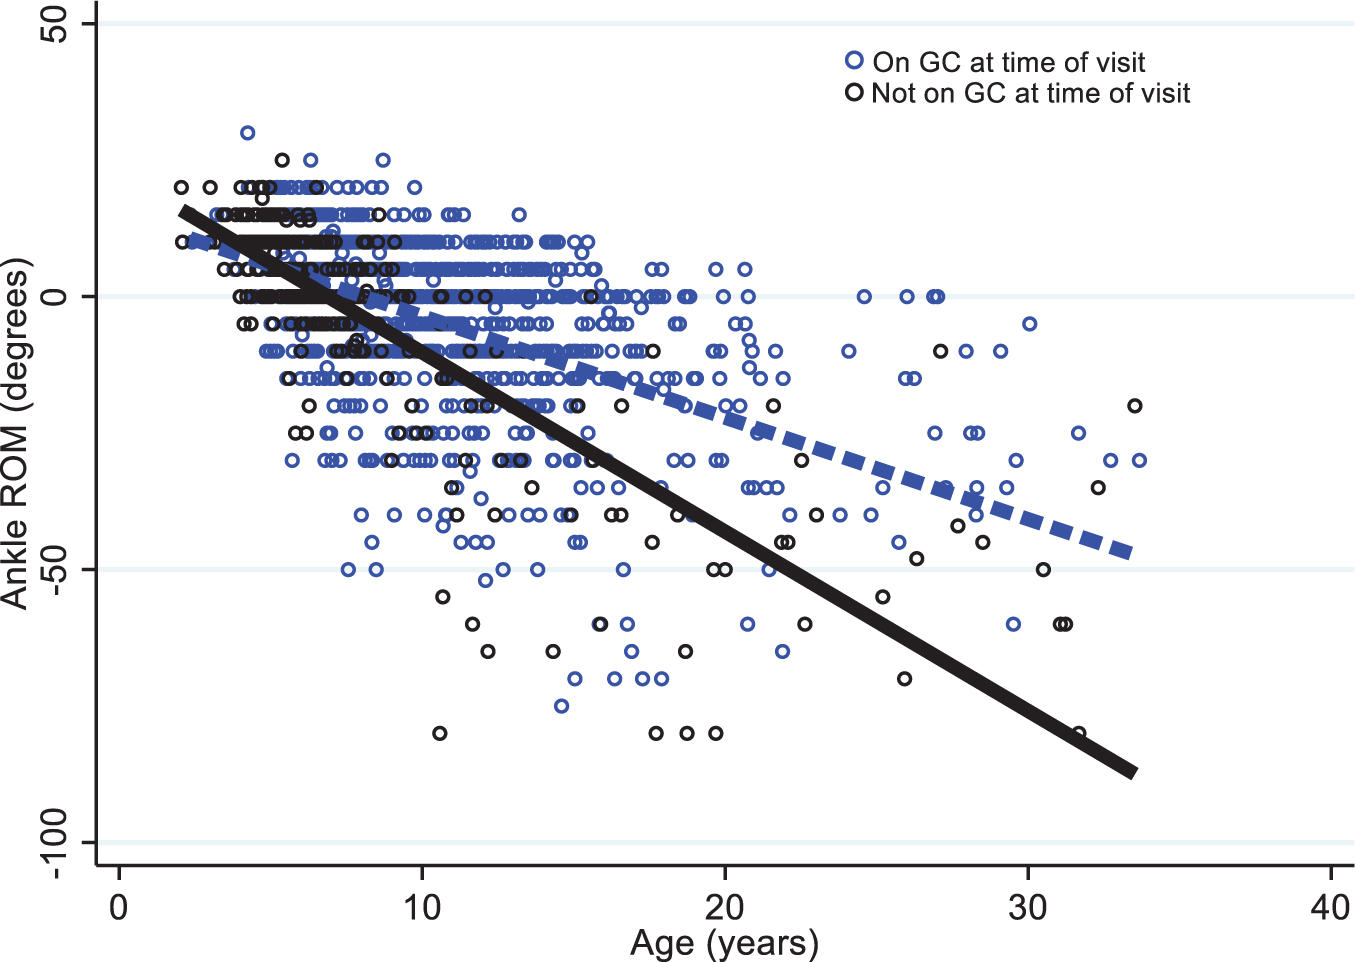
Change in ankle ROM over the study stratified by GC use.
12 Month change in ROM over time stratified by GC use
Progression of contractures over a defined 12-month period for both knee and ankle ROM showed very minimal changes for either ambulatory or non-ambulatory groups Fig. 4 shows the 12-month change in ankle ROM by age and ambulatory status and indicates very little change for all groups.
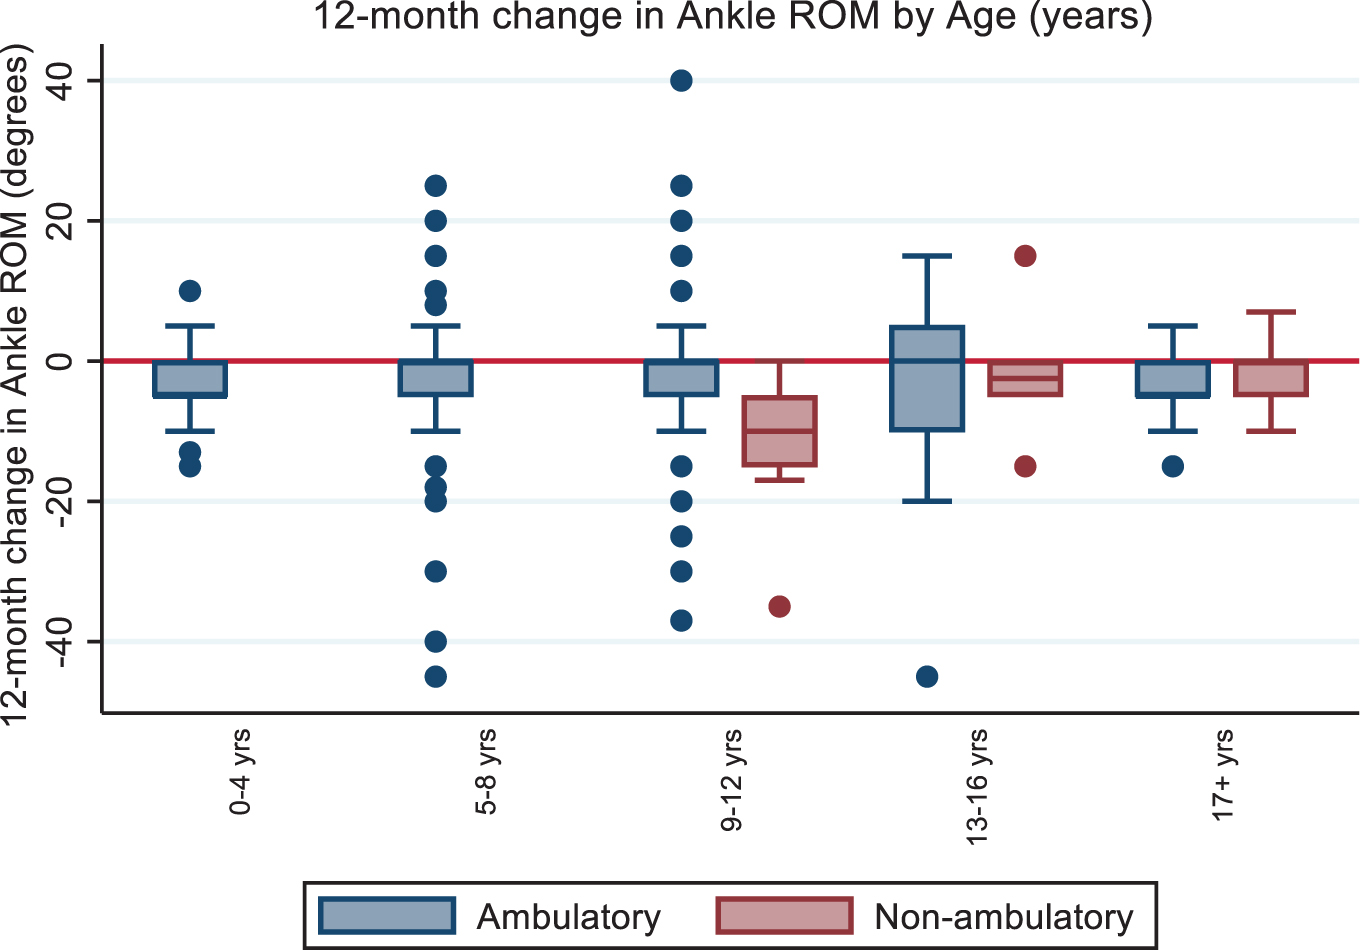
12-month changes of ankle ROM stratified by ambulatory status.
Assessing the relationships between ROM and other functional outcomes over the life span indicated that QMT, ROM, age, and GC use are all key variables that are significantly related to a decrease in functional ability. However, we found that knee extension strength and ankle ROM were primary indicators of TFT speed. This study found that once accounting for age and GC status, TFT values were significantly predicted by knee strength and ankle ROM. The results of these mixed effect linear models for the 10MWT are shown in Table 5. This demonstrates that an increase in knee strength or ROM predicted a statistically significant increase in walking speed. When evaluating the combined predictive effect of knee extensor strength and knee ROM (Table 6), knee extensor strength predicted the greatest change in speed. A single pound increase in knee extensor strength predicted a 0.042 m/s increase in walking speed whereas a single degree of improvement in ROM predicted only a 0.009 m/s increase in walking speed. In all cases, speed significantly decreased with age and in boys who were not currently on GCs. We did assess changes in ROM over a 12-month period, the typical length of an interventional clinical trial, although due to small changes in ROM over a 12-month period of this analysis, there were no significant relationships with change in ROM with TFT performance nor was there a significant effect of GC use in this short time frame.
Strength and ROM as independent predictors of 10MWT speed
The combined effect of Knee Strength and ROM on TFT
DISCUSSION
This longitudinal study describes the onset and progression of ankle contractures and knee strength on timed function tests in the era of GC use in boys with DMD. With the alteration in the disease course from the standard use of GC for disease management and the recent developments in drug therapies, there has been great interest in understanding the downstream effects of contractures on strength and function across the spectrum of disease progression. Once an individual becomes non-ambulatory, there is increased economic burden on the family and increased risk for secondary issues such as the development of scoliosis, osteoporosis, obesity, disuse atrophy, increased rate of contracture development, and psychosocial issues related to the loss of function. Understanding the variability in contractures and strength allows for more personalized anticipatory care and justification for rehabilitation-related interventions that have been associated with reducing the effects of contractures, such as night-time orthoses [54], serial casting [55–57], frequency of stretching [58, 59], and timing for ordering mobility equipment.
Of all the 3 TFT, gait has been the most studied in DMD, showing slower walking rates compared to healthy controls as early as 4 years of age [60]. Our study validated other findings of key markers to loss of ambulation including knee strength and ankle contractures [6, 61–63]. Gait analysis consistently shows premature forefoot initial contact due to the lack of a dorsiflexion moment at initial contact, leading to an early plantarflexion moment during stance which may be a key gait indicator in DMD [15, 64]. This plantarflexion moment observed in early stance phase results in an anterior ground reaction force creating vertical power generation that is higher than normal controls, contributing to the ability to maintain upright despite severe muscle weakness at the hips and knees [16–18, 65]. This may be explained by looking at plantarflexion tightness, observed early in boys with DMD and particularly at maximal stretch into dorsiflexion. At toe off where estimated passive moments (EPM) diverged from normal controls starting at –5 to –10 degrees of dorsiflexion ROM with peak EPM noted at –14 degrees [15]. Houx et al [66] found that -10 degrees of dorsiflexion was the threshold at which gait kinematics changed for typically developing children. For children with muscle weakness, these gait changes could be detrimental in maintaining ambulation. The results of our study support the kinematic findings from Houx et al. [66] indicating that –10 degrees may be a critical value of dorsiflexion loss that puts weaker boys at greater risk of losing ambulation. For boys with DMD, this is further complicated by the combination of physiological strength loss, imbalance, and contractures; leading to the need to better understand the interaction between strength and contractures on functional mobility.
Kiefer et al. [63] found that decreased ankle ROM resulted in lower Northstar Ambulatory Assessment scores, a 17-item functional assessment of gross motor skills such as walking, standing, and jumping validated in boys with DMD. This is also supported by 3-D gait analysis by Romano et al. [64] showing high correlation of ankle ROM to NSAA and 10MWT. Akkurt et al. [67] also assessed timed function tests including the 6MWT and found a moderate significant correlation of ankle ROM with TFTs. An older study by Mendell et al. [44] initially found positive effects of GC on strength and function with no changes on contractures; however, based on our results, we believe 6 months may not be long enough to understand functional impacts on contractures. In our study of 12-month change in ankle ROM and TFTs, we did not find a significant relationship. This may be due to the very small ROM changes over a 12-month period and suggests that 12 months may be too short of a timeframe to see changes in contracture progression even though strength does show significant declines during this period. Our results showed, for the first time, possible impact of GC use on progression of ankle contractures. The results are consistent with MRI findings explaining the pathophysiological impacts of GC on muscle in boys with DMD, including reductions in fat accumulation, inflammation and fibrofatty infiltration in muscle [13] that may have an impact on contracture development alongside strength declines [68].
Ankle ROM was similar among boys in the early ages of the disease, but those who were GC naïve appeared to develop ankle contractures at a faster rate, indicating that GC treatment may affect contracture progression in a way that may directly impact care management, especially for those who are not using GC as part of their standard of care.
Previously published studies have associated speed required to complete timed tests (supine to stand, 4-stair climb, and 10MWT) with loss of function in DMD [1]. Gait speed is determined by the power generated within the gait cycle. Gait speed has shown to modify ground reaction forces and kinematics in pediatric gait [69]. Despite the increasing literature on DMD gait, there still lacks consensus on the interpretation of some of these findings due to differences in measurement methods, variables assessed and analytic procedures [70]. Another possible explanation is the high variability in strength imbalances seen in boys with DMD, as well as the fact that published studies are on small sample sizes. Consistencies across a few studies confirm that boys with DMD have a slower gait pattern with decreased step length, early foot strike at stance, and a difference in energy generation versus absorption phases compared to normal pediatric gait [17, 64, 71].
Our findings found that KF and KE had a significant magnitude of impact on gait speed but without gait analysis we were unable to determine the relationship between KF and KE. However, the findings were consistent with our understanding of joint coupling required for gait speed between knee strength and ankle ROM. Decreased gait speed in DMD may be due to multiple factors, including decreased step length from decreased hip/knee extensor strength that results in a faster walking cadence. Additionally, the center of gravity in boys with DMD always falls anterior to the ankle, making the hip extensors work even harder. Gaudreault et al, however argue that the knee extensors may play a larger role in DMD gait due to the anteriorly displaced ground reaction force at the knee causing a lack of the initial extension moment, with extensor weakness impacting eccentric control and forcing the knee to be in constant extension to ensure joint stability throughout the gait cycle [17]. In a study looking at EMG activity during gait, Ropars et al. [72] found that the quadriceps and hamstrings were active throughout most of the gait cycle in boys with DMD supporting need for stability around the knee joint. With multiple factors associated with possible loss of ambulation in boys with DMD, Barnard et al. [19] had consistent MRI findings showing that lower fat fraction in one of the primary knee extensors, the vastus lateralis, was a key indicator of 10MWT speed which has been associated with loss of ambulation.
One of the primary limitations in this study is that it is a natural history study. Therefore, factors such as GC and contracture management were not controlled. Interventions that may impact contractures such as stretching and orthoses were not assessed and therefore not accounted for in the analysis, which may have an impact on progression. Additionally, our study measured MVIC strength values instead of torque, which accounts not only for strength but also extremity length and may have better correlation with function. Additionally, we did not measure QMT strength of hip muscles or ROM that may impact gait in terms of the ability to reach full terminal stance. Gait is a complicated multifactorial task requiring dynamic coupling between the hip, knee and ankle joints; therefore our findings may not be extrapolated into fully understanding gait in DMD. For individuals without DMD, loss of ankle dorsiflexion of > 10 degrees affected the kinetics and kinematics of gait [66]. For boys with progressive muscle weakness, this may contribute to increased risk for losing ambulation. Future studies should consider performing gait analysis with electromyography to better understand the interaction of muscle activation, torque-based strength and contractures on gait kinematics and function.
CONCLUSION
There is a great degree of variability in contracture development in boys with DMD, especially in the GC era. Our study found that ankle and knee ROM was better for those on GC and influenced long-term progression rates. However, the minimal progression of contractures in our study when limited to 12-months may be indicative of the 1-year period being too short to assess changes in contractures.
Significant factors affecting functional speed include QMT knee strength, ankle ROM, GC use, and age, with knee strength having more of an impact than ankle ROM. Results from this long-term follow up of DMD boys show that knee strength along with management of contractures are important to maintain the speed of walking, climbing stairs and supine to stand. These results contribute to improved understanding of GC on the impact of progression of knee strength and ankle ROM on the DMD disease trajectory, providing an important piece of the puzzle that is needed to better comprehend the complex dynamics of factors that result in loss of function in boys with DMD.
Footnotes
ACKNOWLEDGMENTS
University of California Davis –
Sundaram Medical Foundation and Apollo Children’s Hospital, Chennai –
Holland Bloorview Kids Rehabilitation, Toronto –
Alberta Children’s Hospital, Calgary –
Queen Silvia Children’s Hospital –
Children’s National Health System –
Royal Children’s Hospital –
Hadassah Hebrew University Hospital –
Instituto de Neurosciencias Fundacion Favaloro –
Mayo Clinic –
Children’s Hospital of Pittsburgh of UPMC and the University of Pittsburgh –
Washington University –
Children’s Hospital of Virginia –J. Teasley, S. Blair, B. Grillo, K. Jones, E. Monasterio;
University of Tennessee –
Children’s Hospital of Westmead –
University of Alberta –
University of Puerto Rico –
Centro Clinico Nemo –
Texas Children’s Hospital –
University of Minnesota –
The CINRG Coordinating Center –
FUNDING
U.S. Department of Education/NIDRR (#H133B031118, #H133B090001) U.S. Department of Defense (#W81XWH-09-1-0592) National Institutes of Health (#UL1RR031988, U54HD053177, #UL1RR024992, #U54RR0 26139, #2U54HD053177, #G12RR003051) Parent Project Muscular Dystrophy