
Abstract
Background:
Molecular interaction networks (MINs) aim to capture the complex relationships between interacting molecules within a biological system. MINs can be constructed from existing knowledge of molecular functional associations, such as protein-protein binding interactions (PPI) or gene co-expression, and these different sources may be combined into a single MIN. A given MIN may be more or less optimal in its representation of the important functional relationships of molecules in a tissue.
Objective:
The aim of this study was to establish whether a combined MIN derived from different types of functional association could better capture muscle-relevant biology compared to its constituent single-source MINs.
Methods:
MINs were constructed from functional association databases for both protein-binding and gene co-expression. The networks were then compared based on the capture of muscle-relevant genes and gene ontology (GO) terms, tested in two different ways using established biological network clustering algorithms. The top performing MINs were combined to test whether an optimal MIN for skeletal muscle could be constructed.
Results:
The STRING PPI network was the best performing single-source MIN among those tested. Combining STRING with interactions from either the MyoMiner or CoXPRESSdb gene co-expression sources resulted in a combined network with improved performance relative to its constituent networks.
Conclusion:
MINs constructed from multiple types of functional association can better represent the functional relationships of molecules in a given tissue. Such networks may be used to improve the analysis and interpretation of functional genomics data in the study of skeletal muscle and neuromuscular diseases. Networks and clusters described by this study, including the combinations of STRING with MyoMiner or with CoXPRESSdb, are available for download from https://www.sys-myo.com/myominer/download.php.
Keywords
INTRODUCTION
The implementation of functional genomics approaches that use molecular interaction networks (MINs), sometimes called ‘network medicine’, can help to define disease-associated genes and pathways, and could contribute to the discovery of novel or improved biomarkers and drug targets [1–6]. MINs are comprised of known functional associations between molecules, and it can be useful to distinguish between direct physical binding between proteins (protein-protein interactions; PPIs) or other molecules (e.g. transcription factors, RNA interactions) and other types of functional relationship such as: co-expression of genes across samples and/or conditions; genetic interactions; observed physical colocalization within the cell or tissue; participation to the same pathway or pathways; and assumed functional similarity based on shared sequence or folding of protein domains [7, 8].
Physical interaction networks represent the physical contacts between proteins. With much of the critical machinery for biological processes consisting of stable protein complexes, it has been suggested that studying the structure of protein networks can identify key contributors to disease mechanisms [9]. Physical interaction databases avail of the development of many high throughput methods for the study of experimentally proven PPIs, such as yeast two-hybrid (Y2H) and tandem affinity purification coupled to mass spectrometry (TAP-MS), bolstered with computational predictions from evidence such as phylogenetic profiling methods, to define systems-wide interactions in species [10, 11]. Studies have shown the utility of identifying proteins in PPI networks that interact with known disease gene products. Proteins encoded by genes known to be involved in a disease tend to have a higher likelihood of PPIs with genes associated with similar disorders, indicating the presence of shared disease subnetworks among similar disease phenotypes [12–15]. Driver nodes for cancer survivability-essential proteins could be defined via PPI networks, and this allowed for screening of FDA-approved cancer therapies to target the highlighted driver nodes, including cancer therapies not normally applied in the cancers under investigation [16].
Networks constructed from other types of functional interaction aim to capture relationships between genes that share similar or related biological functions [7]. Gene co-expression networks define the pairwise relationships among gene transcripts via their coordinated expression patterns across microarray and/or RNA-sequencing (RNA-seq) profiles. Different measures of co-expression have been used to construct such networks, such as Pearson’s or Spearman’s correlation, least absolute error regression and Bayesian approaches [17]. Genes involved in related biological processes tend to show co-expression of their expression profiles [18]. Large amounts of transcriptomic data suitable for gene co-expression construction are available for a multitude of tissues and diseases, such as from the two main public repositories, NCBI Gene Expression Omnibus (http://www.ncbi.nlm.nih.gov/geo/) and ArrayExpress (https://www.ebi.ac.uk/arrayexpress) [19, 20]. The utility of studying gene co-expression networks has been demonstrated in multiple studies. For example, gene co-expression network analysis of microarray data in rheumatoid arthritis identified modules of key genes related to immune response, inflammatory response, and homeostasis, resulting in the identification of two small-molecule drugs as potential therapeutics [21].
The majority of molecular interaction databases agglomerate interaction data from all tissues for a given organism, in this sense being tissue-generic. While many of these databases offer a comprehensive list of generic molecular interactions, it has been suggested that this may limit their functionality when studying a disease from a tissue-specific context [22]. Increasingly, molecular interaction databases are incorporating tissue or condition specific molecular interaction data. Many genetic disorders manifest primarily in one or a few tissues [23, 24]. Furthermore, it has been observed that molecular interactions are generally variable from tissue to tissue [25–27]. As a consequence, if the disease pathophysiology is known to occur within a defined tissue or set of tissues, it may be desirable to adopt tissue-specific molecular interaction networks in the study of a disease.
In the present study, we adopt network medicine approaches to identify molecular networks with the optimal representation of skeletal muscle (SM) functional associations. MINs from a variety of predefined sources are compared based on the ability to capture muscle-relevant genes and gene ontology (GO) terms, tested in two different ways using two established biological network clustering algorithms, DIAMOnD [28] and DSD [29, 30]. After identifying the best performing single-source molecular interaction networks, combined networks derived of different sources are then tested.
MATERIALS AND METHODS
Molecular network data
To compare the performance of MINs, representing a mix of functional association types and tissue-specificity, an appropriate range of sources had to be selected. A summary of the MINs chosen for this step, their interaction type, source and network attributes can be found in Table 1. MINs containing large numbers of interactions can be computationally intensive to analyse. For this reason, for MINs with a large number of interactions, we have sorted the interactions by their interaction evidence score (i.e. edge weight) and taken the top 5,500,000 interactions as the largest network size. We also tested a range of edge weight cut-offs to examine the effect of edge evidence scores on network clustering. The results of clustering networks of varying edge score weight cut-off can be viewed in the supplementary materials (Figure S1). When selecting networks based on performance, priority was given to larger MINs as these contained the most interaction information, except if a smaller filtered network had a clear increase in performance with either DIAMOnD or DSD. As different network sources used varying methods to define edge weights, all network edge weights used in this study have been rescaled between 0 –1, with 1 representing the interaction with the highest edge weight score for a given network, in order to ensure that the different methods used to define edge weights would not bias the distance metrics applied by the clustering algorithms.
Sources of functional associations
Physical interaction data
To use as a PPI network (tissue-generic), we downloaded the full protein interaction network from the STRING database v10.5 (https://string-db.org/) for Homo sapiens. STRING integrates known and predicted protein-protein interactions for both direct (physical) and indirect (functional) associations, and converges multiple resources and evidence streams to define a confidence score for a given PPI. These include data from genomic context predictions, high-throughput lab experiments, gene co-expression, automated text mining of published literature and previous knowledge databases [31, 32]. The STRING network contains protein interactions in the Ensembl Protein identifier format. Updates to Ensembl are more frequent than to STRING, so that numerous Ensembl Protein identifiers contained in the network download have been made redundant or have been updated to a new identifier. To account for this, we mapped all Ensembl Protein identifiers to their current identifier or removed those that have been made redundant via the Ensembl ID History Converter (http://www.ensembl.org/Homo_sapiens/Tools/IDMapper). We updated all Ensembl protein identifiers to be aligned to the Ensembl 98 release. Ensembl protein identifiers distinguish isoforms, so that there may be multiple identifiers for a given gene. Since we are working at the gene or pathway level, we converted the STRING network Ensembl protein identifiers to their equivalent HGNC symbols, using the Biomart Ensembl web interface (https://m.ensembl.org/biomart/martview/) [33], producing a gene level representation of the STRING network. The STRING edge confidence scores are on a scale between 0 –1000, with 1000 representing the maximum confidence of an interaction occurring, based on various sources of evidence. The edge weights were rescaled between 0 –1 to ensure consistent edge weights for all networks in the study. The edge-weight filtered, gene-mapped, and edge-weight scaled network was used in the subsequent analysis. Three variations of the STRING network were used: the full network of ∼5.5 million interaction (“STRING 5mil”), the top 2 million interaction by evidence score (“STRING 2mil”), and the top 800,000 interactions by evidence score (“STRING 0.8mil”).
A second PPI network was IID [34], which provides a set of context-specific human PPI networks for human tissues and diseases sourced mainly from curated PPI databases and predicted protein interactions. In that resource, gene expression profiles for tissues were determined from 20 gene expression datasets downloaded from NCBI GEO and a PPI was considered tissue-specific if the two encoding genes were expressed in a tissue above a desired threshold of mas5 normalized expression > = 200 [20, 34] [35]. The Human IID network was downloaded from the IID database version 2018-11 (http://iid.ophid.utoronto.ca/). The IID network PPIs are defined as being present or not within a specific tissue. The network interaction file was filtered to contain only those protein interactions marked as present in skeletal muscle (“SM” in the file). No weighting to the PPI was defined and all interactions have an equivalent edge weighting of 1. The filtered skeletal muscle IID network comprised ∼600,000 interactions and is referred to as “IID SM 0.6mil”.
HumanBase [36] captures functional interaction data from a variety of sources, such as PPIs, transcriptional regulation and gene expression data, to model tissue-specific gene interactions. The authors of Humanbase constructed tissue-specific networks by integrating tissue-specific functional knowledge to a gold standard tissue-naïve network [27], and each edge of the network was scored via a posterior probability value that was used to rank the edges by strength of evidence. The skeletal muscle full edges network was downloaded from HumanBase (https://hb.flatironinstitute.org/download). The full edges network is a fully connected network containing edges with evidence to support a SM tissue-specific functional interaction. The scale of the edge weights are between 0 –1 with 1 representing those edges with known SM tissue-specific interactions. As the downloaded network was particularly large, we sorted the network interactions by the posterior probability score provided by Humanbase and took the top 5,500,000 interactions as the largest network (which is similar in size to the full STRING network). This skeletal muscle HumanBase network is referred to as “HumanBase SM full 5.5mil”).
Gene co-expression data
As a gene co-expression network (tissue-generic), human gene co-expression data from the co-expressed gene database (COXPRESdb) was used [37]. At the time of this study, COXPRESdb utilised gene co-expression data from 11 animal species supported by 23 co-expression platforms, incorporating both microarray and RNA-sequencing transcriptomic data [38, 39]. We downloaded the human “Has-u.c2-0” gene correlation table from the COXPRESdb website (https://coxpresdb.jp/download/), which encompasses a union of both the microarray and RNA-seq data available for humans via COXPRESdb. COXPRESdb ranks co-expression between a pair of genes using mutual rank (MR). For a given gene pair, the rank of the correlation coefficient for each partner is calculated among the co-expressed genes of its partner. MR is defined as the mean average of the two ranks [40]. As lower MR values represent gene pairs with the highest correlation coefficient average, the MR were –log10 transformed to inverse the scale and the resultant values were rescaled to contain edge weights between 0 –1. The number of co-expressed interactions was particularly large, so the co-expressed genes were sorted by MR and the top 5,500,000 were taken as the largest network (which is similar in size to the full STRING network) and referred to as “COXPRESdb 5.5mil”. Two smaller version were also prepared, taking the top 2 million (“COXPRESdb 2mil”) and top 800,000 (“COXPRESdb 0.8mil”).
As a muscle tissue-specific gene co-expression network, a skeletal muscle gene expression matrix from the Genotype-Tissue Expression (GTEx) project database was used. GTEx was designed as a resource for the study of correlation between genetic variation and tissue-specific gene expression profiles, in tissues taken from patients with no apparent disease [41, 42]. From the GTEx portal for GTEx analysis V8 (https://www.gtexportal.org/home/datasets), we downloaded the post-processed, filtered and normalized gene expression matrix for “Muscle_Skeletal” tissue. These gene expression matrices were the input to the expression quantitative trait loci (eQTL) mapping analysis described by the GTEx authors. Detailed methodology on how the expression matrices were produced is available at https://www.gtexportal.org/home/documentationPage under the “eQTL Analysis” tab. From this gene expression matrix we generated a gene co-expression network, using the R package “psych” to define the Pearson correlation and correlation significance between each gene pair of the gene expression matrix [43, 44]. Multiple testing correction for the correlation significance was applied using the Benjamini-Hochberg procedure with an alpha value of 0.05. We set a correlation significance cut-off for each gene-gene co-expression interaction at an adjusted p-value equal to or less than 0.05. The resultant gene co-expression network was sorted by the Pearson’s correlation coefficient value (either positive, r, or absolute value, |r|) and 6 networks were produced depending on a range of cut-off thresholds (the lowest r threshold being chosen so as to avoid overly large network sizes of > 5.5 million edges): r > = 0.5; |r| > = 0.5; r > = 0.6; |r| > = 0.6; top 1 million interactions ranked by r; top 1 million interactions ranked by |r|. Subsequently these 6 networks are referred to, respectively, as: GTEx SM r > = 0.5+; GTEx SM r > = 0.5 + /–; GTEx SM r > = 0.6+; GTEx SM r > = 0.6 + /–; GTEx SM top 1mil+; and GTEx SM top 1mil+/–.
Another source of muscle-specific gene co-expression data is the database underlying the MyoMiner resource (https://sys-myo.com/myominer). MyoMiner is a striated muscle specific database which provides filtered and processed gene co-expression data for both normal and pathological tissues constructed from vast amounts of human and mouse microarray data [45]. The database contains separate co-expression data on 142 categories of human, mouse or cell samples further grouped by age, sex, anatomic part, and experimental or disease condition. From the MyoMiner database we extracted two gene co-expression networks, representing human whole muscle tissue (from biopsies) and human muscle cells (cultured myoblasts and myotubes). All gene co-expression interactions contained a Pearson’s correlation r value and a correlation significance q-value. Any interaction present in the networks had a correlation significance q-value < = 0.05. To remove noise introduced by gene-gene co-expression interactions with low Pearson’s correlation coefficient, we applied r value cut-offs. We created multiple versions of both the MyoMiner muscle cell network and the MyoMiner whole muscle network based on different cut-offs of Pearson’s correlation coefficient values (positive, r, or absolute, |r|; the lowest r thresholds being chosen in each case so as to avoid overly large network sizes of > 5.5 million edges). Six versions of the MyoMiner cell network were created: r > = 0.6; |r| > = 0.6; top 1 million interactions ranked by r; top 1 million interactions ranked by |r|; top 5.5 million interactions ranked by r; and the top 5.5 million interactions ranked by |r|. Similarly, but with modified cut-offs owing to the different distribution of edge weights, six versions of the MyoMiner whole muscle network were created: r > = 0.7; |r| > = 0.7; top 1 million interactions ranked by r; top 1 million interactions ranked by |r|; top 5.5 million interactions ranked by r; and the top 5.5 million interactions ranked by |r|. Subsequent to this, the 12 MyoMiner networks described above are referred to, respectively, as: MyoMiner Cell r > = 0.6+; MyoMiner Cell r > = 0.6 + /–; MyoMiner Cell top 1mil+; MyoMiner Cell top 1mil+/–; MyoMiner Cell top 5.5mil+; MyoMiner Cell top 5.5mil+/–; MyoMiner SM r > = 0.7+; MyoMiner SM r > = 0.7 + /–; MyoMiner SM top 1mil+; MyoMiner SM top 1mil+/–; MyoMiner SM top 5.5mil+; MyoMiner SM top 5.5mil+/–.
Skeletal muscle gene ontology terms
To test for recovery of muscle-related gene functions between the various networks, we needed to define an appropriate list of gene sets representative of skeletal muscle processes. The Molecular Signatures Database (MSigDB) is a comprehensive manually reviewed and curated database of gene sets used primarily for gene set enrichment analysis [46]. From MSigDB we selected eleven muscle-relevant gene sets from the C5 collection representing the Gene Ontology (GO). Table 2 gives the name of the muscle-relevant gene sets selected, their GO category and the number of genes present in each gene set. These gene sets were subsequently used as input for the DIAMOnD recall analysis and tested for enrichment in network clusters produced by the DSD Kernel clustering algorithm, as measures of network performance.
Properties of the individual MINs selected for combination
Kernel clustering with diffusion state distance (DSD)
A measure of network performance was to test for enrichment of muscle GO terms among network clusters. To define MIN clusters we applied a kernel clustering method based on the Diffusion State Distance (DSD) metric, designed by Cao et al. [29, 30]. DSD is a novel graph metric built on the premise that nodes are more functionally related if they share paths with nodes of low-degree (fewer connections) relative to if they shared paths with nodes of high-degree (more connections). The DSD metric is used to produce a similarity matrix on which a spectral clustering algorithm is applied. This method, and the source code used, were taken from the top performing network modularization method in the Disease Module Identification (DMI) DREAM Challenge [47]. The source code and method description are available at https://www.synapse.org/#!Synapse:syn7349492/wiki/407359. The spectral clustering algorithm applied requires a parameter k specifying the number of cluster centers. We chose an initial value for k as 100. The resultant network clusters varied greatly in size, with some clusters being below 5 and other clusters being above 300. The spectral clustering method deploys a recursive clustering method to split network clusters above a desired threshold. For this we recursively split MIN clusters of size greater than 300 until they satisfied this threshold. Clusters containing 5 nodes or less were discarded. Once the network clusters were defined, each separate cluster was then subjected to gene set enrichment analysis using Fishers exact test against each of the 11 skeletal muscle relevant GO gene sets taken from MsigDB. As this involves testing for the enrichment of GO terms across a large number of defined clusters, we applied a Benjamini-Hochberg multiple testing correction with alpha 0.05. For a given network, the top enrichment score for each muscle GO term could then be identified from among the DSD-generated clusters. The performances of the networks could then be compared based on these top enrichment scores.
Recall analysis with the disease module detection algorithm (DIAMOnD)
As a second measurement of performance between networks, the Disease Module Detection (DIAMOnD) algorithm was used. DIAMOnD was designed to identify disease modules iteratively constructed around a set of known disease genes. The authors of DIAMOnD identified a parameter called connectivity significance as being the most predictive topological property for the identification of disease modules. The DIAMOnD algorithm applies the hypergeometric distribution function to define the probability of a given node with K edges, having KS edges with a set of S seed nodes [28]. To define the connectivity significance of a node to the seed list, the cumulative probability for the node having KS or more edges with the seed set is calculated. This defines the p-value to describe if a node has more edges to the seed set than would be expected. The benefit of using connectivity significance as a measure of association to a list of seed genes is that this reduces the detection of spurious nodes of high degree (i.e. number of connections) –in simple terms, connectivity significance indicates how unlikely it is for a gene to interact with a disease gene given the number of other interactions possessed by each of the two genes. The DIAMOnD algorithm takes as input a network edge list, a list of seed nodes, a value of alpha to weight edges with seed nodes, and a value N for the number of nodes to be iteratively added to the given set of seed nodes. As output the DIAMOnD algorithm produces a list of nodes from 1 to N, with 1 being the node with the highest connectivity significance to the seed nodes and the subsequent nodes having the highest connectivity significance to the expanding disease module.
We performed recall analysis with the DIAMOnD algorithm in order to rank networks based on the level of recall of muscle-related genes. Recall analysis features in the original DIAMOnD paper and involves taking a set of seed nodes and randomly removing a percentage (e.g. 10%, 20%or 30%) of the seed node list. Each resultant reduced seed list is then used as input to the DIAMOnD algorithm, which is then applied to each of the networks to be compared. The percentage of removed nodes that were recovered by DIAMOnD (i.e. that were present in the disease module identified by DIAMOnD after a set number of iterations) was taken as an indication of the ability of that network to enable recovery of muscle-relevant genes. In theory, for a set of highly functionally related seed nodes (such as those of the skeletal muscle GO terms that we used, which are all involved in the same biological process or in the same cellular component), it would be expected that a high percentage of the removed seed nodes would be recalled. For each seed list, we calculated the average percentage recall for 100 permutations, randomly removing 10%, 20% and 30% of the seed nodes, respectively, then averaging across each. We set input parameter of N in the DIAMOnD algorithm to 200 iterations. That is, the recall percentage is calculated as the percentage of the removed seed nodes that are returned after 200 iterations of the DIAMOnD algorithm.
Combining networks for optimization
Once network performance had been measured and compared, we then combined selected PPI networks with selected gene co-expression networks, to test if an optimal network could be defined, which would offer an optimal recall of muscle genes and muscle-related GO terms. For this we introduced 2 basic combinatory procedures. These were: Node filter –Similar to a gene expression filter. For any node pair in a PPI network, if those nodes are found in the gene co-expression network being combined, that node pair is carried forward. Union –The union is the simple combination of both networks, with the removal of duplicate node edges.
For the combinations applied in this study, the network edge weights were not carried forward in the combined networks. Any network edge present in the combined networks had, or was assigned, a value of 1. A schema summarizing the methodology for the combined networks is provided (Fig. 1).
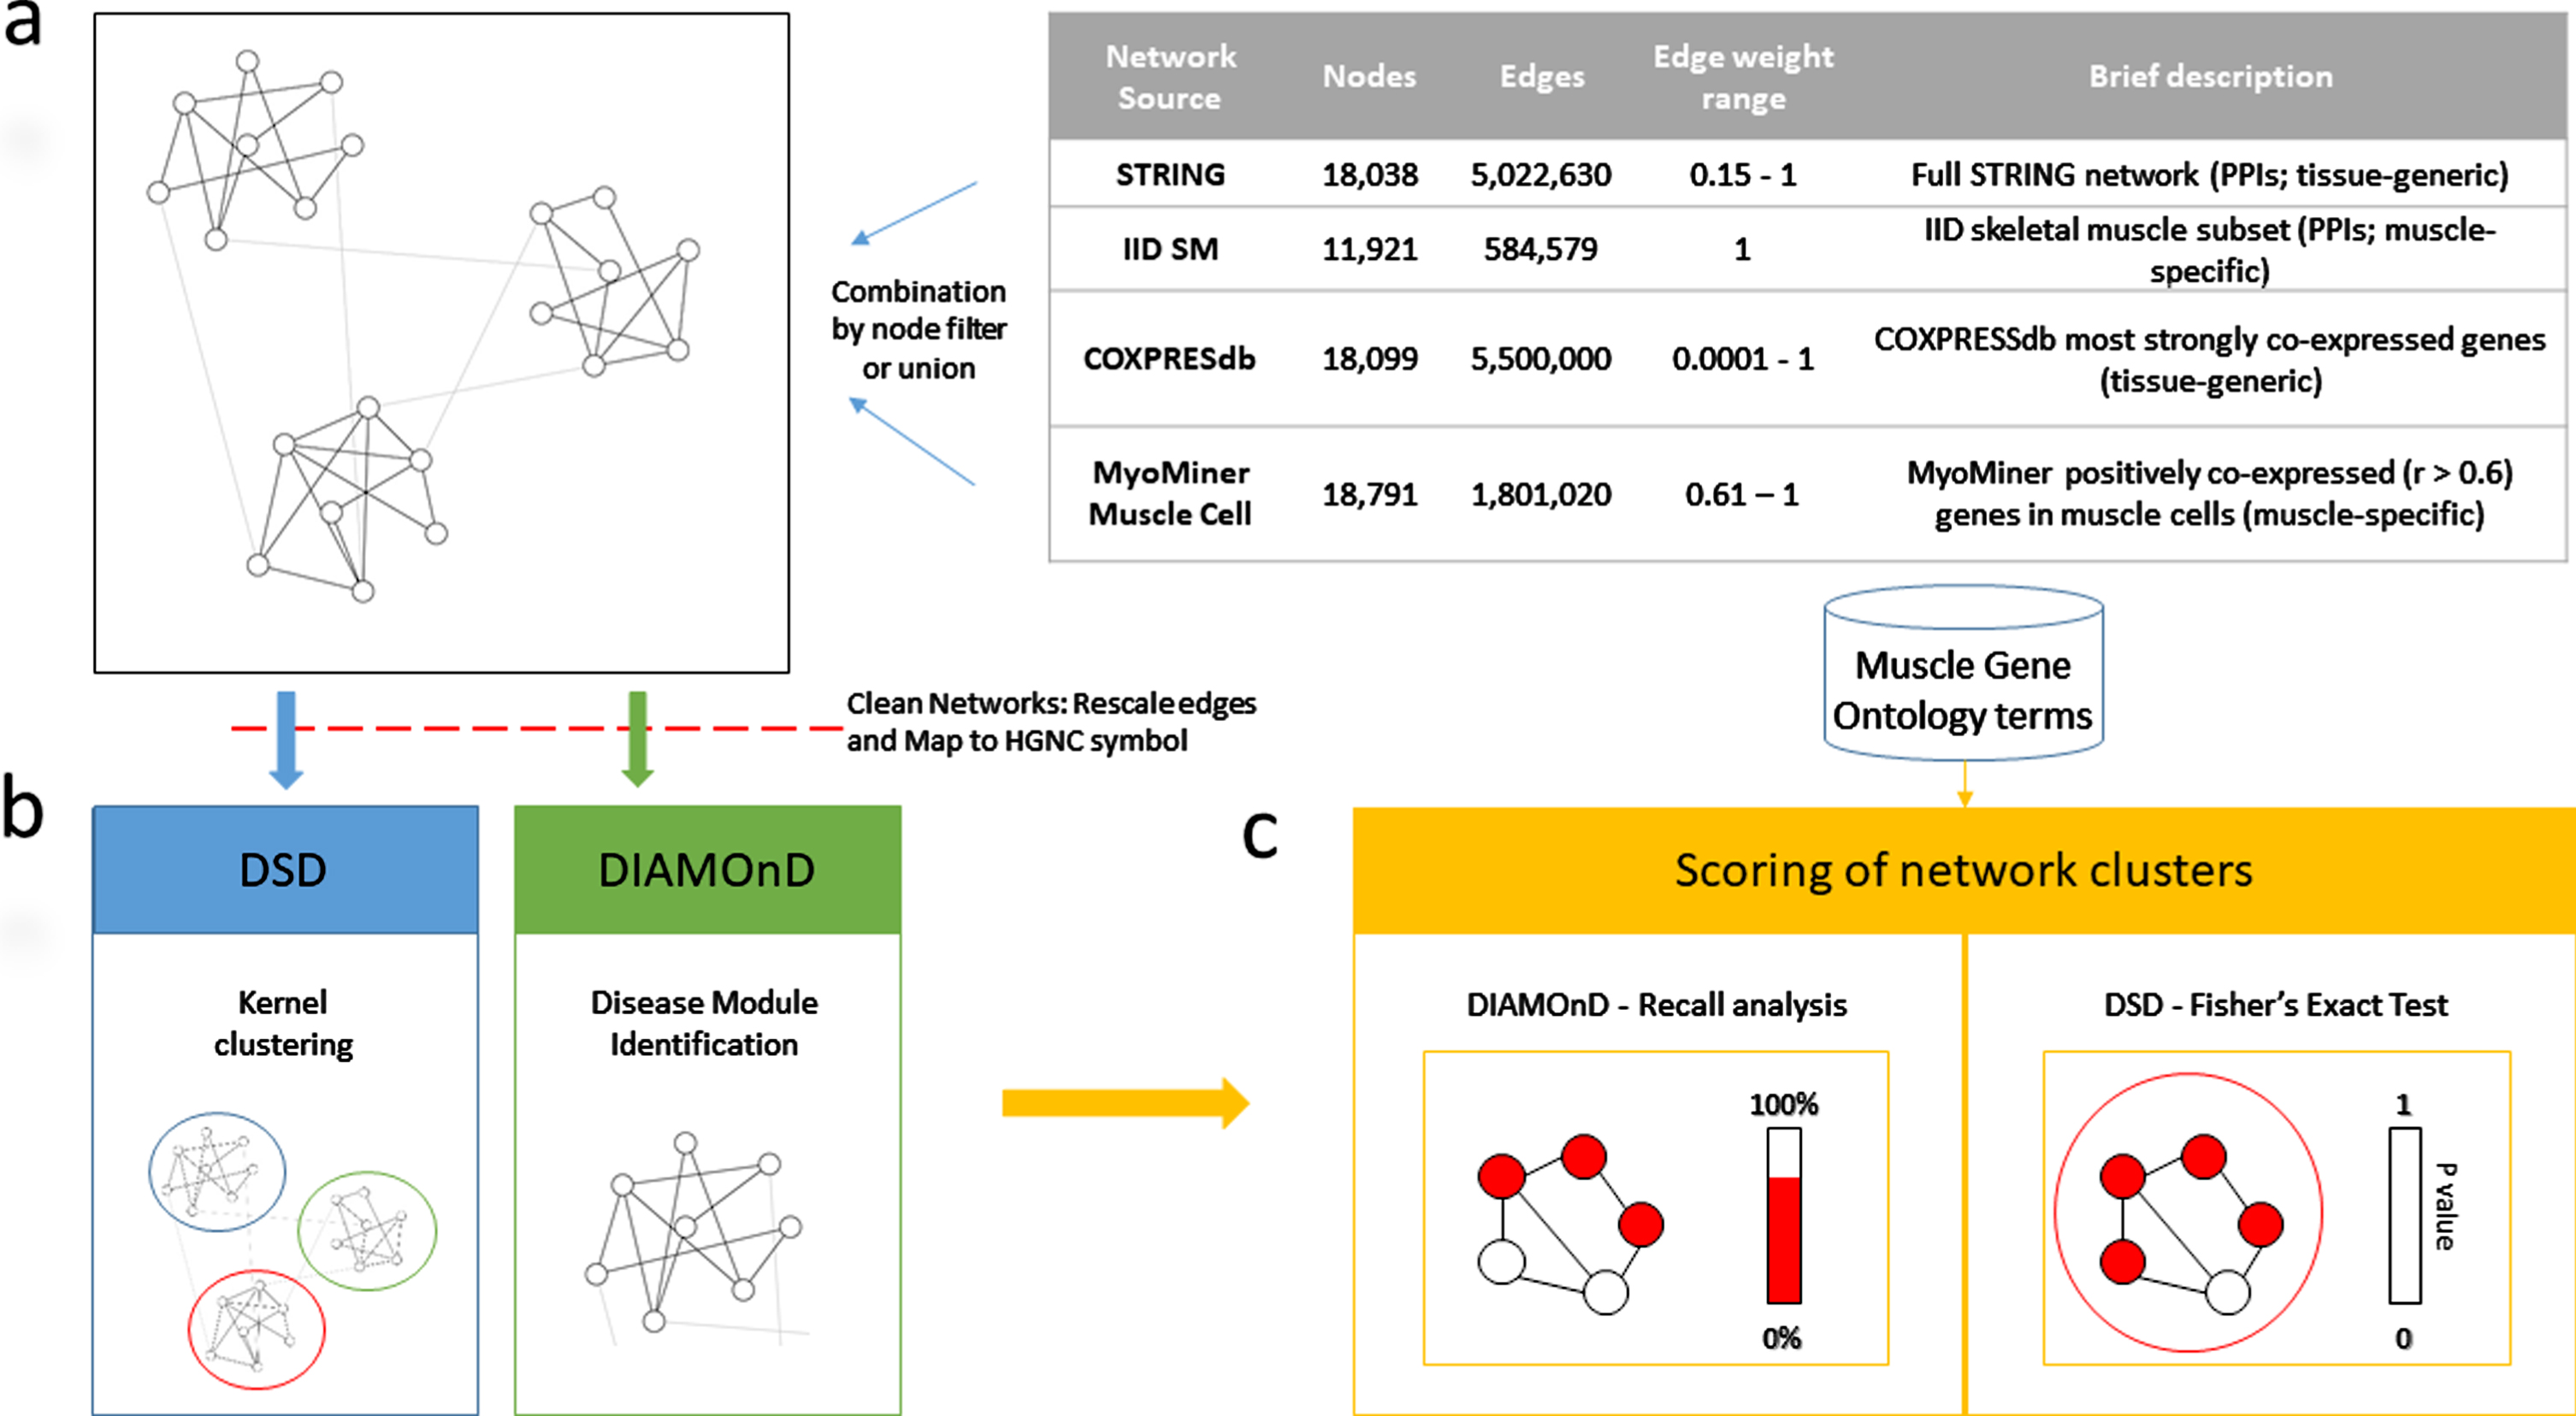
Schema summarizing the sources of combined networks and the methods used to assess their performance.
RESULTS
Functional association data were obtained from sources of Protein-Protein Interactions (STRING, IID), gene co-expression databases (GTEx, COXPRESdb, MyoMiner), and combined functional associations (HumanBase), and filters were applied to association evidence scores to generate 28 MINs of different compositions and sizes (Table 1; Figure S1). To test the recall of muscle-relevant genes and functions, 11 GO terms were selected based on their relevance to skeletal muscle biological processes or representation of important cell components of the skeletal muscle (Table S1). To retain only those networks having a minimum baseline representation of muscle-relevant genes, 17 networks were selected for subsequent analysis based on their average coverage (percentage of included genes) of the selected muscle-related GO terms (> 75% average coverage; Figure S1).
Each of the 17 networks were then compared using two measures: (1) the top enrichment scores obtained for each muscle-related GO term among clusters generated from this network using the DSD algorithm (Fig. 2A), and (2) the ability of the DIAMOnD algorithm to recall the genes of muscle-related GO terms using this network (Fig. 2B).
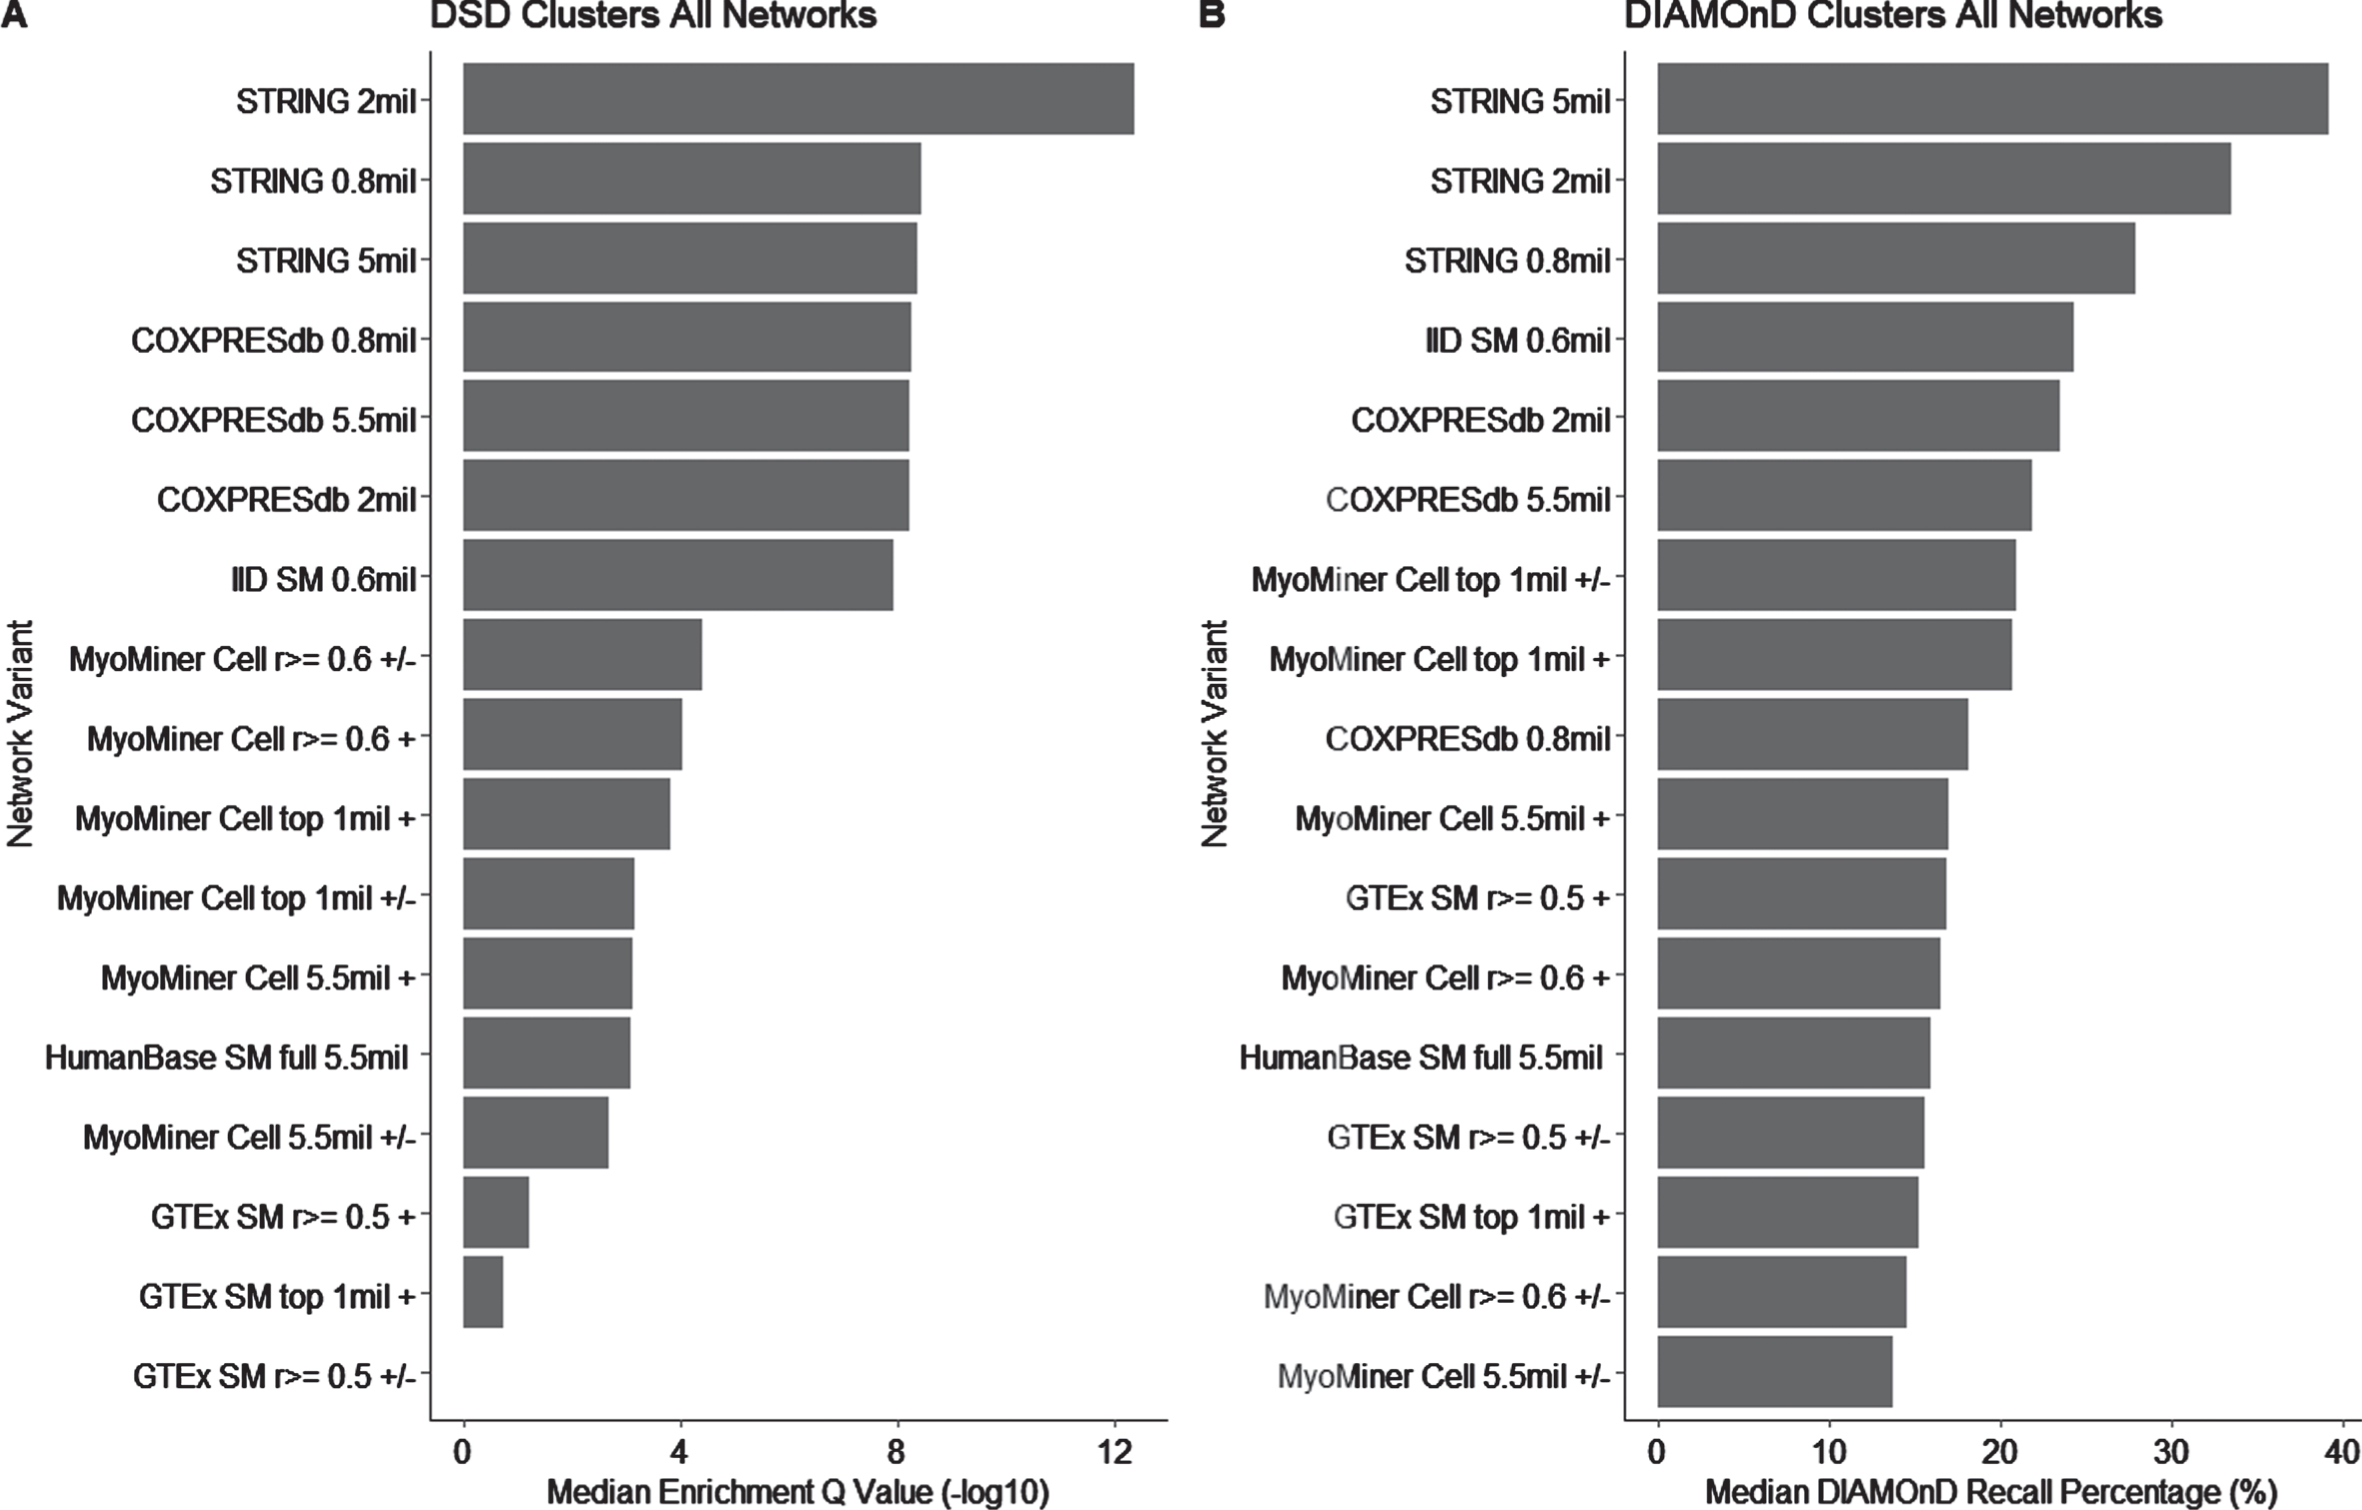
Comparison of the performances of 17 molecular interaction networks using two different clustering algorithms, DSD and DIAMOnD. MINs vary in functional association source data and in selected thresholds for their supporting evidence scores, and are named as explained in the Materials and Methods. (A) Each network was subjected to clustering by DSD and each resulting cluster was tested for enrichment of each of 11 muscle-related GO terms. For each network, the most strongly enriched (lowest Q value based on Fisher’s exact test) cluster for each of the 11 GO term was identified, giving 11 enrichment Q values for that network. The median of these 11 enrichment Q values was used as a basis of comparison between networks, and is shown here for each network. (B) For each network and each muscle-related GO term, a random 30% subset of genes was removed from the GO term. The remaining genes were used as a seed list for the DIAMOnD algorithm, and an attempt was made to recall the missing genes during iterative cluster growth by the DIAMOnD algorithm. The 30% subset of genes was randomized across 100 permutations to establish an average recall rate for that GO term for that network. The median average recall rate for the 11 GO terms was used as a basis of comparison between networks, and is shown here for each network.
DSD was the top performing network clustering algorithm ranked during the DREAM Disease Module Identification community challenge [47]. The algorithm utilizes a distance metric called diffusion state distance that defines pairwise distance scores on the premise that nodes connected by low degree neighbors are more likely to be functionally related. The distance matrix that is produced is then converted to a similarity matrix and spectral clustering is applied to define network clusters. To avoid clusters too large as to have a very specific biological meaning, we further broke down clusters with > 300 nodes by iterative application of the spectral clustering step. Clusters with < 5 nodes were discarded, as they may yield spurious enrichment results. For each network, each DSD cluster was tested for enrichment of each of the 11 muscle-related GO terms. The most strongly enriched (highest -log10 Q value based on Fisher’s exact test) cluster for each of the 11 GO term was identified, giving 11 enrichment Q values for that network. The median of these 11 enrichment Q values was used as a basis of comparison between networks (Fig. 2A).
The DIAMOnD algorithm generates a disease module by defining a disease cluster of nodes with the highest connectivity significance to a set of input seed nodes. The measure known as connectivity significance was introduced in order to account for spurious nodes having high numbers of connections. DIAMOnD is iterative: the node with the highest connectivity significance to the input seed nodes is added to the disease module and this step is repeated for a user defined number of iterations. Recall analysis features in the original DIAMOnD paper and involves taking a set of seed nodes and randomly removing a percentage (e.g. 10%, 20% or 30%) of the seed node list. In our implementation of recall analysis, for each network and each muscle-related GO term a random 30% subset of genes was removed from the GO term. The remaining genes were used as an input seed list, and an attempt was made to recall the missing genes during iterative cluster growth by the DIAMOnD algorithm. The 30% subset of genes was randomized across 100 permutations to establish an average recall rate for that GO term for that network. The median average recall rate for the 11 GO terms was used as a second basis of comparison between networks (Fig. 2B).
From Fig. 2A and 2B we can see the relative performance of each network for the median recall percentage of DIAMOnD and for the median enrichment q-value of DSD. The STRING PPI networks and the COXPRESdb gene co-expression networks all perform relatively well in terms of both the DIAMOnD and DSD clustering. For the muscle tissue-specific PPI networks, for both the DIAMOnD and DSD clustering methods, the IID SM PPI network provides a larger median recall percentage and a more significant median enrichment q-value than the HumanBase network. For the muscle tissue-specific gene co-expression networks, we see that with the DSD clustering algorithm, the MyoMiner SM cell network provides clusters with more significant median enrichment q-values compared to the GTEx SM gene co-expression network, which performs relatively poorly in comparison to the other networks. For the DIAMOnD algorithm, the median recall for the GTEx SM network was similar to that of the MyoMiner SM cell network.
To test whether combined networks of different types of functional association (PPI and gene co-expression) could improve the recall of muscle-related genes and functions, a subset of networks were selected to be combined. Selection was based on the individual performance of each network with DSD and DIAMOnD, and also to represent tissue-specificity or non-specificity. In general, the best performing network (taking into account results from both DSD and DIAMOnD) from each different source database was included, except those networks derived from GTEx and HumanDB, which all performed poorly on both DSD and DIAMOnD. For each source database, larger networks were retained as these contain the most interaction information, unless a smaller network had notably better performance. A total of 4 networks were selected. These are shown, together with basic network characteristics such as numbers of nodes and edges, in Table 2.
To combine each of the selected PPI MINs with each of the selected gene co-expression MINs, we defined 2 methods: node filter combination (NF), and union combination (U). The node filter combination method is similar to a gene expression filter. For a given PPI MIN, only those edges are kept that contain nodes present in the gene co-expression network. The union combination approach is a simple union of all nodes and edges of both networks, with duplicate edges removed. In this way, 8 combined networks were generated (each of the 2 PPI networks combined with each of the 2 co-expression networks using either method of combination). All but one of these (IID + COXPRESdb, NF) passed the threshold for minimum baseline representation of muscle-relevant genes (> 75% average coverage of the selected muscle-related GO terms) and was retained for subsequent analysis (Figure S2).
The median muscle GO term recall performance (median DIAMOnD recall percentages and median DSD cluster enrichment values) for the combined networks is shown (Fig. 3), and broken down by individual muscle GO term (Tables 34). Scores for the separate constituent networks (already presented in Fig. 2) are included again for comparison. A notable improvement is observed (Fig. 3A; Table 3) in the median enrichment q-value of the DSD approach when the STRING PPI network (median q-value of 8.4 alone) is combined with either of the two co-expression networks (COXPRESdb or MyoMiner) using the NF combination method (median q-values of 14.4 and 12.3, respectively). The same two combined networks (STRING + CoXPRESdb NF, and STRING + MyoMiner Cell NF) are also the top performers with the DIAMOnD approach (Fig. 3B; Table 4), but in this case the improvement over STRING alone (39% median recall) is more notable in combination with MyoMiner (46% median recall), the increase with CoXPRES being a single percentage point (40% median recall). The performance of the IID PPI network generally did not improve, or improved only marginally, when combined with a gene co-expression network. The union combination method generally did not improve the performance of either PPI network, and indeed markedly reduced their performance under the DSD approach. Overall, muscle GO term recall performance had moderate correlation (R = 0.31; p = 0.00049) between the DSD and DIAMOnD approaches (Figure S3).
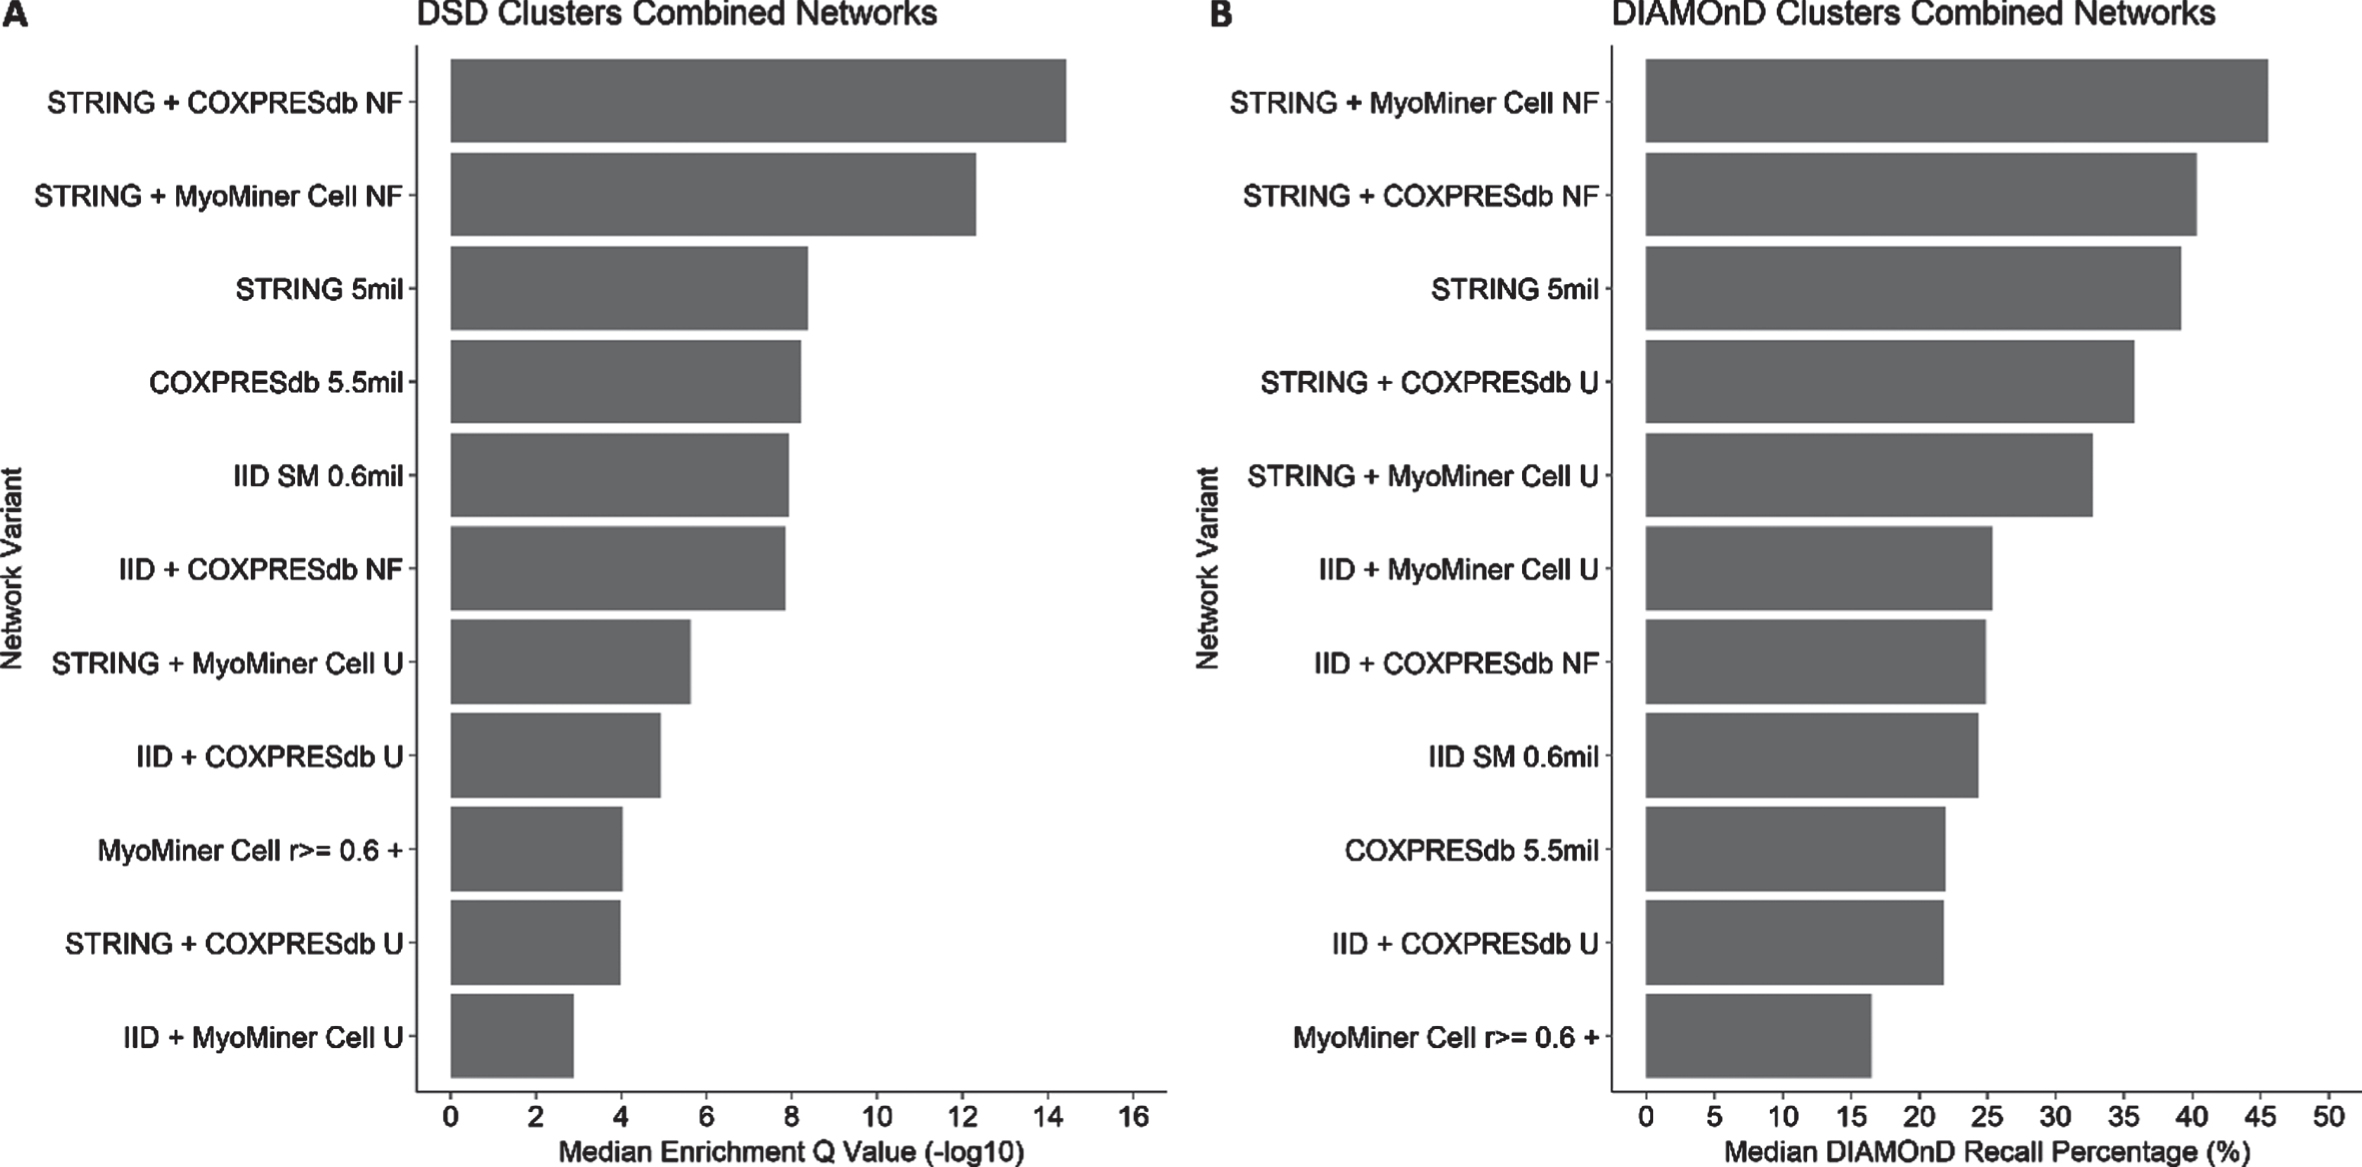
Comparison of the performances of combined (PPI and gene co-expression) molecular interaction networks using clustering algorithms DSD and DIAMOnD. Networks were compared in terms of the enrichment (DSD) or recall (DIAMOnD) of muscle-related GO terms. Median values for the combined networks and for their component networks are shown for DSD (A) and for DIAMOnD (B). For the DSD algorithm, combining the STRING PPI with the muscle tissue-specific MyoMiner Cell gene co-expression network via the node filter approach, produces network clusters with the most significant median enrichment q-values. For DIAMOnD, combining the STRING PPI with a generic gene co-expression network via the node filter approach produces a network with the highest median recall percentage.
DSD enrichment Q-value (-log10) of combined networks. The median enrichment value across all selected muscle GO terms is given, then the enrichment value for each individual GO term
DIAMOnD recall percentage of combined networks. The median recall percentage across all selected muscle GO terms is given, then the recall percentage for each individual GO term
As an example of the additional biological information that may be retrieved by the DSD clustering algorithm when applied to the combined networks as opposed to their separate constituent networks, we compared the clusters that were enriched in genes of the T-tubule GO term (Fig. 4, and downloadable as a Cytoscape session file from https://www.sys-myo.com/myominer/download.php). For each constituent network, the cluster having the greatest enrichment of T-tubule genes contained T-tubule genes numbering 12 for STRING (q-value 16.3), 5 for COXPRESdb (q-value 2.2), and 5 for MyoMiner (q-value 3.3). The combined networks produced top-hit T-tubule clusters which were larger but had proportionately better representation of T-tubule genes: 22 for STRING + CoXPRESdb NF (q-value 27.7), and 21 for STRING + MyoMiner Cell NF (q-value 25.3). We note that this trend was not observed for all of the selected muscle GO terms, and we provide a similar network cluster graph for the GO term ‘Skeletal Muscle Cell Differentiation’ as a counter-example (downloadable from https://www.sys-myo.com/myominer/download.php). Examination of the genes involved in the T-tubule clusters suggests that STRING by itself yielded a cluster that was rich in calcium channel subunit encoding genes, such as CACNB3, CACNA1C, and CACNA1D, the proteins of which physically bind with each other to form voltage-dependent L-type calcium channels which are found at high concentrations in the T-tubules of skeletal muscle. The co-expression networks, MyoMiner and CoXPRES, individually yielded clusters containing other key T-tubule elements that did not necessarily bind directly, such as the ryanodine receptor (RYR1), caveolin 3 (CAV3), or calsequestrin-1 calcium-storage protein (CASQ1). The combined network yielded a cluster drawing in not only the L-type calcium channel subunits, but also other structures and functions, such as calsequestrin, potassium channels (KCN3, KCN5, KCN11), sodium channels (SCN1B, SCN2A, SCN5A), and sodium/calcium exchanger (SLC8A1).
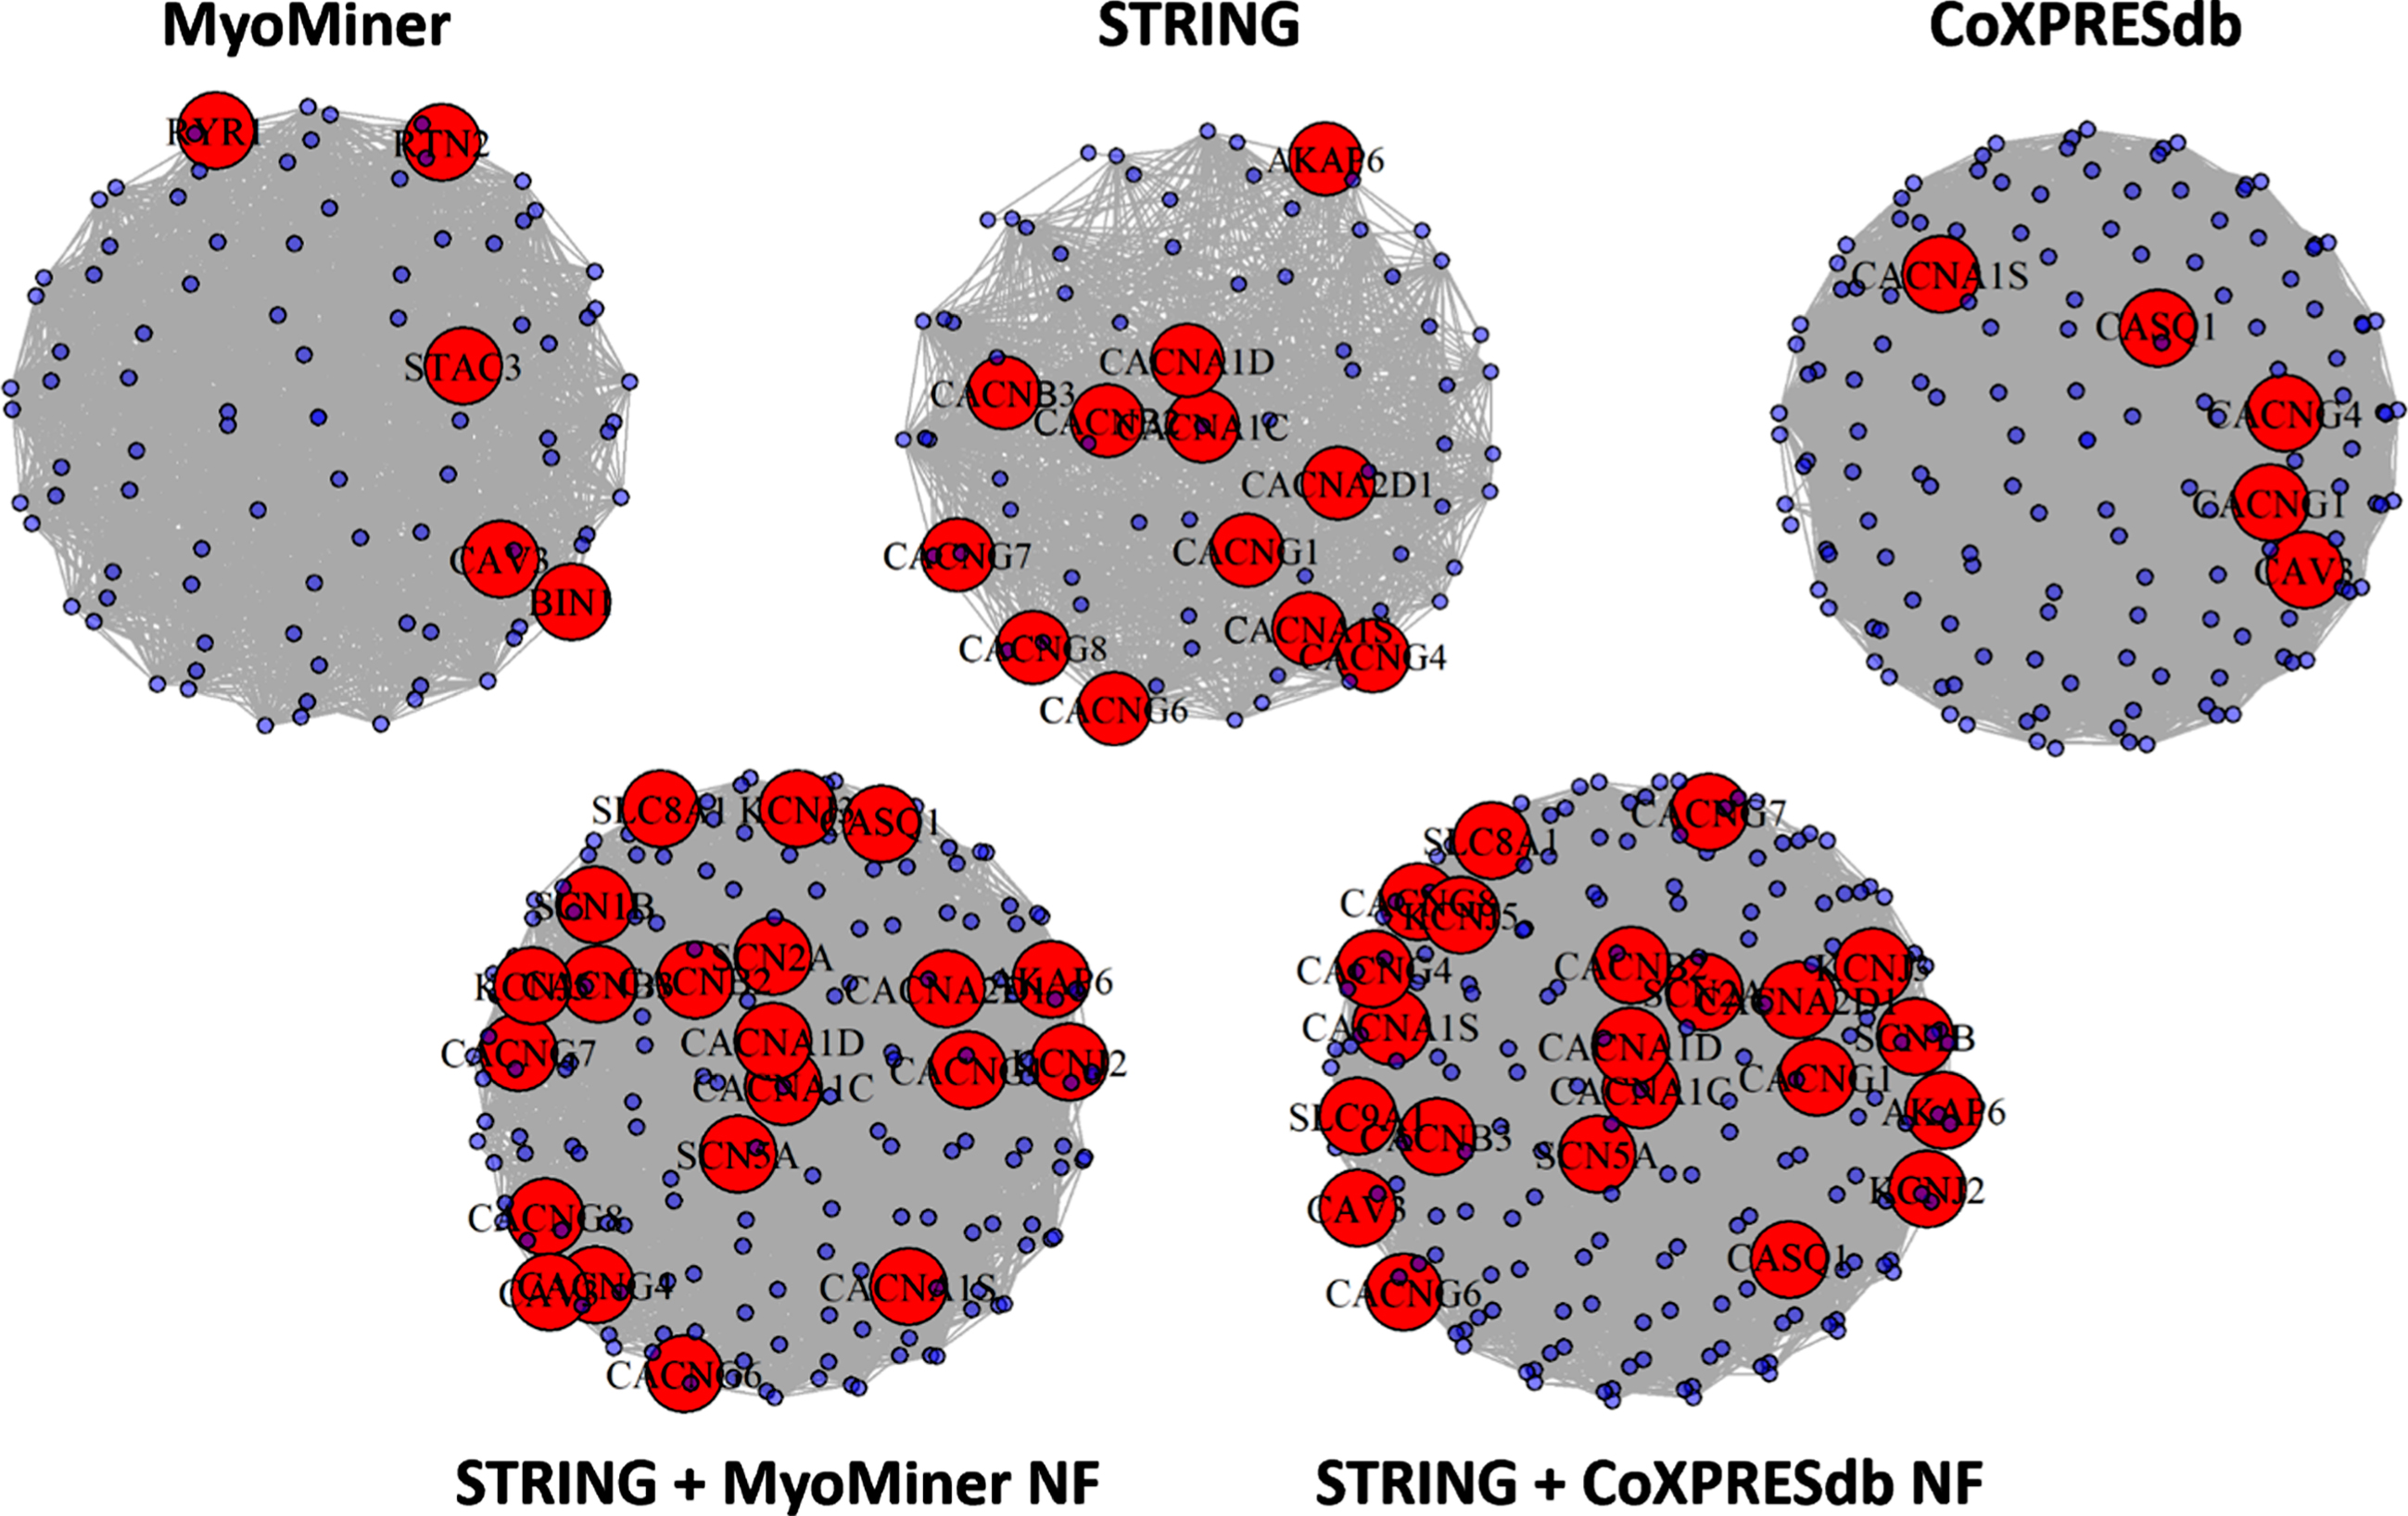
DSD kernel clusters with the highest enrichment of T-Tubule genes for different MINs. Clusters are shown for the top performing combined MINs ranked by capture of muscle GO terms (STRING + MyoMiner NF, and STRING + CoEXPRESdb NF; lower two clusters) as well as their constituent networks (upper three clusters). The nodes colored in red represent genes that are annotated to the T-tubule GO term, and these nodes are labeled with their gene symbols. Blue unlabeled nodes represent the remaining genes of each cluster, which are not annotated to the T-Tubule GO term. Although containing more nodes, the clusters from the combined networks have proportionately greater representation of T-tubule genes.
DISCUSSION
The present study considered 28 different Molecular Interaction Networks generated from 6 public sources of functional association data, and a further 8 combined MINs created by the fusion of data from pairs of those sources, each pair derived from one source of protein-protein interactions and one of gene co-expression, the aim being to establish whether a combined MIN from different sources could outperform its constituent MINs. Two performance metrics were defined to compare MINs based on the outcomes of different clustering algorithms (DSD and DIAMOnD), testing the extent to which the resultant clusters captured muscle-related GO terms. In this way, the MINs most suitable for the capture of muscle-related biological processes and cell compartments were identified from among those tested. Among the single-source MINs, STRING was consistently the best performing. The combination of STRING with MyoMiner was the only combined network that notably outperformed STRING alone when compared under the DIAMOnD clustering approach, and the STRING plus MyoMiner combination was the second-top performer under DSD. The combination of STRING with the tissue-generic gene co-expression network CoXPRESSdb also performed very well under both clustering approaches. This study establishes that the combination of multiple types of functional association can improve the capacity of MINs to represent muscle-related biological processes. Optimized combined networks are available for download from https://www.sys-myo.com/myominer/download.php.
Many metrics could be used to compare the biological relevance of different networks. The approach chosen here was inspired by that used in the DREAM Disease Module Identification challenge [47], where clustering algorithms and networks were compared against each other for their capacity to generate clusters enriched for disease-associated genes (from GWAS studies). The DSD clustering approach was chosen in the present study because it was the top-performing method identified by the DREAM challenge. A second algorithm, DIAMOnD, was chosen because the connectivity significance measure on which it is based represents a quite distinct approach, and the manner in which DIAMOnD builds a single cluster for a given network and seed list, using iterative growth from seed nodes, offered a similarly distinct, recall-based, scoring mechanism (as opposed to multiple clusters per network and enrichment-based scoring that we applied for the DSD algorithm). We note that it could be of interest in future to extend our analysis to all three top-performing methods from the DREAM Disease Module Identification challenge, which are now implemented in the MONET toolbox [48].
Whereas the DREAM challenge tested for enrichment of disease-associated genes from GWAS studies, we tested against muscle-related GO terms. This choice was made because neuromuscular diseases tend to be monogenic, with a single genetic locus being responsible for the disease in each patient, so GWAS studies of muscle disease are less common compared to the majority of human disease for which the genetic contribution is polygenic (and for which it is therefore more useful to study genome-wide associations). The advantage of GWAS data in this context, and the reason it was chosen by the authors of the DREAM challenge, is that it is independent of the experimental evidence base on which functional association databases are constructed. Gene Ontology annotations are based on a variety of evidence types, and are sometimes transferred across genes or between species based on sequence homology, but are always supported by at least one publication establishing the basic relationship of a gene to a process, function, or cell compartment [47, 49]. Since a protein-binding interaction or a gene co-expression relationship would generally not be sufficient to confer annotation to a given GO term, we can consider that GO terms are also broadly independent of functional associations. However, we cannot rule out that functional associations sometimes influence the supporting evidence for an annotation (such as for the occasionally used ‘author statement’ evidence type, where the curator draws directly from a published statement).
Although scores from the DSD algorithm correlated moderately with those from DIAMOnD across GO terms (R = 0.3; Figure S2), there was variation in which GO terms performed better using each clustering approach. For example, percentage recall of ‘Myofilament’ genes was as high as 87.4% under DIAMOnD (using the STRING + MyoMiner Cell NF network; Table 4), but this term had at best a middling performance for any network under DSD (Table 3). In the present study, we did not set out to compare the clustering approaches against each other or in relation to different GO terms, and our observations do not seem to suggest any obvious rules to predict which clustering algorithm will perform best for which GO term, but this may be an interesting topic for further research, as it may give insights into the best choice of clustering algorithm for a given functional genomics study, or to address a given biological question.
Although we did not set out to comprehensively compare tissue generic against muscle tissue-specific networks, in general we observed that there did not appear to be a major benefit of muscle tissue-specific networks, neither when compared as individual networks nor in combined networks. It would be conceivable that certain muscle-related GO terms would have greater specificity to muscle tissue, and we might have expected to see variation in the performance of individual GO terms or categories of GO term (the ‘contraction’, ‘membrane’, ‘regeneration’, and ‘other’, categories to which we assigned them; Tables 34) when comparing tissue-specific to tissue-generic networks. However, this was not the case, and no particular trend could be observed in that respect: with only a few exceptions, GO terms which showed strong recall relative to other GO terms (e.g. ‘Myofilament’ with DIAMOnD, ‘Muscle Cell Proliferation’ or ‘T-tubule’ with DSD) on tissue-specific networks generally showed strong recall on tissue-generic networks, and, conversely, poorly performing GO terms (e.g. ‘Myoblast fusion’ or ‘Muscle hypertrophy’) generally performed poorly regardless of tissue-specificity. This may not be surprising, as it has been suggested that there is extensive communication between universally expressed proteins and those with tissue-specific expression [25]. Nevertheless, it may be interesting in future work to carry out a systematic comparison to determine the effects of tissue-specificity: for example, to include both generic and tissue-specific MINs from similar sources (such as from GTEx or CoXPRESdb, which each have both complete and muscle-specific subsets).
Our analysis to some extent incorporated other types of functional association (STRING association evidence is supported by multiple types of functional association, and HumanBase is derived from multiple types of functional association), but it was focused chiefly on the two types of functional association, protein-protein interactions and gene co-expression, that performed best in the DREAM Disease Module challenge. It may be interesting in future work to attempt to improve muscle gene recall performance by a more explicit incorporation of other types of functional association, such as protein colocalization or sequence homology, signalling relationships, or gene expression regulatory interactions of DNA and RNA (e.g. transcription factors and microRNAs). Similarly, we focused the present study on muscle-related terms in two branches of the Gene Ontology, but it may be interesting in future to test recall of other muscle-related functional relationships, such as shared pathways (e.g. Reactome [50], Wikipathways [51]), or the Muscle Gene Sets [52].
Our aim was to identify optimal single networks for capture of muscle functions, but we note that certain analytical approaches can make use of multiple networks simultaneously [47], and in those cases it may be beneficial to use the top performing single-source networks from the present study as input.
We note the relatively poor performance of the muscle tissue gene co-expression network derived from GTEx, despite that this was based on RNA-Seq data, unlike the other two co-expression sources (MyoMiner and CoXPRESdb), which use microarray data. One possible explanation is that neither MyoMiner nor CoXPRESdb are specific to healthy tissue of a single muscle group. It is conceivable that the relatively rich variability in gene expression across different muscles, diseases, and experimental perturbations, may favour the discovery of biologically meaningful co-expression patterns, whereas variation within the same muscle of healthy individuals may be less useful in this context. However, other differences may also be responsible, such as the use of post-mortem tissue in GTEx (whereas most microarray data are from cells or biopsies): a study of post-mortem gene expression changes in the GTEx dataset found that skeletal muscle exhibited changes at the earliest post-mortem time-point compared to the other 35 tissues tested [53].
A functional genomics analyst may wish to choose which network to use for network-based analyses based on the performance of that network for a given biological process or cell compartment (chosen based on the relevance of that process or compartment to whichever research question the analyst seeks to address). However, we note that, relative to the other networks in the study, the two top combined networks (STRING + MyoMiner Cell NF, and STRING + CoXPRESdb NF) generally performed well across all or most of the muscle-related GO terms that were tested. Thus, for network analysis of muscle omics data in a broad sense, such as to explore potential new biomarkers or disease-implicated genes (i.e. ‘guilt-by-association’ [54]), or to derive gene sets for functional enrichment testing [52, 55] or genomic association studies [5, 6], we suggest that analysts use one of these two top-performing combined networks. We have made these networks available for download from https://www.sys-myo.com/myominer/download.php.
Finally, we note that the method of applying clustering approaches to muscle-related GO terms in the manner of the present study may be of direct interest for the study of muscle functions, similar to some of the intended applications for which these algorithms were developed: the clusters generated by DSD or by DIAMOnD contain the seed genes of a given process (or compartment), but also genes that are functionally associated despite not being annotated to that process. These genes may be of interest for the study of the process in question.
All of the networks and results that were used or produced in the study, along with gene lists of the members of the selected muscle GO terms, and analysis scripts, are available for download from https://www.sys-myo.com/myominer/download.php.
AUTHOR CONTRIBUTIONS
Conceptualization, WD and SD; source data manipulation, scripting, data analysis and interpretation, SM, AM, and WD; writing –original draft preparation, SM; writing –review and editing, WD, SM, and SD; supervision, WD and SD.
FUNDING
SM was supported by a studentship from the Department for Employment and Learning Northern Ireland. The work was also supported by the Target-ALS Foundation, and by a programme grant jointly from the European Union Regional Development Fund (ERDF) EU Sustainable Competitiveness Programme for N. Ireland/NI Public Health Agency (HSC R&D) and Ulster University.
Footnotes
ACKNOWLEDGMENTS
We thank the other members of the Ulster University neuromuscular team for lots of dynamic discussion and good craic. WD and SD wish to thank Prof. Terence Partridge for his kind mentorship and rich teachings on a great many things.
CONFLICTS OF INTEREST
The authors have no conflict of interest to report.