
Abstract
Background:
Duchenne muscular dystrophy (DMD) is a rare x-linked recessive genetic disorder affecting 1 in every 5000–10000 [1, 2]. This disease leads to a variable but progressive sequential pattern of muscle weakness that eventually causes loss of important functional milestones such as the ability to walk. With promising drugs in development to ameliorate the effects of muscle weakness, these treatments must be associated with a clinically meaningful functional change.
Objective:
The objective of this analysis is to determine both distribution, minimal detectable change (MDC), and anchor-based, minimal clinically important difference, (MCID) of 12 month change values in standardized time function tests (TFT) used to monitor disease progression in DMD.
Method:
This is a retrospective analysis of prospectively collected data from a multi-center prospective natural history study with the Cooperative International Neuromuscular Research Group (CINRG). This study calculated MDC and MCID values for 3 commonly used timed function tests typically used to monitor disease progression; supine to stand (STS), 10 meter walk/run (10MWT), and 4 stair climb (4SC). MDC used standard error of measurement (SEM) while MCID measurements used the Vignos scale as an anchor to determine clinical change in functional status.
Results:
All 3 TFT were significantly important clinical endpoints to detect MDC and MCID changes. MDC and MCID 12 month changes were significant in 10MWT (–0.138, –0.212), Supine to Stand (–0.026, –0.023) and 4 stair climb (–0.034, –0.035) with an effect size greater or close to 0.2.
Conclusion:
The 3 TFT are clinically meaningful endpoints used to establish change in DMD. MCID values were higher than MDC values indicating that an anchor-based approach using Vignos as a clinically meaningful loss of lower extremity abilities is appropriate to assess change in boys with DMD.
ABBREVIATIONS
4 Stair Climb 10 Meter Walk/Run Test Area under curve Cooperative International Neuromuscular Research Group Duchenne muscular dystrophy CINRG Duchenne Natural History Study Lower extremity Minimal clinical important difference Minimal detectable change Supine to Stand Timed Function Tests
INTRODUCTION
The most common form of pediatric onset muscular dystrophy is Duchenne muscular dystrophy (DMD), caused by a genetic mutation in the dystrophin gene that leads to progressive muscle weakness and loss of ambulation. DMD affects 1 in every 5000–10000 [1–3]. The discovery of this gene over 30 years ago led to improved diagnostic capabilities for DMD [4]. Standards of care guidelines for DMD emphasize appropriate musculoskeletal management through physical therapy and corticosteroid therapy to maintain strength and function [5, 6]. These interventions have resulted in a longer lifespan yet increased variability in disease progression. DMD progression occurs in a predictable sequential manner with loss of the ability to get off the floor, climb stairs, bring hands to mouth, and early morbidity due to cardiorespiratory insufficiency [6–12].
Predictive factors of disease progression are associated with the loss of major functional milestones such as walking ability. With corticosteroids, the timeline when young boys lose ambulation shifted later by 1-2 years; however, between the ages 9–15, loss of ambulation is inevitable [13]. Walking speed in boys with DMD is directly correlated with preservation of ambulation, indicating that individuals who walk faster maintain ambulation longer [8]. There have been numerous studies linking ambulation to improved quality of life and prevention of the development of scoliosis and joint contractures/deformities [8, 14]. Once an individual becomes non-ambulatory, secondary issues such as development of scoliosis, osteoporosis, obesity, disuse atrophy, increased rate of contracture development and psychosocial issues impact the perception of disease progression. The psychological effects of loss of a function such as ambulation have been equated to the fears and anxiety that is associated with loss felt at the time of diagnosis for boys and families with DMD [15].
In 2006, at a National Institute on Disability and Rehabilitation Research (NIDRR) meeting to discuss challenges in muscle disease, the Federal Drug Administration (FDA) specified that clinical trials conducted in support of new drug approvals or revised indications for already approved drugs must incorporate a primary endpoint that objectively measures a clinically meaningful “life-changing” milestone that has a significant impact on a patient’s perceived overall health and well-being [16]. Historically, the Vignos scale, an 8 point ordinal scale, has been used to describe lower extremity function in boys with DMD with each level indicating a change in function including significant milestones such as loss of ability to rise from the floor and ambulation [17, 18]. In a study by McDonald et al. [19], the authors noted high correlation of a patient reported outcome measure, the Pediatric Outcomes Data Collection Instrument (PODCI) transfers/basic mobility score, with the Vignos scale and 3 timed function tests (TFT) including supine to stand (STS), 10 meter run-walk (10MWT) and 4 stair climb (4SC).
Minimal clinical meaningfulness has been used to assess change in clinical presentation and may be used to determine response to treatment or progression of disease. To determine clinically meaningful difference in clinical assessment measures, there are anchor-based minimal clinically important differences (MCID) and distribution-based minimal detectable change (MDC) methods, which are distinctly different approaches to provide meaningful estimates of change in clinical outcome measures. MCID is the minimal amount of change to a clinical outcome that may make a difference in clinical care or quality of life to a patient [20, 21]. It is determined based on the ability of a change score to predict the occurrence of a clinically meaningful milestone in the natural history of the disease and has been increasingly employed in disease-based treatment development research [22–25].
Minimal detectable change (MDC), on the other hand, is described as true change not attributed to error or variability. Distribution-based methods depend on statistical approaches founded on psychometric soundness of a clinical outcome, without reference to a clinical or patient perspective. The TFT analyzed in this study have been reported to have sound psychometric properties of reliability and validity, as well as good predictive qualities [18, 27]. These properties give assurance that changes in these clinical endpoints are less likely to be due to measurement error. MDC is a statistical approach not anchored to clinical significance [21]. Statistical change does not necessarily translate to clinical benefits. MDC values use direct approaches that compare different groups, whereas MCID methods use an anchor-based approach to establish a meaningful change over time based on patient or clinical interpretation to the understand the magnitude of change [28].
On a guidance document about patient-reported outcomes, the FDA attempted to provide recommendations on interpretation and implications of MCID measures [29]. However, due to lack of consensus, MCID was defined as the smallest difference in outcomes that may be proxies of perceived importance to patients [29]. With little direction, clinical trials continue to report MDC measures of change, which may under or overestimate the clinically important differences or significance of results. This may result in difficulties in interpretation of MCID values that may under or over estimate treatment effect. This becomes a problem as payers tend to require clinical outcomes used in trials as a minimal criterion for access to treatment.
Many studies report speed measures as predictors of loss of function in DMD [7, 30–37]. However, there needs to be better understanding of the clinical impact of different change trajectories of TFT and its impact on loss of functional milestones. MCID estimates that are based on rate of change can provide a threshold for meaningful change that is important to the patient. MCID measures are not only important to patients [38], but they can provide clinicians with a critical value that corresponds to a measurable change helping determine clinical goals and disease monitoring to improve anticipatory care management. It is also increasingly important to payers, since they often define approval or payment for therapies based on published MCID values. It is essential that researchers accurately report MCID estimates specific to a particular patient population to improve the access to care in specific populations. Additionally, MCID values can help determine appropriate sample sizes when designing clinical trials for better interpretation of clinical outcomes and relevance to disease progression [39]. The objective of this paper is to determine and compare MDC and MCID values of 3 validated and commonly used TFT (STS, 10MWT, 4SC) to assess disease progression in individuals with DMD.
METHOD
This is a retrospective post hoc analysis of data collected as part of the prospective Cooperative International Neuromuscular Research Group (CINRG) Duchenne natural history study, a consortium of 22 sites in over 9 countries. Prior to data collection, all sites had institutional or ethics review board approvals, and informed consent/assent was obtained prior to study procedures. The study population included 391 individuals with DMD with at least 7 years of follow up data. Data was collected between 2006–2016. Assessments were performed at baseline and months 3, 6, 9, 12, 18, 24 (ambulatory) or months 6, 12, 18, 24 (non-ambulatory) followed by annual visits after year 3. Corticosteroid use was also captured at each visit.
Standardized methods and training were observed throughout the trial for all physical therapy assessments to ensure consistency of measurements based on previously published design and methodology [26, 40]. Data extracted for analysis included TFT, specifically STS, 10MWT, and 4SC, and the Vignos scale scores (Fig. 1). The Vignos lower extremity scale is an ordinal scale used to describe lower extremity functional ability in boys with DMD with higher values representing lower function [17]. Any changes to a higher score in the Vignos scale would reflect functional loss. TFT variables were assessed in seconds and reported as speed (Refer to appendix for conversions). Speed was calculated for the entire activity; therefore 4SC was calculated as 1/x instead of 4/seconds, implying that boys with DMD do not complete each step at the same rate. Example of conversions from seconds to speed are below:
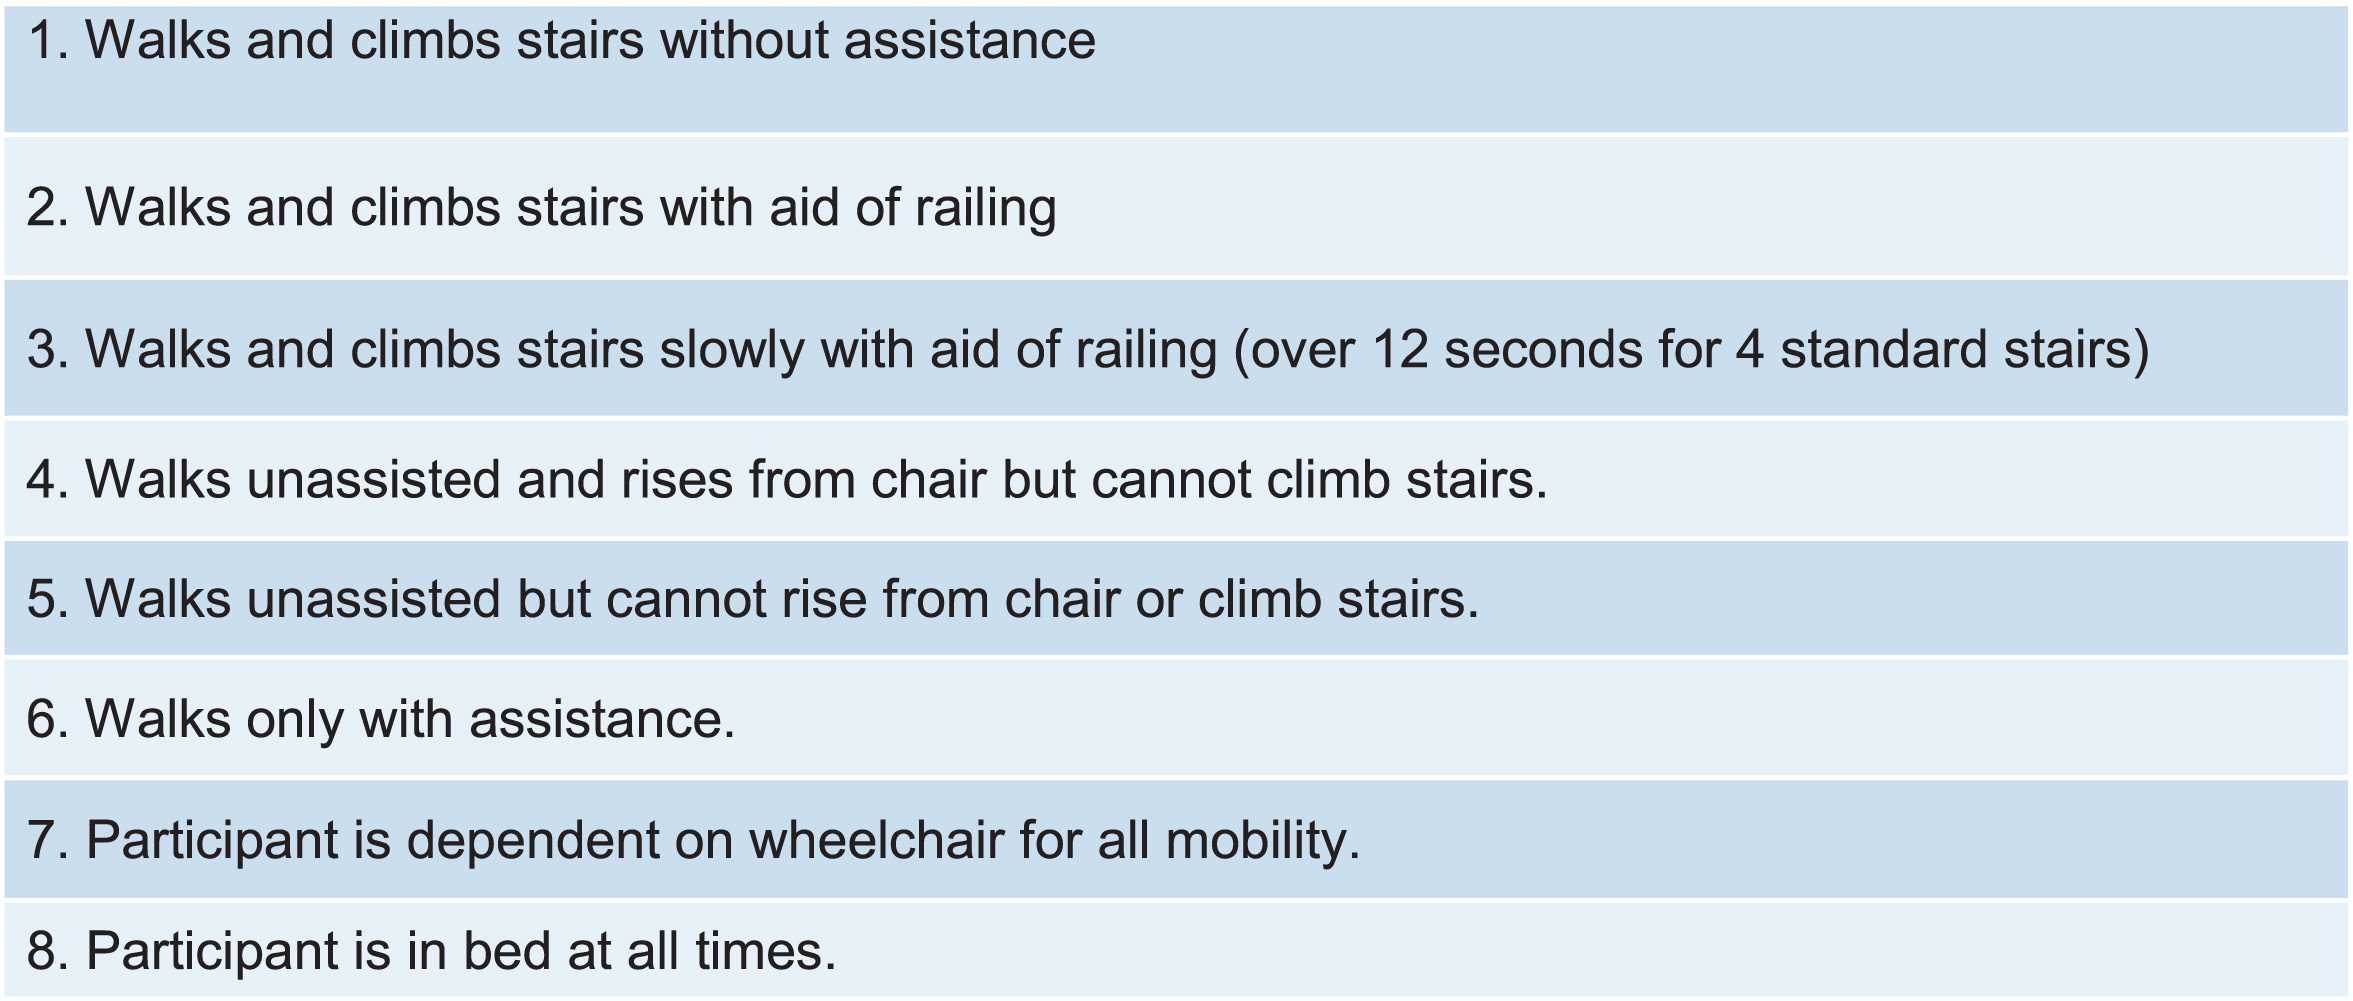
Vignos lower extremity scale.
STS speed = 1/x (x = seconds to complete the test) resulting in an assessment in rises/s Example: It takes the patient 5 seconds to perform supine to stand. STS speed = 1/x x = 5 seconds STS speed = 1/5 = 0.2 rise/second 10MWT speed = 10/x (x = seconds to complete the test) resulting in an assessment value in m/s Example: It takes the patient 5 seconds to run/walk 10 meters. 10MWT speed = 10/X x = 5 seconds 10MWT speed = 10/5 seconds = 2.0 m/s 4SC speed = 1/x (x = seconds to complete the test) resulting in a speed assessment for climbing all 4 stairs Example: It takes the patient 5 seconds to climb 4 stairs. 4SC speed = 1/x x = 5 seconds 4SC speed = 1/5 seconds = 0.2 tasks/s
For 12-month changes, we defined multiple 12-month observation intervals for each participant where 12 months was defined as two visits ≥ 304.2 days (47.3 weeks) and ≤ 425.8 days (64.7 weeks) apart. We excluded intervals that overlapped by more than 91.3 days (13 weeks). Vignos was used as a clinical anchor defined as a binary variable: 0 = no decline (score remained the same or decreased by 1 or more points over the 12 month interval) or 1 = decline (score increased by 1 or more points over the 12 month interval). Independent variables included the 3 TFT with covariates of age and corticosteroid status (user/non-user) at the start of each 12-month interval.
All statistical tests were performed using STATA V14 (College Station, TX). Statistical tests were conducted using a two-tailed test at an alpha level at 0.05. Descriptive statistics were used to summarize participants’ age, current usage of steroids and 12-month change of clinical endpoints grouped by Vignos decline status. T tests or chi square tests were used to test for significant differences in these variables between Vignos decline status.
Logistic regression models, adjusted for age, were used to assess the 12-month changes in TFT associated with a 12-month decline in the Vignos score. Participant IDs were clustered to account for multiple occurrences of more than one 12-month assessment interval. The model specified Vignos decline status as the dependent variable, 12-month change in each time function outcome as the dependent predictor, age and steroid status at baseline as covariates. Models were clustered on individual participants and limited to ambulatory participants.
In order to define the anchor based MCID as a candidate, the TFT must have been associated with a Vignos decline at a p value less than 0.05. Candidate MCID values were then developed with use of receiver operating characteristic curve (ROC) analysis following the ROC sensitivity to change method by Stratford et al. [41]. To obtain anchor-based MCIDs, a new binary variable for each of the 3 TFT were developed, namely, the new binary variable of 1 or 0 based on whether the 12-month change of time function tests were ≤ the cutoff score. The optimal cutoff point was estimated by the maximum point reached from the ROC analysis, the largest value defined by dividing sensitivity (true positive rate) by 1 minus specificity (false positive rate) [41]. A logistic regression model was then fit to the new binary variable.
In order to calculate the observed distribution-based MDC values for our cohort, we used the effect size approach and observed baseline and 12-month change values. The MDC was estimated as the 12-month change in time function score divided by the standard deviation of each time function outcome at baseline.
RESULTS
The dataset consisted of 391 participants with at least one 12-month interval for a total of 1518 observations. Of those, this analysis was limited to 776 observations in ambulatory participants having a Vignos assessment over 12 months. Patients were on steroids during 70.8% of their 12-month intervals. Consistent with published clinical data on loss of ambulation, the average age for ambulatory individuals was 9.1 years (Table 1). Assessment of age and corticosteroid use as potential covariates showed only age to be significantly associated with Vignos scores; therefore, only age at baseline was used as a covariate in the anchor-based model fitting.
Descriptive statistics and 12 month changes of clinical endpoints by Vignos status
*Participants were required to have a Vignos score at the start and end of each 12-month observation interval, however that requirement did not extend to the TFTs (10MWT, STS, 4SC). The N’s here reflect the number of observations available for modeling and exclude those for which a TFT was unavailable at either the start or end of the 12-month interval.
For Vignos model fitting, all three TFT were associated with Vignos status with an adjusted p value < 0.05 and had acceptable area under the curve (AUC) values of ≥ 0.7 within the ROC analysis. AUC is often used as a statistical model fitting indicator where values of 0.7 to 0.8 are considered acceptable, that of 0.8 to 0.9 to be fairly good, and that of 0.9 to 1.0 to be excellent [42]. Table 2 shows the distribution based and anchor based MDC and MCID values. MDC estimates were calculated from the standard deviation of baseline endpoints. MCID measures show significant p values of < 0.05 in the prediction model fitting for all 3 TFT.
MDC and Vignos anchored MCID values for TFTs
Note: *indicates p value < 0.05; # indicates AUC ≤ 0.7.
Effect size is a standardized measure of change from baseline over a certain time interval divided by the standard deviation (SD) of the baseline score. The effect size value represents the number of SD by which the scores have changed from baseline. By convention, an effect size of 0.2 is considered small, 0.5 moderate and 0.8 large [43]. The MCIDs anchored to Vignos scores for 2 of the 3 timed tests were slightly larger or near equitable, indicating that MDC is not as meaningful a change and there is a need for an anchor-based approach for clinical meaningfulness (Table 2); this included 10MWT (MCID = –0.212 m/sec, MDC = –0.138 m/sec) and 4SC (MCID = –0.0235 task/sec MDC = –0.034 task/sec). MCID values show that a small change in speed measures resulted in a change in Vignos status by at least one level. As DMD is a progressive disease, all individuals showed a decline. For example, in the 10MWT, a –0.212 m/sec decline in gait speed resulted in a clinically meaningful unit change of 1 on the Vignos scale.
DISCUSSION
These TFT are well established and frequently used in trials and in the clinic because of their ease of administration and reliability [26, 44]. As noted in more recent approved trials in other NMD such as spinal muscular atrophy, clinical endpoints used in trials are becoming insurance requirements for authorization for access to the treatment [45, 46].
Most published studies in DMD which have determined clinically meaningful differences have used both MDC and MCID values. MDC measures are a good estimate of the psychometric properties of an instrument and may indicate that an observed change is unlikely due to error or chance, however, they do not provide a good indication of the importance of the observed change. Therefore, MCID values must be used to supplement the meaningfulness of the MDC measure by linking the change to a clinically meaningful functional change in disease milestones. Considerations must be made for accuracy of MCID based on the specific patient population and the anchoring assessment used to determine clinical meaningfulness as particular cohorts may have slightly different MCID values.
Estimates of MCID of functional speed measures anchored to a validated scale like the Vignos in DMD [47] align with the National Heart Blood Lung Institute’s (NHBLI) recommendations on estimating MCID values for diseases with a wide heterogeneity. This approach has better applicability in clinical interpretation and efficacy trials [38, 49]. It is clinically important to anchor the rate of change in TFT to the Vignos scale because a change in the score on the scale tends to trigger a change in care needs. For example, the inability to get off of the floor or ambulate may create the need for equipment, school accommodations or home modifications. This potentially changes the child’s school individual education or home adaptations which may require at least 6–9 months to complete. Therefore, having a MCID score that can be used to predict loss of functional level with the Vignos scale could be very useful for an anticipatory care approach. Currently, the Vignos scale is used descriptively to categorize functional level with no predictive ability. The results of this study use this categorization to signify milestone functional changes that may be more sensitive and objective to predict these losses with TFT. A predictive approach would help clinicians ameliorate the impact of functional losses for families, as it would allow an opportunity to plan for needed support and expected changes.
Despite the paucity of research [37, 50–52] using natural history studies to determine MCID scores, this study looked at a corticosteroid era DMD natural history to determine MCID scores associated with change scores over 12 months that is associated with loss of function, instead of treatment effectiveness. Determining MCID values in the context of disease deterioration is important to understand the true impact of future therapeutic interventions. This was shown in a study of chronic obstructive pulmonary disease, where observational studies were better able to determine predictors of mortality or hospitalizations because of the lack of confounding treatment interventions [48].
Our study MDC results show minimal measurement error, possibly associated with response time for clinicians to measure, which is also consistent with the excellent reliability published for these measures [26]. It appears that with STS and 4SC that the MDC and MCID measures are very similar making it an equitable measure, but 10MWT shows a MCID greater than the MDC, indicating that it has potential to show changes beyond that of measurement error indicated by MDC scores.
One of the limitations in our study was reporting our TFTs MCID in speed measurements, versus seconds that is typically used in clinic as measured with a stopwatch. We tried to address this by providing an appendix to convert seconds into speed. Our results show small speed values, but when translated into actual time, measures fall within 0.5 seconds. Another limitation of this study included the exclusion of non-ambulatory participants. Considering the importance of function in non-ambulatory boys with DMD, future studies should consider determining MCID for an outcome that encompasses the spectrum of the disease. Additional limitations included using a clinician rated anchor, Vignos score, versus a patient reported outcome. However, McDonald et al did find that the patient reported outcome measure, PODCI, was highly correlated to TFTs [19]. Additionally, the values for MDC and MCID were very similar in 2 of the 3 TFTs indicating that the added anchor based analysis may not be as informative. The small MDC values shown in our study indicate good internal stability of measurement for TFTs. Of the 3 TFTs, MCID values for 10MWT may be most sensitive in predicting loss of functional milestones as the MCID values were greater than that of MDC values. Interpretation of MCID values is based on the variability of these measures within this specific study cohort, thus different ambulatory DMD populations may have slightly different MCID values. Therefore, MCID should be strictly interpreted with specific reference to the population of analysis. Due to this study being part of a large international longitudinal natural history study, the information reported may better represent the variability that is seen in ambulatory boys with DMD as compared to results from smaller cohorts.
Understanding the etiology, symptomology, and natural history of degenerative diseases is essential in determining MCID values that are relevant to the prediction of loss of functional milestones and its impact on disease burden [48]. In this study, we used outcome measures that have been shown to have good internal psychometric properties, therefore reducing the potential problems of the outcome being unstable or invalid. For clinical trials, due to the dynamic nature of MCID values, MCID values should be used a priori in trials where participants are stratified into groups based on likelihood of response to treatment [53].
CONCLUSION
MCID values may be instrumental in demonstrating a meaningful objective change that affects clinical management and in determination of treatment efficacy in clinical trials. Applying MCID values to commonly used clinical assessments may help understand the impact of rate of progression in commonly used TFTs in DMD. Therefore, in a clinical trial, if a treatment improves the rate of change for these TFT then there may be a clinically meaningful change that is linked to a significant functional milestone improvement. This may be used as a guide for clinicians to move towards an anticipatory care approach to adjust treatment plans and justify projected equipment needs.
This study is the first to report MCIDs in TFT that are anchored to crucial loss of functional milestones on the Vignos scale. These tests are frequently used in the clinic and clinical trials and are well validated to be sensitive in boys with DMD. With increased variations in disease progression in the corticosteroid era, it is important to understand the impact of the rate of change in these TFT measures for proper anticipatory care planning and clinical trial design. Future analysis should assess MCID values on an outcome such as upper limb or pulmonary function that is reflective of the entire spectrum of DMD’s disease progression and stratified by functional level.
Footnotes
ACKNOWLEDGMENTS
University of California Davis –
Sundaram Medical Foundation and Apollo Children’s Hospital, Chennai –
Holland Bloorview Kids Rehabilitation, Toronto –
Alberta Children’s Hospital, Calgary –
Queen Silvia Children’s Hospital –
Children’s National Health System –
Royal Children’s Hospital –
Hadassah Hebrew University Hospital –
Instituto de Neurosciencias Fundacion Favaloro –
Mayo Clinic –
Children’s Hospital of Pittsburgh of UPMC and the University of Pittsburgh –
Washington University –
Children’s Hospital of Virginia –
University of Tennessee –
Children’s Hospital of Westmead –
University of Alberta –
University of Puerto Rico –
Centro Clinico Nemo –
Texas Children’s Hospital –
University of Minnesota –
The CINRG Coordinating Center –
FUNDING
This study was supported by the U.S. Department of Education/NIDRR (#H133B031118, #H133B090001), the U.S. Department of Defense (#W81XWH-09-1-0592), the National Institutes of Health (#UL1RR031988, U54HD053177, #UL1RR024992, #U54RR026139, #2U54HD053177, #G12RR003051) and the Parent Project Muscular Dystrophy.
CONFLICT OF INTEREST
TD: Serves on advisory boards or consultant for Pfizer, Inc., Dyne Therapeutics, F. Hoffman-La Roche, LTD, Sarepta Therapeutics, Edgewise Therapeutics.
JC: none.
MB: none.
LN: none.
CS: none.
AF: none.
EH: Serves on advisory boards for Sarepta, Inc. and Santhera Pharmaceuticals.
CM: Serves as a consultant on clinical trials of DMD and serves on advisory boards for Astellas, Capricor Therapeutics, Catabasis, Edgewise Therapeutics, Epirium Bio (formerly Cardero Therapeutics), FibroGen, Italfarmaco, Pfizer, PTC Therapeutics, Roche, SantheraPharmaceuticals and Sarepta Therapeutics. He has received research support for clinical trials from Capricor Therapeutics, Catabasis, Italfarmaco, Pfizer, PTC Therapeutics, Santhera Pharmaceuticals and Sarepta Therapeutics.
HG: none.
Appendix1: Conversion of time to complete TFT in sec to speed
Example: How to calculate 12 month change speed for 10MWT for comparison to MCID 12 mos change for 10MWT = (Time to complete 10MWT Month 12) –(Time to complete 10MWT Month 1) Month 12 time to complete 10MWT = 5.5 sec Month 1 time to complete 10MWT = 5.0 sec 12 mos change for 10MWT (sec) = 5.5 –5.0 = 0.5 sec Seconds to speed using conversion table Month 12 = 5.5 sec = 1.818 m/sec Month 01 = 5.0 sec = 2.00 m/sec 12 mos change for 10MWT (m/sec) = Month 12 speed - Month 1 speed 12 mos change for 10MWT (m.sec) = 1.818 –2.000 = –0.182 m/s MCID for 10MWT = –0.212 Therefore, 0.182 m/sec is not a clinically significant change in speed.