
Abstract
Muscle strength testing is routine in clinical practice. Here we provide an aid to the documentation and visual conceptualization of those results – MuscleViz: a free, open-source application for visualizing the results of muscle strength testing. Its use in clinical settings streamlines the communication of physical examination findings. The tool is also useful for presenting patient data in case reports or case series. A push towards free, open-source software has benefitted other areas of science; we believe a similar effort dedicated to the development of clinical tools is worth pursuing.
MAIN TEXT
Manual or “confrontational” muscle strength testing is central to the neuromuscular examination. Recording the results of strength testing, however, is not standardized. Common practice involves using the Medical Research Council (MRC) strength scale [1, 2] or quantitative methods [3]. The results are then typically recorded in a table format. While useful for analysis and archiving, this tabular format is not ideal for presenting an intuitive picture of the distribution of muscle strength/weakness, which is the basis for clinical pattern recognition and thus is diagnostically highly relevant. This can be better achieved with a “muscle strength pictogram” – a stylized depiction of the human form and muscles, with each muscle colored in correspondence with the measured strength. In a clinical setting, communicating results in such a visual format could help to intuitively and quickly convey the pattern of weakness in a given patient and thus add clarity to the clinical picture. In a research setting, multiple weakness pictograms can highlight patterns of weakness across groups of patients or within a single patient over time. Here we present a free, open-source application software – MuscleViz – for generating such muscle strength pictograms to provide an alternative or supplement to the written tabulation of muscle weakness.
MuscleViz provides a simple and intuitive interface for recording muscle strength (Fig. 1). For the MRC scale version of MuscleViz, results are entered by tapping a button corresponding to the measured strength (0–5), as well as an optional plus or minus modifier (Fig. 1). A separate version of MuscleViz can be used to enter results that are not recorded on a 5 point scale, such as dynamometer readings; for this version, the user types in integers for each muscle group (Fig. 2). As results are entered, a muscle strength pictogram is updated in real time and presented in a color-coded fashion. A separate “annotation” interface allows one to enter metadata, such as patient name, diagnosis, notes, etc. The muscle strength pictogram can be saved in a publication-ready vector graphics format (SVG) and could be included in a patient’s electronic medical record. All of the data (MRC scores as well as metadata) can also be saved to and loaded from a JSON file. JSON is a text-based format that benefits from being human readable as well as parsable by many popular programming languages and database programs.
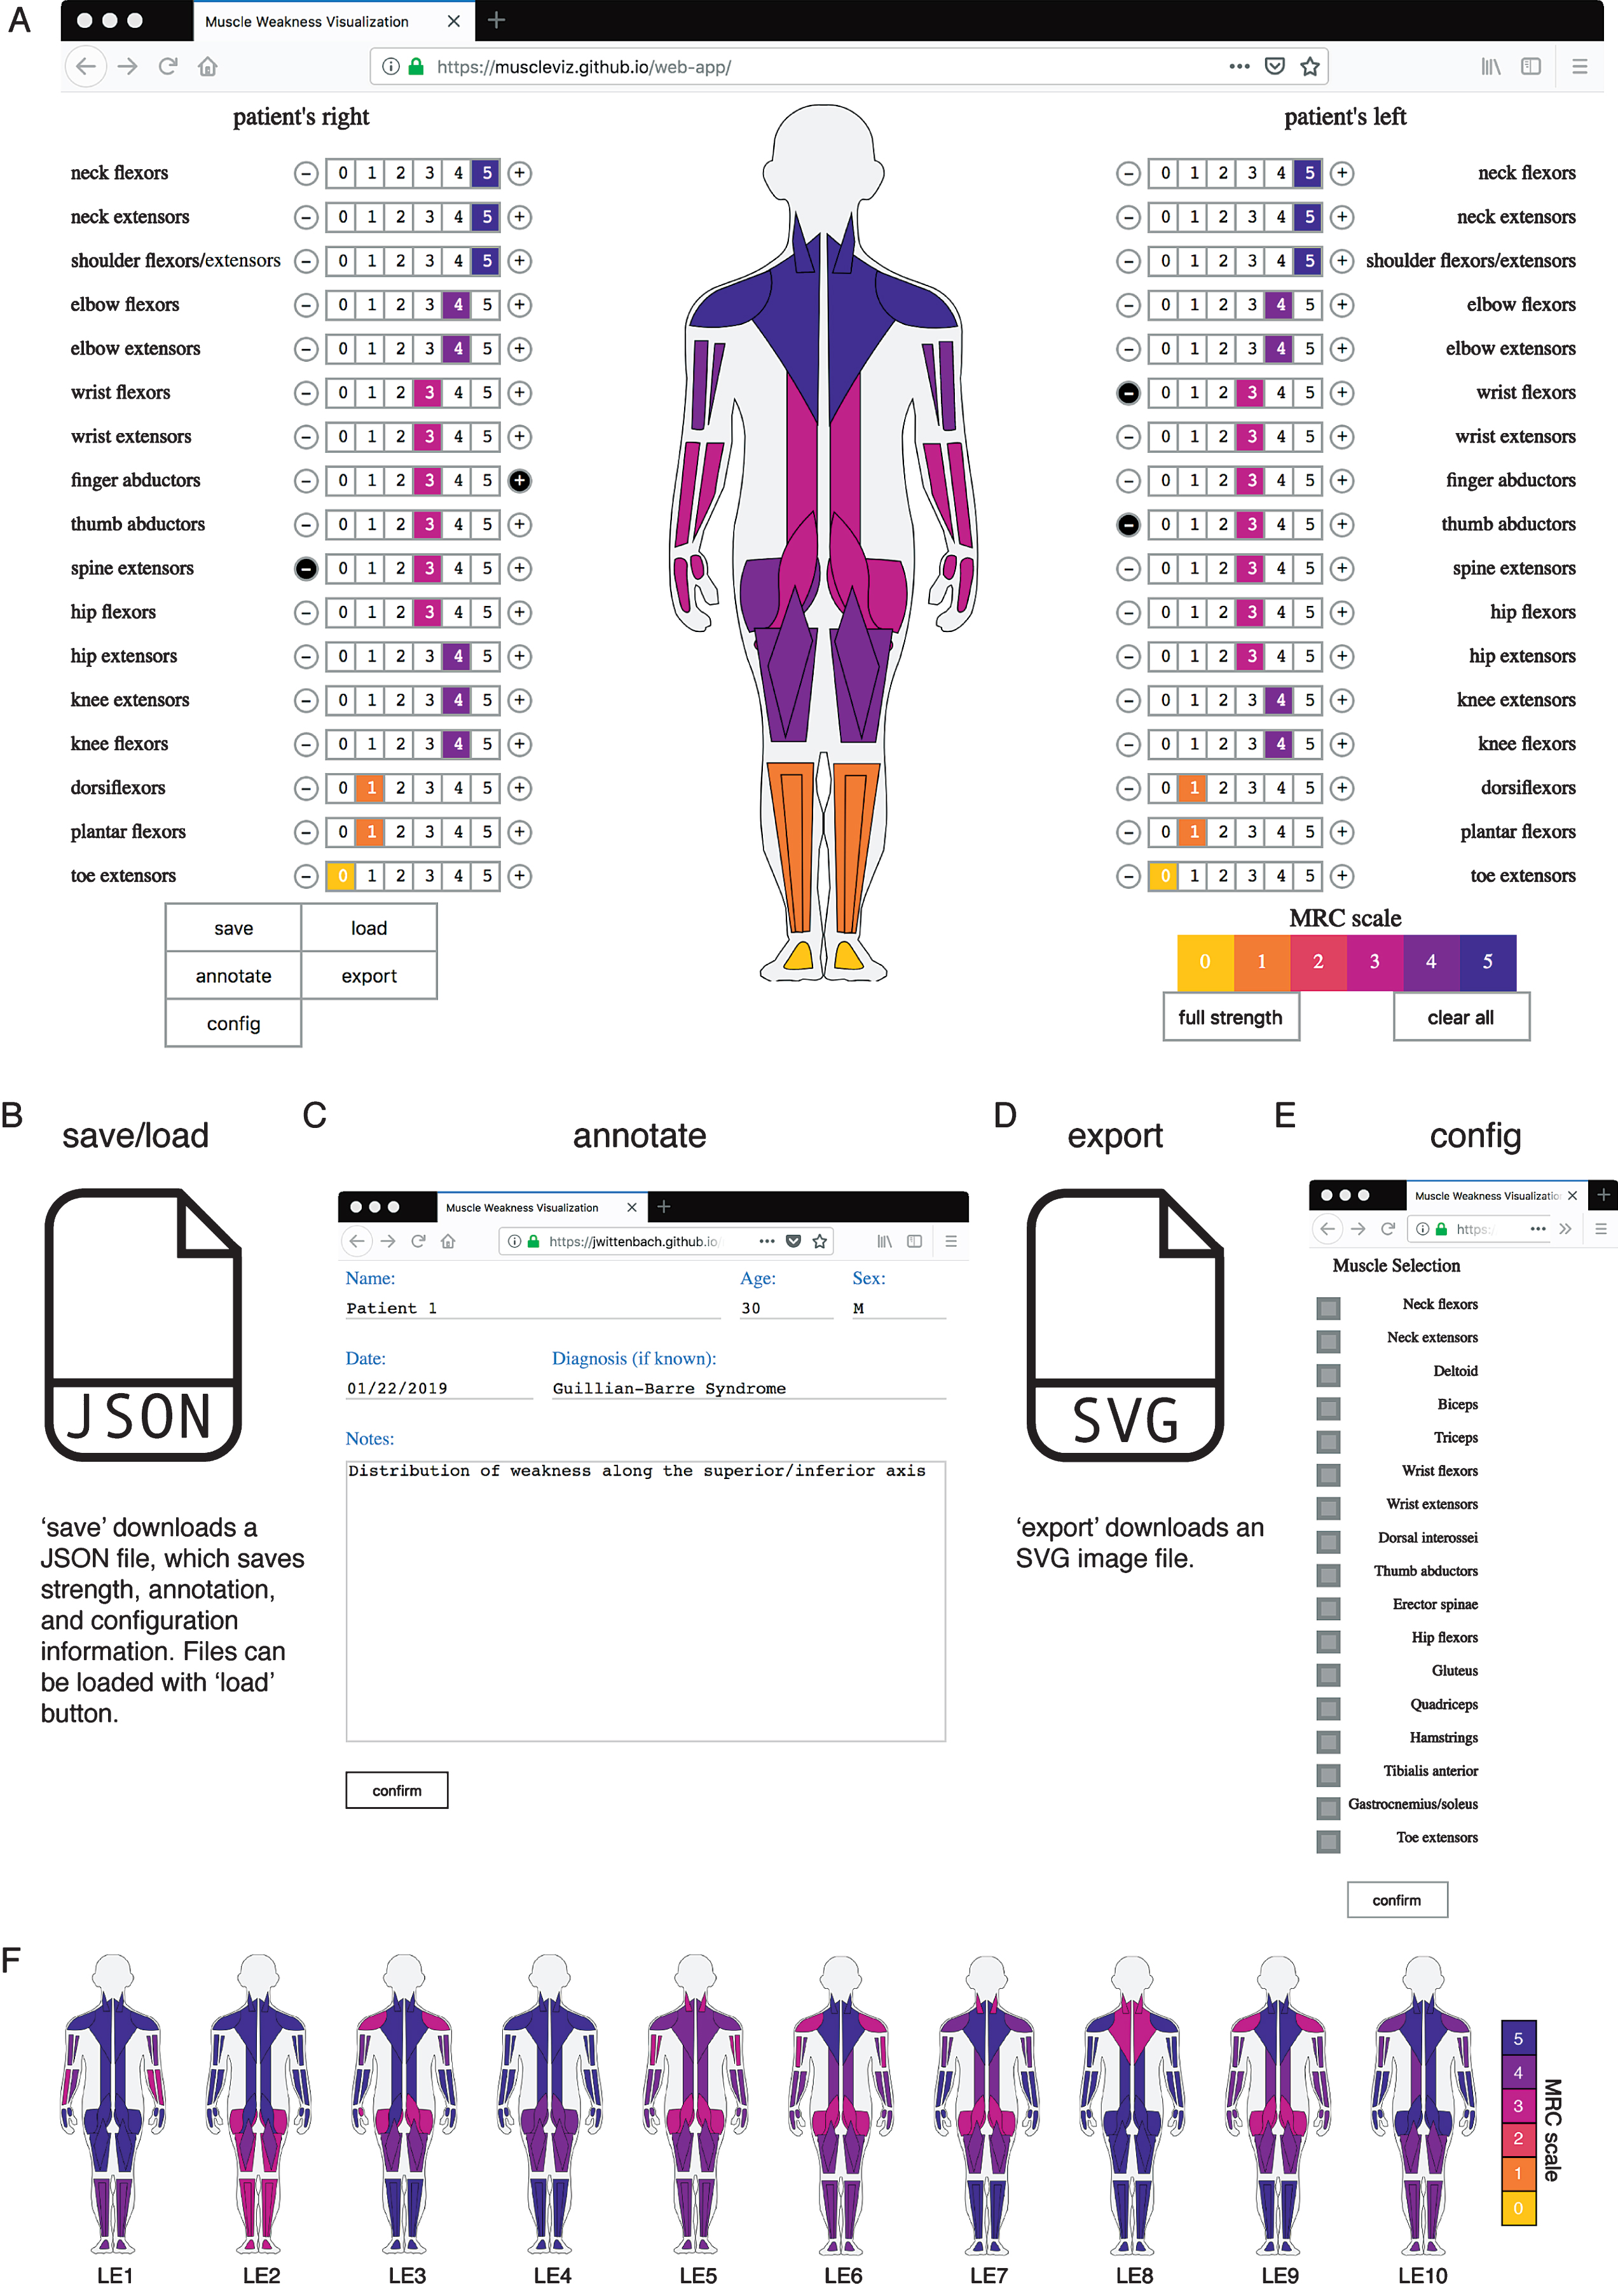
MuscleViz workflow. A) Muscle strength scores measured on the MRC scale can be entered by clicking numbers next to muscle group names. This will automatically generate a muscle strength pictogram. B) The save button will save out a JSON file, which can be loaded during a later session to restore muscle strength, annotations, and configuration changes made at the save state. C) The annotate button can be used to save notes about the patient or clinical trial participant. D) Export saves an SVG image file of the muscle strength pictogram, which can be used to generate figures for presentations or publications. E) The config button allows the user to configure which muscle groups appear in the muscle strength pictogram. F) Muscle strength examination results from cases given in the appendix of a Lambert-Eaton myasthenic syndrome case series are visualized [7]. The weakness throughout the cohort is generalized, with the most severe symptoms in proximal upper and lower limbs. By showing each patient individually, the range of heterogeneity can be more fully appreciated.
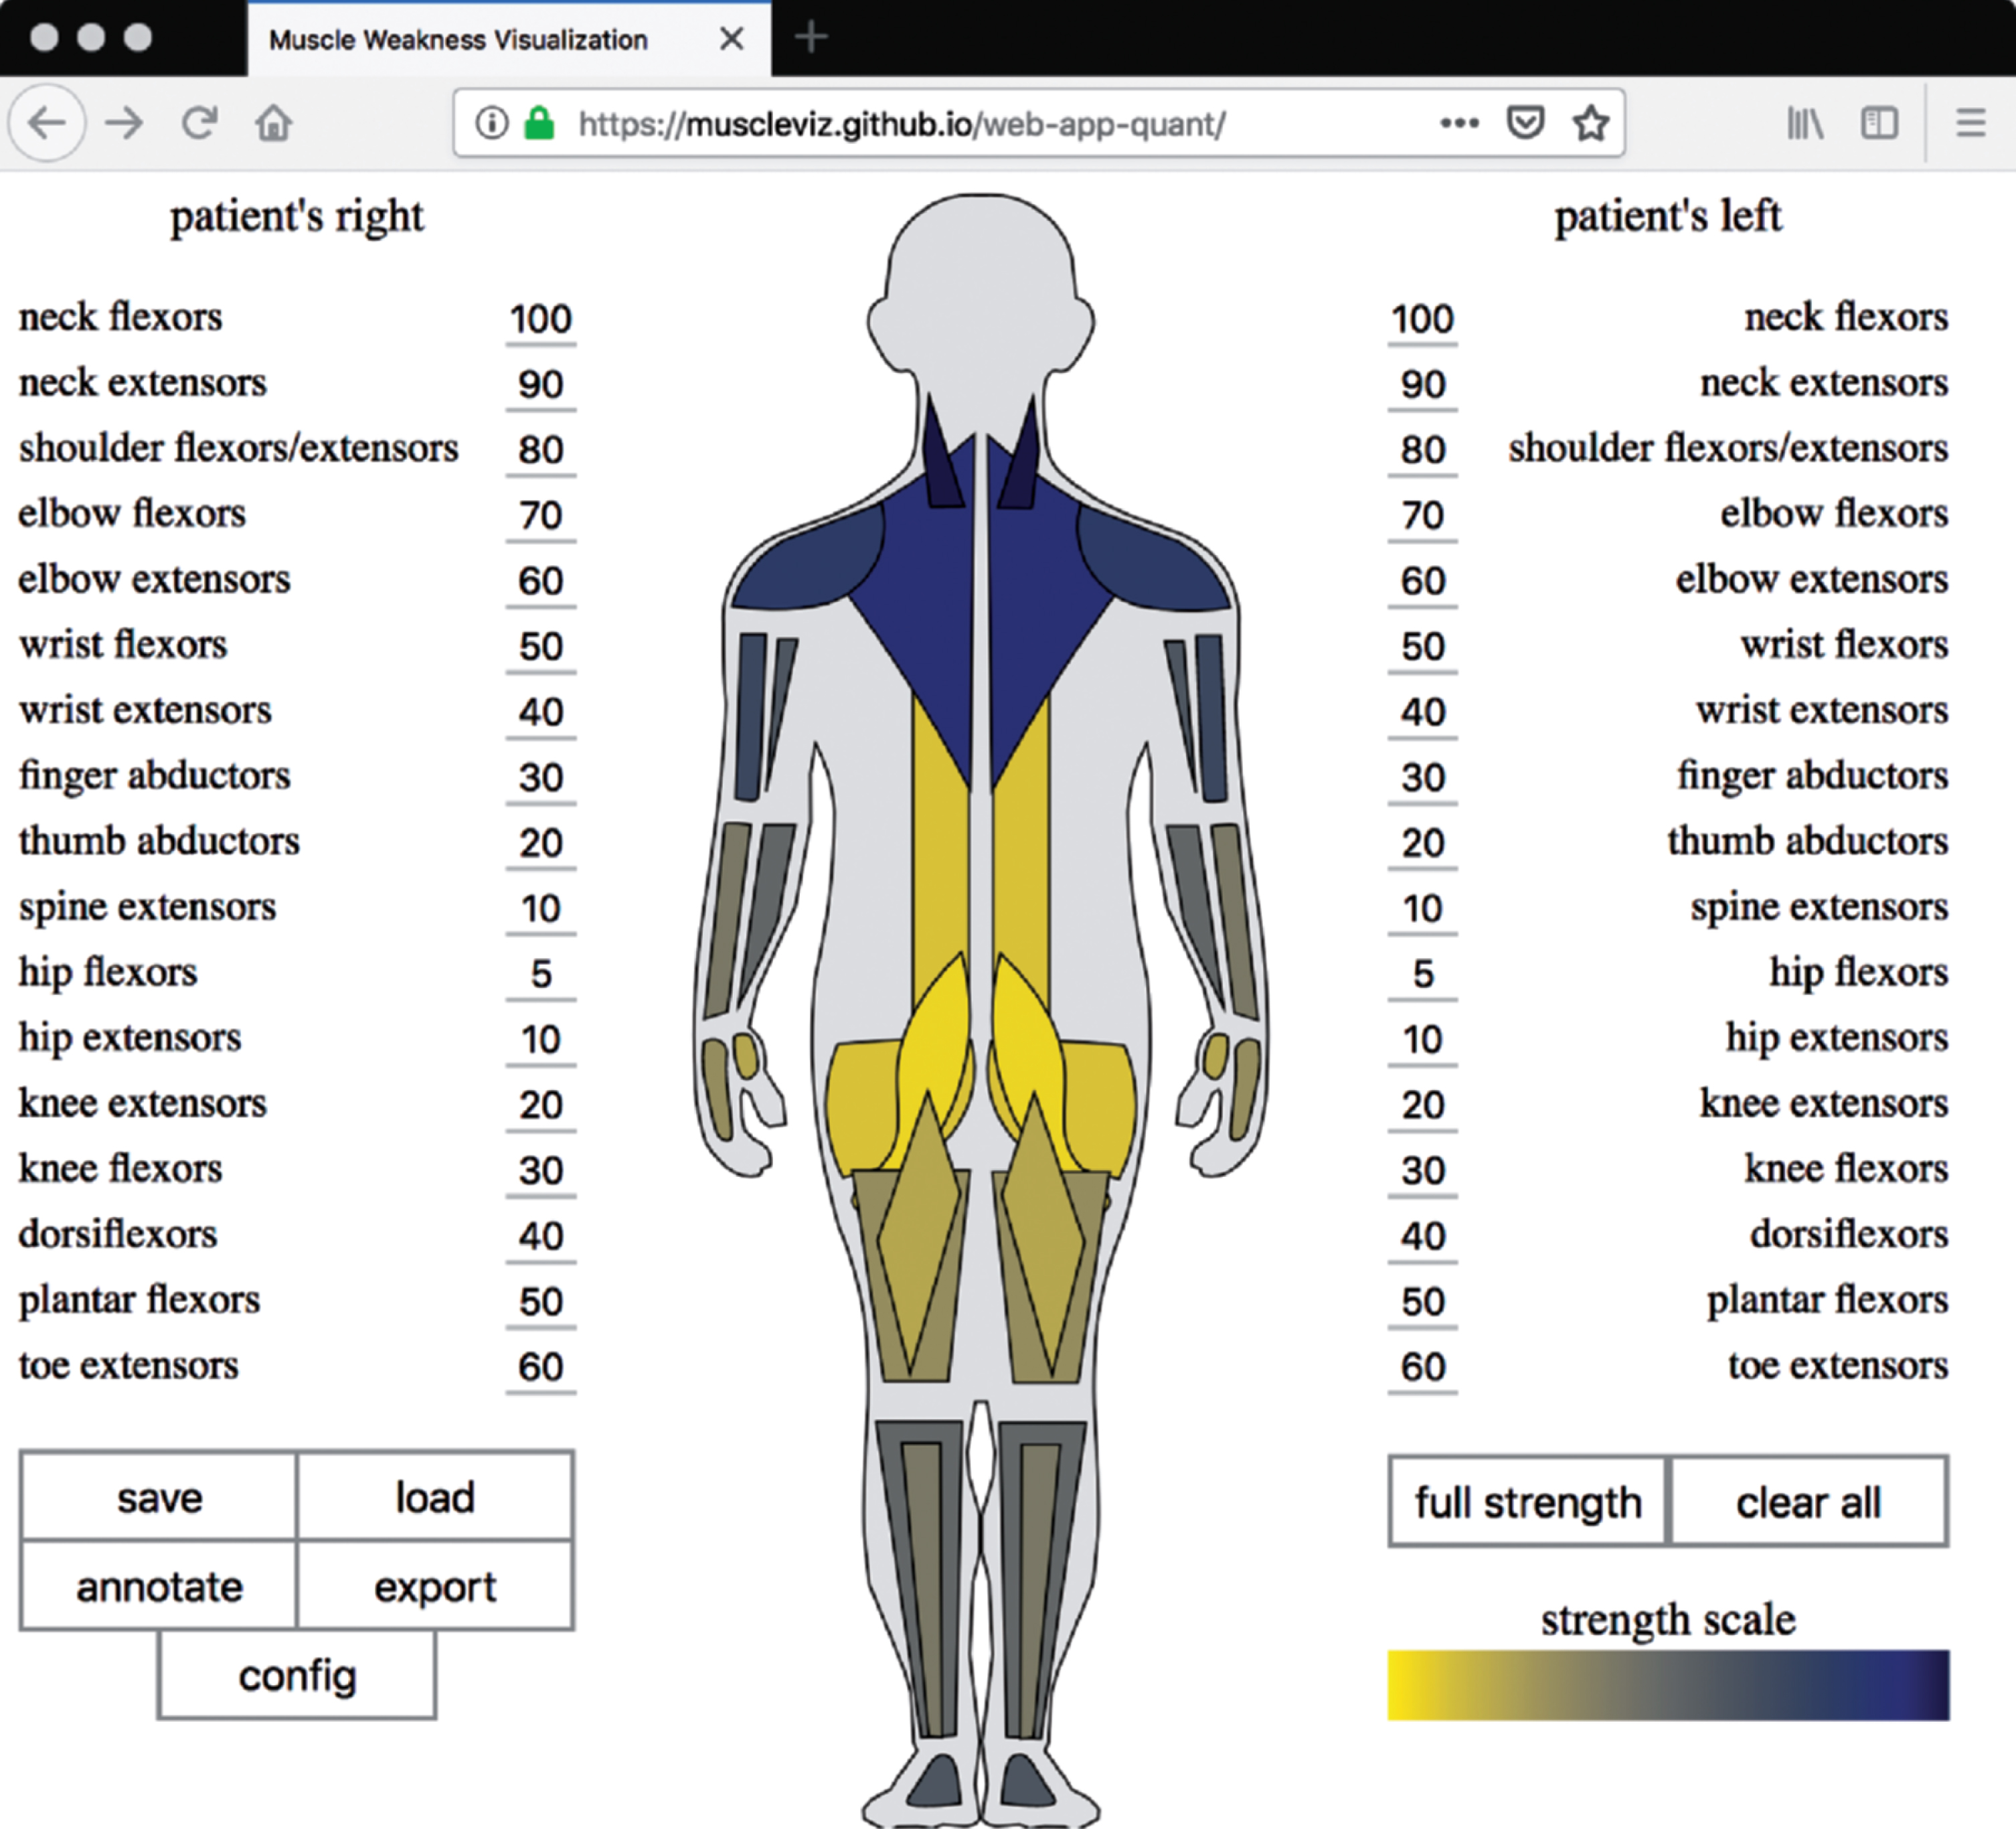
MuscleViz with quantitative scale. For some slowly progressive myopathies, the MRC scale can be unreliable [3]. The quantitative version of MuscleViz can therefore be used to map measurements of weakness from any strength scale or quantitative measurement, such as dynamometer readings, onto muscle groups.
Technology is increasingly used in patient care documentation. With the widespread introduction of electronic medical record systems, clinic visits have become increasingly dependent on technology. Effective communication requires a patient and physician connection which can be negatively impacted by technological distraction. With MuscleViz, we have not intended to further complicate the use of technology in the clinic but purposefully tried to offer software without excessive detail. MuscleViz is a tool which should provide enough information to make patterns of weakness distribution obvious, so that the patient’s clinical presentation is effectively captured by the tool. We intentionally did not include any distractions, so the recording of muscle strength using MuscleViz could be rapidly completed as part of the documentation of the routine examination. By introducing software that is simple to use, freely available, and modifiable, we hope to help lead to improved clinical diagnoses, follow-up, and communication. Another group has addressed visualizing muscle strength using software; however, the lack of availability of that tool and the underlying source code limited its usefulness for the field [4].
This MuscleViz tool and its source code are freely available. The source code (https://github.com/muscleviz) can be found in a web-based code repository where users can discuss issues about the tool and contribute to its development. MuscleViz can be used as a web application (https://muscleviz.github.io/) for the MRC scale or a quantitative scale or as a mobile application for phones and tablets, available for free download on the Apple Store for iOS devices and the Google Play Store for Android devices. This application software is not monetized, it will never contain advertisements, and it will not sell user data. Clinical data entered into the application is generated locally by users on their own machine (computer, tablet or phone) and is not accessible or saved in any other way by the authors of this application. There has been a recent push in neuroscience for free, open-source tools [5]. We believe that an increase in open-source technology would also benefit the medical community, in particular when it comes to research. We hope that this framework will be adapted by the medical community for similar uses in order to develop additional useful clinical tools.
In summary, we hope that the regular use of MuscleViz will be beneficial for communication between clinicians, for clinical research documentation, and for patient education. With MuscleViz, conveying an image of weakness will not have to rely on a mental reconstruction from a listing of tabulated strength. We anticipate that this tool will be useful both in the clinic and in reporting of case series [6]. Ideally, the use of the MuscleViz software beginning with medical students and medical residents will then lead to acceptance of this format of muscle strength visualization among senior clinicians and thus may result in improved clarity of patient presentations and as a useful platform for figure generation for publications. By displaying weakness in a uniform visual format, this tool can also be used to document progression of muscle weakness over time in the individual patient or in natural history studies. Furthermore, we hope that the release of source code will inspire others to join our efforts of open source medical tool development.
Footnotes
ACKNOWLEDGMENTS
The authors thank Jeremy Herrmann, MD for help testing early versions of the software and Matthew Cocanougher, JD for assistance with legal documentation. This project was supported by funding from the HHMI Medical Research Fellowship Program (B.T.C.) and the Gates Cambridge Scholarship (B.T.C.). This research was also supported by the Intramural Research Program of the NIH, NINDS.