
Abstract
Background:
RYR1-related disorders (RYR1-RD), are a spectrum of genetic neuromuscular disorders. Affected individuals frequently experience fatigue yet appropriate tools to assess RYR1-RD-associated fatigue remain underdeveloped.
Objective:
This study assessed the reliability and validity of two self-report questionnaires, the multidimensional fatigue inventory (MFI-20) and adult/pediatric functional assessment of chronic illness-fatigue (FACIT-F/Peds-FACIT-F) as potential fatigue measures in RYR1-RD affected individuals.
Methods:
Participants (n = 37) were enrolled in an RYR1-RD combined natural history study and clinical trial. At baseline, participants completed fatigue questionnaires, six-minute walk test (6MWT), cardiopulmonary exercise test (CPET) and saliva collection for fatigue biomarker index (FBI) quantification.
Results:
All questionnaires exhibited good test-retest reliability (n = 18, ICC > 0.80). MFI-20 (n = 37), and FACIT-F (n = 28) also showed good internal consistency (Cronbach’s α> 0.80). All MFI-20 subscales, except mental fatigue, and FACIT-F demonstrated evidence of criterion validity when correlated against percent predicted 6MWT distance (MFI-20 n = 37; r = –0.34 to –0.47, all p < 0.05, mental fatigue, r = –0.16, p = 0.35; FACIT-F n = 28, r = 0.41, p = 0.03). This was not the case for percent predicted VO2 peak (all p > 0.05). FBI correlated with MFI-20 general fatigue dimension only (r = –0.35, p = 0.03). Comparison of standardized questionnaire scores revealed that RYR1-RD affected individuals experience significantly greater fatigue than the general population.
Conclusions:
MFI-20 and FACIT-F are valid and reliable tools for assessing RYR1-RD-associated fatigue, a symptom centrally implicated in this rare disorder.
INTRODUCTION
RYR1-RD comprise the most common group of congenital-onset myopathies and affect approximately 1:90,000 pediatric individuals in the United States [1]. The major RYR1-RD histopathological subtypes include central core disease (OMIM: #117000) [2], multi-minicore myopathy (OMIM: #255320) [3], centronuclear myopathy (OMIM: #160150) [4] and congenital fiber-type disproportion (OMIM: #255310) [5]. Severe, daily fatigue is frequently reported by those affected by RYR1-RD (unpublished data). Other typical symptoms include delayed motor milestones, generalized hypotonia, decreased endurance, proximal muscle weakness, and impaired ambulation [6–9]. RYR1 encodes the skeletal muscle ryanodine receptor, RyR1, an essential component of the excitation-contraction coupling (ECC) apparatus [7]. Causative RYR1 variants (OMIM: #180901) can lead to chronic dysregulation of intracellular calcium (Ca2 +) flux between the sarcoplasmic reticulum and cytosol, as well as decreased RyR1 protein expression. This disrupts ECC and can lead to elevated oxidative and nitrosative stress and RyR1 post-translational modifications [10]. Preclinical evidence suggests that this may lead to decreased endurance and impaired skeletal muscle function in RYR1-RD affected individuals [7, 10].
Fatigue is a multidimensional symptom that can be defined as an overwhelming, sustained sense of exhaustion, with a decreased capacity for physical and mental work and prolonged recovery after physical activity [11–14]. Fatigue contributes to decreased quality of life (QoL), an important endpoint in clinical trials, by influencing physical, emotional, cognitive, and social aspects of life [13]. Self-reported multidimensional questionnaires, such as Functional Assessment of Chronic Illness Therapy-Fatigue (FACIT-F) and Multidimensional Fatigue Inventory-20 (MFI-20) [15, 16], have been designed to measure perception and severity of fatigue [14].
FACIT-F (27-item) and Peds-FACIT-F (13-item) assess the impact of fatigue on daily activities and functioning in adult and pediatric individuals affected by chronic diseases [15, 17]. Responses are self-reported and measured on 5-point Likert scales, with total scores ranging from 0–160 and 0–52, respectively. Higher total scores represent lower fatigue [14]. The validity of FACIT-F has been demonstrated extensively in the general population [17] as well as in a diverse range of disease populations, including anemia, systemic lupus erythematosus, and inflammatory bowel disease [14, 18–22]. The latter is also true of Peds-FACIT-F [23]. MFI-20 (20-items) contains five subscales: general fatigue, physical fatigue, mental fatigue, reduced activity, and reduced motivation [24, 25]. Each subscale includes four items with 5-point Likert scales. Scores on each subscale range from 4 to 20, with higher scores indicating greater fatigue. MFI-20 has been validated in a variety of chronic illness and otherwise healthy populations, ranging from cancer patients to army recruits [25–27].
The impact of fatigue and fatigue measures have not been assessed widely in neuromuscular diseases despite evidence that fatigue is a prominent feature in congenital myopathies using the fatigue severity scale [28]. In qualitative interviews with NCT02362425 trial participants, fatigue has been frequently reported as a symptom affecting quality of life (unpublished data). Although extensively used in other populations, the reliability and validity of FACIT-F and MFI-20 has not been investigated in the RYR1-RD population to date. The objective of this study was therefore to test the reliability and validity of FACIT-F and MFI-20 as measures of fatigue in RYR1-RD affected individuals.
METHODS
Participants
Participants included in this analysis were enrolled as part of a combined natural history study and clinical trial in RYR1-RD affected individuals, which tested the impact of N-acetylcysteine (NAC) treatment on oxidative stress and endurance. The study was approved by the National Institutes of Health Combined Neuroscience Institutional Review Board and registered at www.clinicaltrials.gov (NCT02362425). Informed consent/assent was obtained prior to screening and study enrollment. All participants had confirmed RYR1 variant(s) determined through genetic testing (either exome, partial/full RYR1, or targeted sequencing). Exclusion criteria included those with severe pulmonary dysfunction (FEV1 <40% predicted), were non-ambulatory, had a history of liver disease or gag reflex depression, or were currently or planning to become pregnant. Participants completed a range of measures, which included fatigue questionnaires, a six-minute walk test (6MWT) and saliva collection. Data presented in this study were obtained during the baseline study visit (n = 37) and at 1-month follow-up (n = 18).
Questionnaires
At baseline visits to the National Institutes of Health Clinical Center, study participants (n = 37) were asked to complete the FACIT-F (18 years and older) or the Peds-FACIT-F (8 to 17 years old) and MFI-20 questionnaires (8 years and above) through the online, self-administered Clinical Trials Survey System. At 1 month following baseline visits, a convenience sample of participants (n = 18) remotely self-administered MFI-20 and FACIT-F/Peds-FACIT-F for assessment of test-retest reliability.
Six-minute walk test
Study participants completed a 6MWT which was administered by a physical therapist in accordance to American Thoracic Society Guidelines [29]. Since the 6MWT is self-paced, the test reflects daily functional capacity and whole body functional performance [29, 30]. Furthermore, fatigue includes both physical fatigability and fatigue perception, and both have been found to have a significant burden on self-paced exercise capacity, e.g. when performing the 6MWT [31, 32]. Percent predicted 6MWT distance provides an informative measure of an individual’s functional capacity relative to general population normative values. Importantly, percent predicted 6MWT distance takes into account the age, height, and sex of the individual [33].
Saliva collection and salivary fatigue biomarker index quantification
Salivary fatigue biomarker index (FBI), an objective measure of physical fatigue, was determined by measuring the concentrations of two salivary peptides, ESPSLIA and GGHPPPP, and then calculating the fatigue index as the log transformed ratio, i.e. log10 ([ESPSLIA]/[GGHPPPP]). Saliva samples were obtained from study participants (n = 37) using a cotton wad designed for saliva collection (Salivette, Sarstedt, Deutschland). Each participant placed the wad in their mouth, gently masticated for five minutes, and then returned the wad to the sample vial. Following this, samples were frozen immediately on dry ice and maintained at –80°C until processing. Samples were thawed at room temperature followed by filtration using 10 kDa molecular cut-off filter (Amicon, USA). Two hundred microliters of filtered saliva was diluted with 800μL of distilled water containing internal standards (isotopically labeled GGHPPPP and ESPSLIA). The final concentration of both isotopic internal standards was 400 ng/mL. GGHPPPP and ESPSLIA concentrations were determined by liquid chromatography-tandem mass spectrometry (LC/MS-MS) (Waters Acuity UPLC, Waters, USA; Water, Quatro Premier XE, USA). A linear mobile phase gradient was used (phase A, distilled water plus 0.1% formic acid; phase B, acetonitrile plus 0.1% formic acid). Starting composition at time of injection was 98% mobile phase A and 2% mobile phase B with an end composition, 3.5 minutes after injection, of 50% A and 50% B, at a constant flow rate of 0.6 mL/min. A C-18 stationary phase was used (HSS T2, 1.8 um, Waters, USA). Under these conditions ESPSLIA and GGHPPPP elute at 1.85 and 1.02 minutes respectively. ESPSLIA and GGHPPPP are linear from 8 to 4000 ng/mL and 2 to 1000 ng/mL, respectively. The intra-run and inter-day % coefficient of variation was less than 10%.
Cardiopulmonary exercise testing
Participants completed an incremental cardiopulmonary exercise test using an electronically braked cycle ergometer. Participants were asked to maintain a pedaling cadence of >30 rpm for the duration of the test. The test was stopped once pedaling cadence fell below 30 rpm despite verbal encouragement. Peak oxygen uptake (VO2 peak) attained during the test was recorded by breath to breath analysis and established predictive algorithms, developed using normative data from otherwise pediatric and adult individuals [34, 35], were used to determine predicted VO2 peak values.
Statistical analyses
The Statistical Package for the Social Sciences (SPSS, version 22.0) was used for all statistical analyses. Data distribution was assessed using the Shapiro-Wilk test. Cronbach’s α was calculated to determine the internal consistency of FACIT-F and MFI-20 questionnaire items. Test-retest reliability was determined by calculating the intra-class correlation coefficient (ICC; 2-way mixed-effects model) between FACIT-F and MFI-20 assessments completed at baseline and 1 month±5-day follow-up. Using scores from 13 standardized FACIT-F questions, as described elsewhere [17], respondents were characterized as having fatigue that did not deviate from general population (raw score >43), fatigued (raw score 18–43), and severely fatigued (raw score <17). A summary independent t-test was used to compare the average standardized questionnaire response between RYR1-RD affected individuals and the previously reported mean±SD for the United States general population (n = 1001) [17]. Similarly, summary independent t-tests were used to compare total MFI-20 subscale scores between the RYR1-RD and United States general population (n = 222) [25]. Fatigue is frequently associated with a decrease in physical activity level therefore criterion validity was evaluated by determining the Spearman’s correlation coefficient between questionnaire scores and percent predicted 6MWT distance (physical endurance), percent predicted VO2 peak (cardiorespiratory fitness), and FBI (physical fatigue). Spearman’s rank correlation coefficient was also used to determine if percent predicted 6MWT distance correlated with percent predicted VO2 peak. Correlational analyses were considered assessments of the convergent subtype of criterion validity as questionnaire scores were compared with established tools used for assessing the same construct. Correlations were designated as small (0.10–0.29), medium (0.30–0.49), and large (>0.50) [36]. Potential floor and ceiling effects for MFI-20, FACIT-F and Peds FACIT-F were assessed as previously described [37]. Briefly, a floor or ceiling effect was considered present when ≥15% of respondents achieved the lowest or highest score, respectively.
RESULTS
Participant summary demographics are presented in (Table 1) and descriptive statistics for self-reported fatigue questionnaire scores are presented in (Table 2). Overall, 73% of individuals included in this analysis had either a dominant or a de novo mode of inheritance. The remaining 27% were recessive with compound heterozygosity. Affected RyR1 structural domains included the cytosolic shell (22% of cases), channel and activation core (62% of cases), and both domains affected (16% of cases). RYR1-RD FACIT-F respondents (n = 28) exhibited significantly greater self-reported fatigue compared the U.S general population (mean±SD standardized score 21±9 [range 8–38] vs. 43.6±9.4 [range 2–52], p < 0.001) [17]. Moreover, 39% of RYR1-RD FACIT-F respondents demonstrated severe fatigue (standardized score <17). RYR1-RD MFI-20 respondents (n = 37) also exhibited significantly greater self-reported fatigue for each MFI-20 subscale, except mental fatigue, when compared to the U.S general population (general fatigue, 12.95±4.29 vs. 8.42±3.59; physical fatigue, 12.68±4.47 vs. 7.77±3.36; reduced activity, 9.11±4.13 vs. 6.76±2.67 all, p < 0.001; reduced motivation, 8.00±3.37 vs. 6.82±2.91 p = 0.027; mental fatigue 8.32±3.81 vs. 7.23±3.07, p = 0.055) [25]. The majority of pediatric participants did not achieve a respiratory exchange ratio (RER) indicative of maximal aerobic effort (RER ≥1.1) therefore VO2 peak data herein is presented for adults only (n = 28). In adults that successfully completed CPET (n = 28), mean±SD percent predicted VO2 peak was 71.5±23.3%. Percent predicted 6MWT distance was strongly correlated with percent predicted VO2 peak (r = 0.72, p < 0.001), (Fig. 2). A floor-effect was identified for the MFI-20 mental fatigue subscale, with 16% of respondents recording the lowest score. No other floor or ceiling effects were observed for MFI-20, FACIT-F, or Peds-FACIT-F.
Participant summary demographics (n = 37)1
1Data are presented as mean±SD or as a ratio.
Self-reported fatigue questionnaire scores in RYR1-RD affected individuals
Test-retest reliability and internal consistency
The ICC between FACIT-F assessments was 0.93 for all RYR1-RD patients with assessments completed within 1 month±5 days of each other (n = 18). The ICC for all five MFI-20 subscales were greater than 0.80 (n = 18). The ICC values for each MFI-20 subscale were as follows: general fatigue: 0.91, physical fatigue: 0.80, reduced activity: 0.83, reduced motivation: 0.80, and mental fatigue: 0.81. The internal consistency of the FACIT-F questionnaire was 0.81 (n = 28), while the internal consistency of the Peds-FACIT-F questionnaire was 0.39 (n = 9). The overall internal consistency of MFI-20 subscales was 0.83 (n = 37).
Criterion validity
FACIT-F total scores showed a medium correlation with percent predicted 6MWT distance (n = 28; r = 0.41, p = 0.03, (Fig. 1F)). A positive trend was observed between Peds-FACIT-F total scores and percent predicted 6MWT distance (n = 9; r = 0.66, p = 0.05, (Fig. 1G)). General fatigue, physical fatigue, reduced activity, and reduced motivation MFI-20 subscale scores showed medium, inverse correlations with percent predicted 6MWT distance (n = 37; r = –0.47, p = 0.004, r = –0.47, p = 0.003, r = –0.39, p = 0.02, r = –0.34, p = 0.04, respectively, (Fig. 1A–D)). This was not the case for the MFI-20 mental fatigue subscale (Fig. 1E). A medium inverse correlation (r = –0.35, p = 0.03) was observed between FBI and the MFI-20 general fatigue subscale (Fig. 1H). FBI and MFI-20 physical fatigue subscale score were not correlated (r = –0.16, p = 0.33, (Fig. 1I)). Percent predicted VO2 peak achieved during CPET were not correlated with MFI-20 (all subscales) or FACIT-F/Peds-FACIT-F (all p > 0.05).
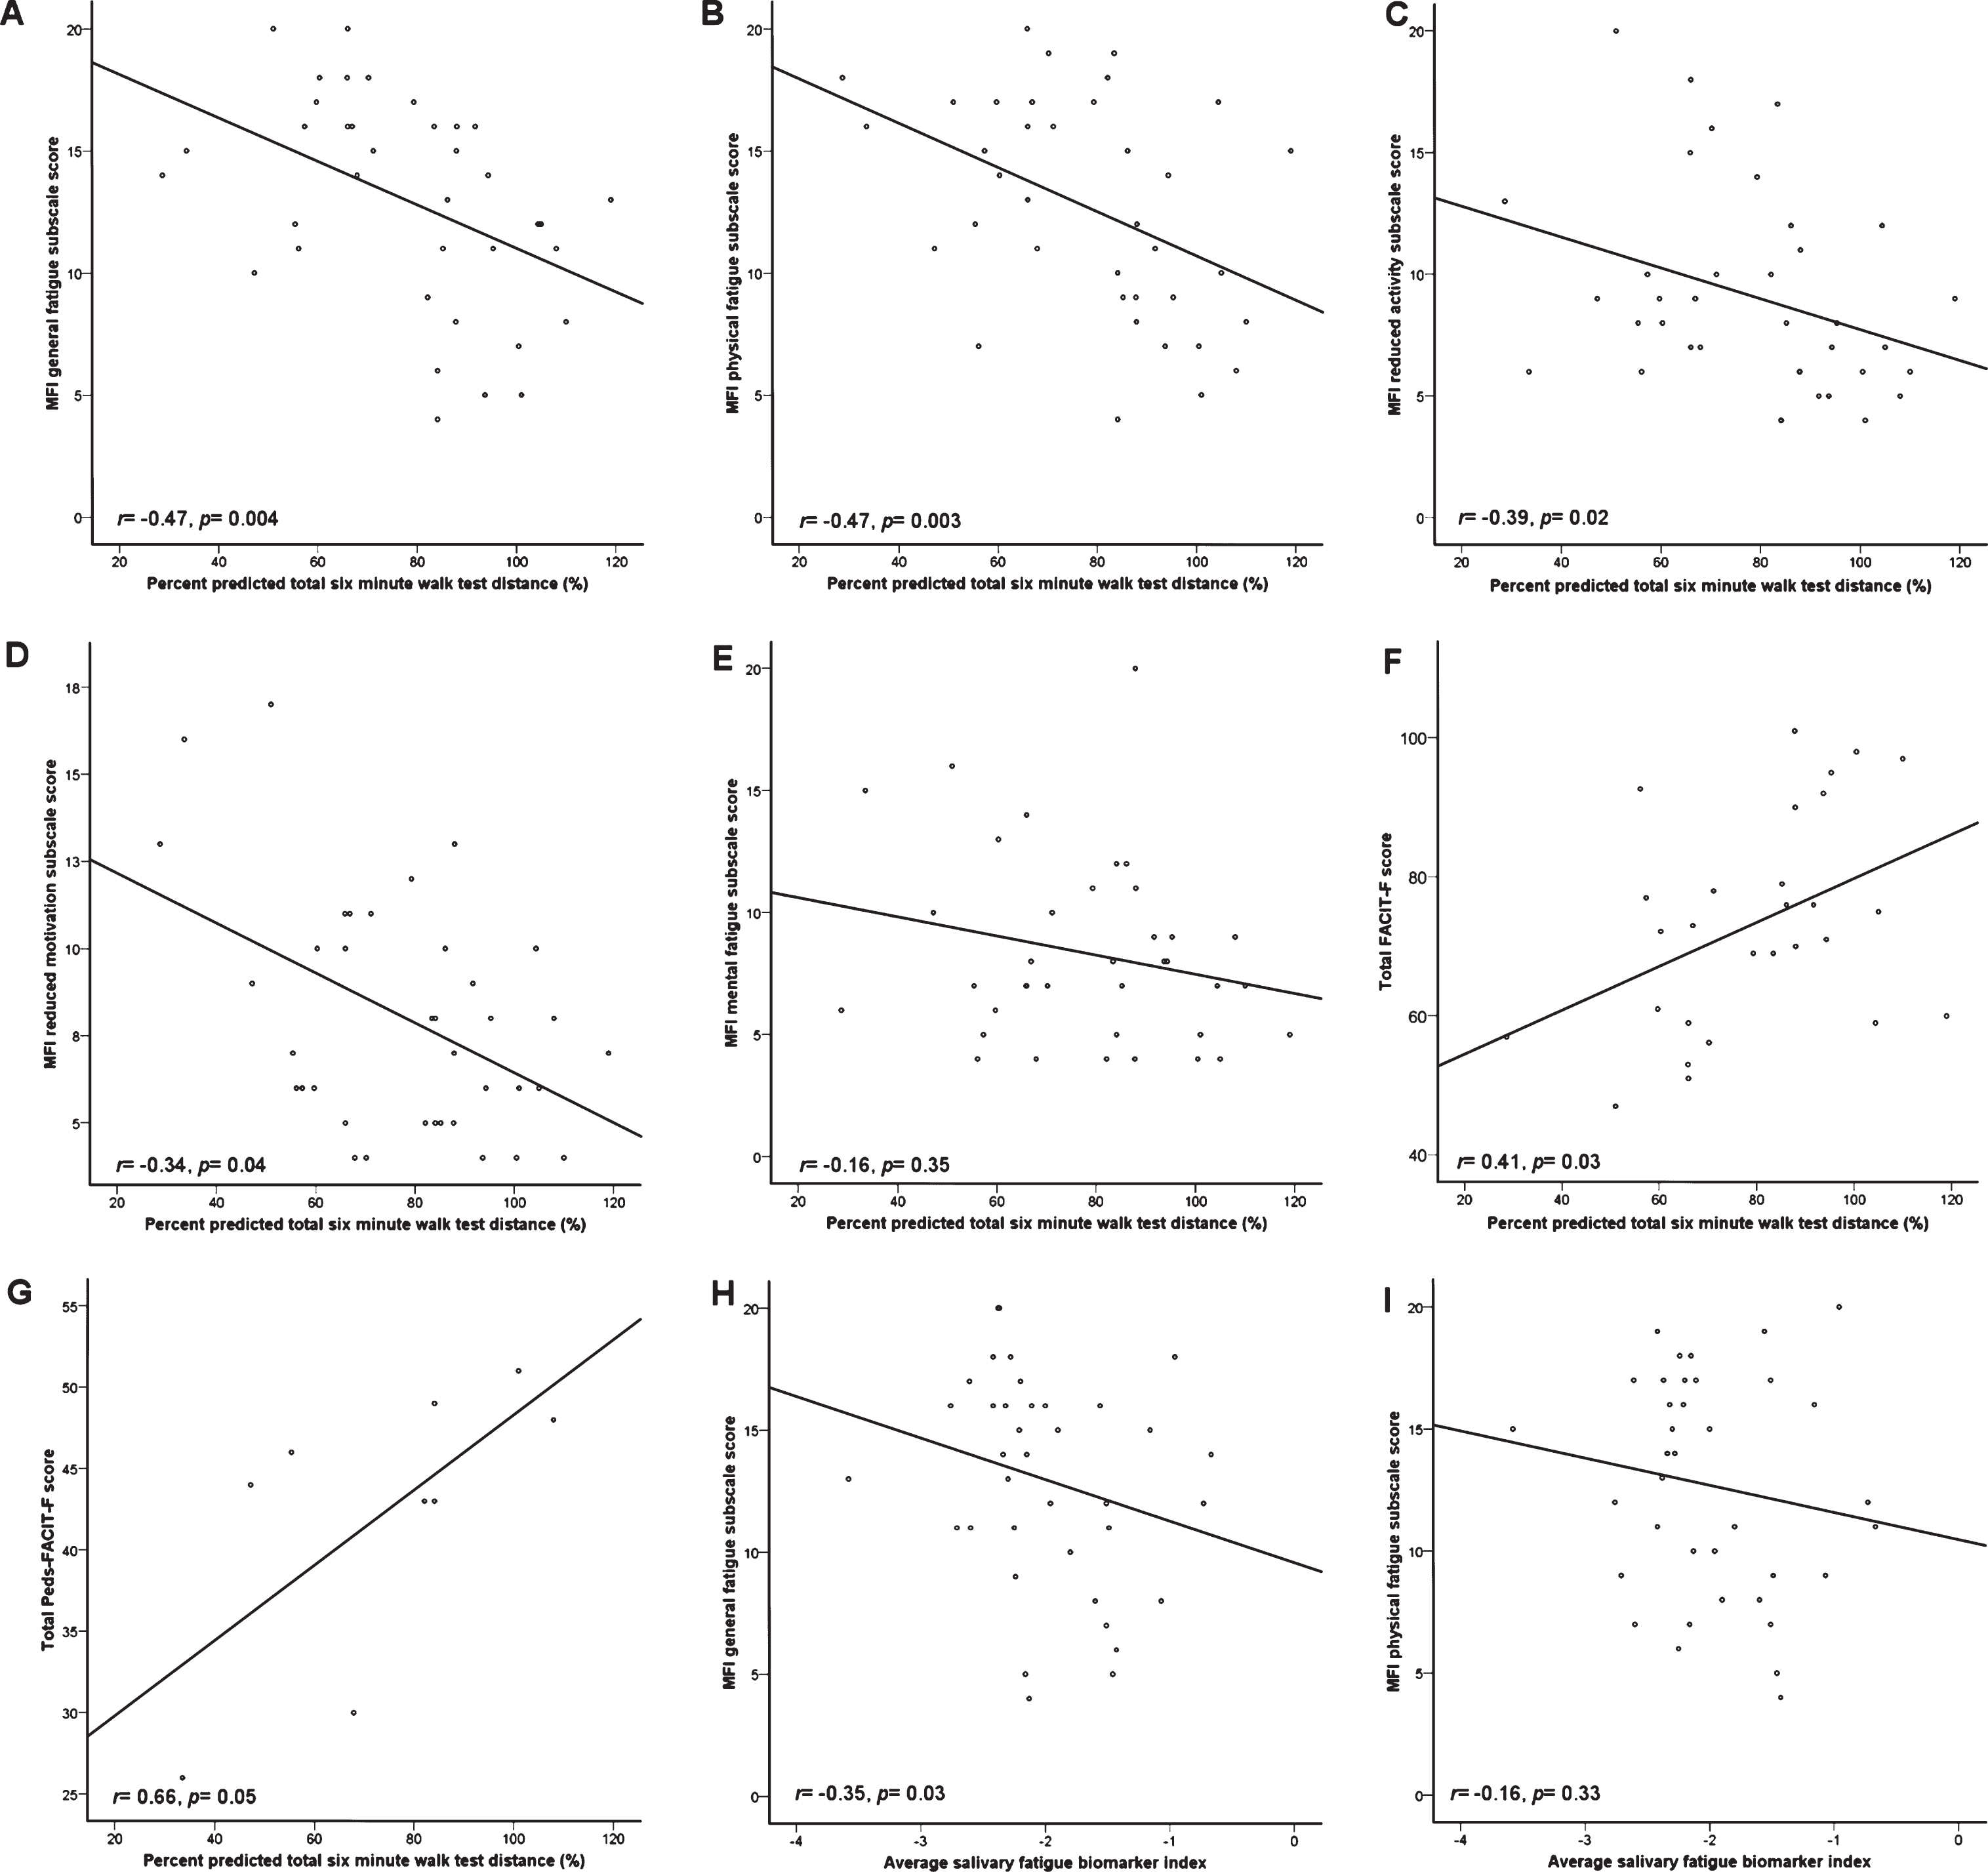
Scatterplots detailing trends between fatigue questionnaire scores and objective fatigability measures. A–E, MFI-20 subscale scores versus percent predicted 6MWT distance. F and G, FACIT-F and Peds-FACIT-F versus percent predicted total 6MWT distance, respectively. H and I, MFI-20 subscales versus FBI. FBI did not show a trend with either adult or pediatric FACIT-F (data not shown).
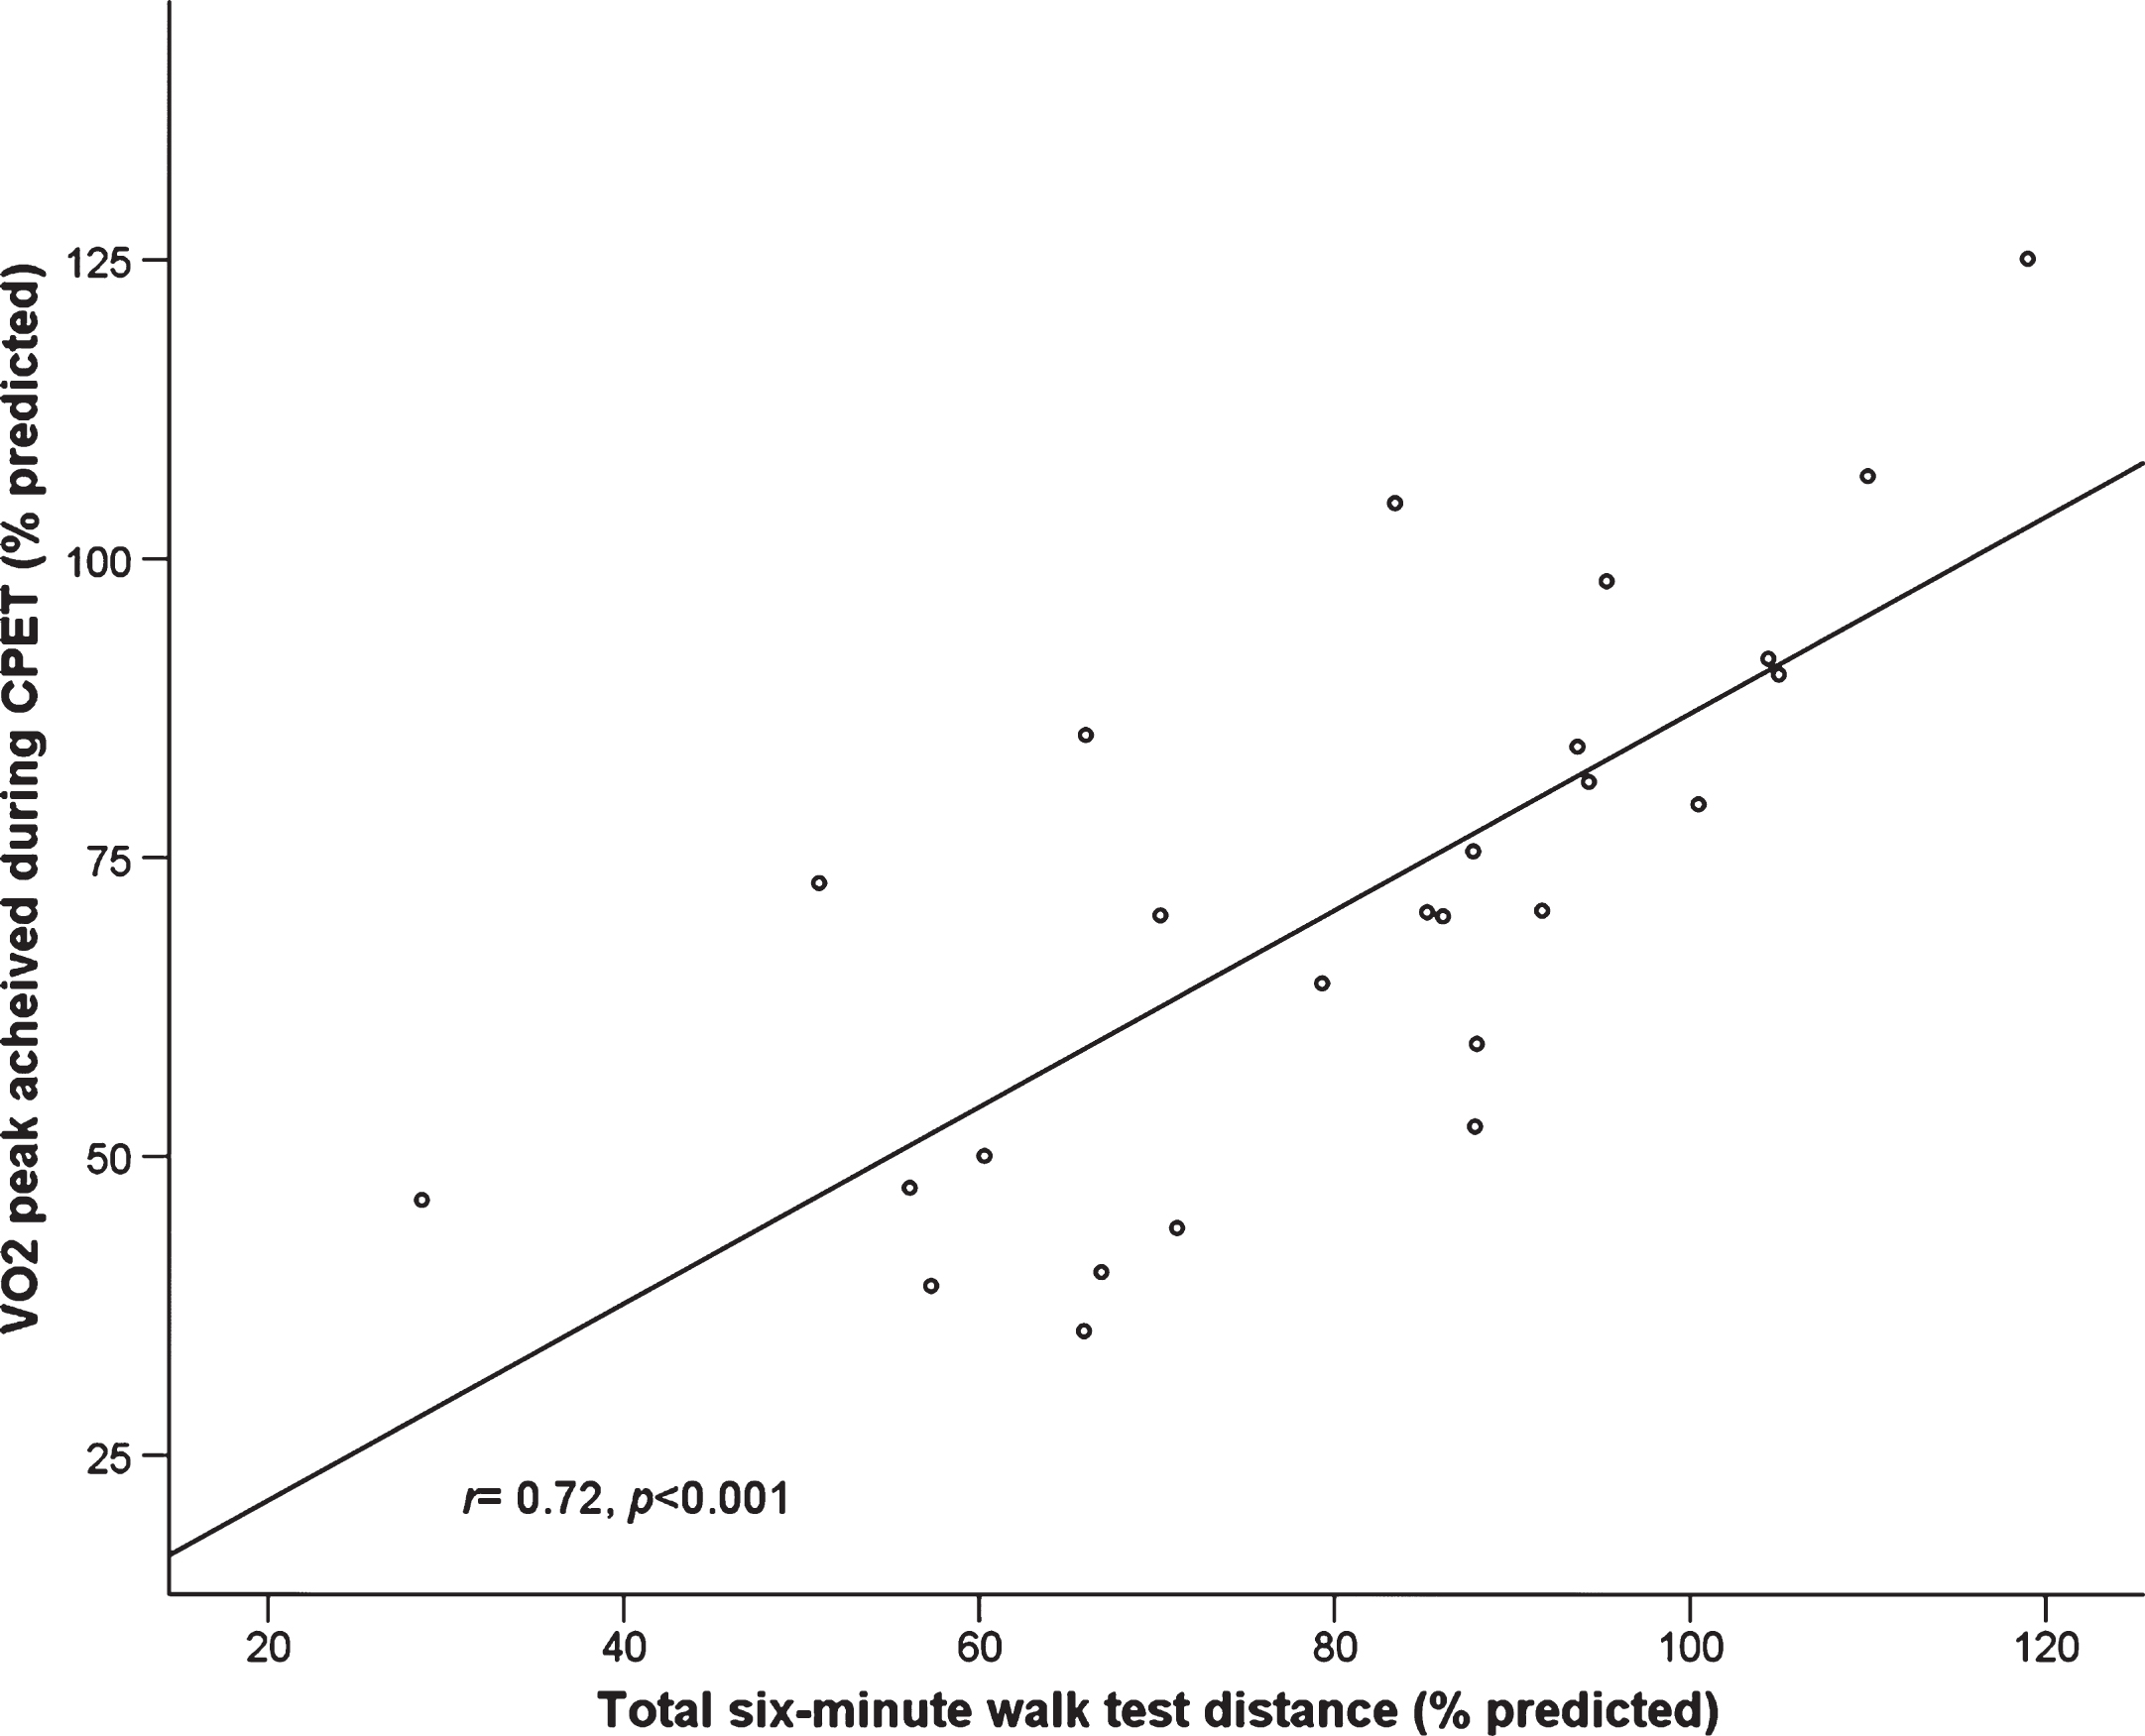
Percent predicted six-minute walk test distance and percent predicted VO2 peak are highly correlated in RYR1-RD affected adults (n = 28).
DISCUSSION
This study demonstrates, for the first time, that FACIT-F and MFI-20 are reliable and valid instruments to measure fatigue in RYR1-RD affected adults. In addition, FACIT-F standardized scores of this cohort confirm that fatigue is a prominent symptom associated with RYR1-RD. Moreover, this study has revealed that RYR1-RD affected individuals experience significantly greater fatigue than the general population, as determined by comparison of standardized FACIT-F scores and MFI-20 data. Moreover, this is supported by the observation that RYR1-RD affected adults achieve, on average, 71% of their predicted VO2 peak during CPET. Overall, our findings are concordant with a recent study of other fatigue assessment tools in RYR1-RD affected individuals [38].
FACIT-F exhibited excellent internal consistency in the adult RYR1-RD population with a Cronbach’s α= 0.81. This is comparable to the level of internal consistency previously reported in cancer patients, using FACT-Fatigue, and other chronic diseases in which FACIT-F has been validated [14, 18–22]. However, this was not the case for Peds-FACIT-F, most likely due to the small pediatric sample size (n = 9; Cronbach’s α= 0.39). The FACIT-F scale exhibited excellent reliability in the RYR1-RD population, with an ICC of 0.93; which is comparable to the ICC reported among psoriatic arthritis patients (0.95) and cancer patients (0.84–0.90) using FACT-Fatigue [14, 18]. All MFI-20 subscales had an ICC >0.80 and Cronbach’s α= 0.83, indicating good test-retest reliability and internal consistency, respectively. The ICC range for the MFI-20 in the RYR1-RD population (0.80 to 0.91) was comparable to the ICC range reported previously in populations where fatigue is also a common symptom that negatively impacts health-related quality of life [24, 39–42].
A medium positive correlation was observed between total FACIT-F scores and percent predicted 6MWT distance thus suggesting that, in this population, lower self-reported fatigue is associated with greater physical endurance. A promising positive trend was also identified between Peds-FACIT-F and percent predicted 6MWT distance although this fell short of statistical significance, likely due to the limited number of pediatric participants. FACIT-F has been validated in many other patient populations that experience fatigue and, based on the results of the current study, should also be considered a valid measure of fatigue in the adult RYR1-RD population [14, 17–22]. Importantly, total distance walked may give misleading results when used as an indicator of disease severity; especially when a cohort exhibits a wide dispersion with regard to sex, age, and height. Determining percent predicted 6MWT distance addresses this limitation by accounting for disparities in the abovementioned contributory variables and has been shown to correlate better with health-related QoL questionnaire scores [43]. The positive trend observed for Peds-FACIT-F should be corroborated in a study with a larger pediatric sample size.
All MFI-20 subscales, except mental fatigue, were inversely correlated with percent predicted 6MWT distance indicating that greater-self-reported fatigue is associated with decreased physical endurance. It has been recognized that mental fatigue is unlikely to be major feature of neuromuscular disease symptomatology [44]. This is supported by the floor-effect observed for this subscale score and may also explain why no correlation was observed. Alternatively, this finding may be owing to the RYR1-RD population being resilient to mental fatigue in spite of physical fatigue. General fatigue and physical fatigue were most strongly correlated with 6MWT distance (both r = 0.47, p < 0.01) and may therefore represent promising candidate fatigue subtypes to investigate in future studies of RYR1-RD affected individuals. Since the majority of MFI-20 subscales were moderately correlated with percent predicted 6MWT distance, this tool should be considered a robust measure of fatigue in individuals affected by RYR1-RD.
The 6MWT is designed to assess endurance whereas CPET incrementally challenges an individual’s cardiorespiratory fitness. Although distinct tests, the two are inter-related. This is supported by numerous reports of statistically significant positive correlations between the two measures; a finding that was replicated in the RYR1-RD population as part of this study [45–47]. RYR1-RD affected individuals that achieved a higher percent predicted distance walked during 6MWT also achieved greater percent predicted VO2 peak during CPET. By comparison, 6MWT is less strenuous than CPET. As such, in order to decrease participant burden, development of a reference equation to more accurately predict cardiorespiratory fitness in this population would be welcomed; especially given the reports of RYR1—related exercise intolerance and non-drug-induced MH-like episodes [48]. As discussed above, FACIT-F and MFI-20 scores were associated with percent predicted 6MWT distance, however, this was not the case for VO2 peak. A potential explanation for this disparity is that 6MWT may better reflect the level of physical exertion encountered in everyday life by RYR1-RD affected individuals, compared to CPET. This is pertinent given that both FACIT-F and MFI-20 query recently experienced fatigue-related symptoms rather than acutely querying the fatigue experience post-CPET.
FBI, a biomarker of physical exhaustion [49, 50] was moderately correlated with general fatigue (r = –0.35, p = 0.03) on the MFI-20 but not with any other MFI-20 or FACIT-F/Peds-FACIT-F subscale (all, p > 0.05). The MFI-20 general fatigue subscale addresses generalized expressions of fatigue related to functioning, including its physical and psychological aspects [25]. The general fatigue subscale may capture complexities of fatigue in patients with chronic conditions such as RYR1-RD better than individual dimensions. Although beyond the scope of this study, owing to limited sample size, exploratory factor analysis would be useful in determining which specific MFI-20 items are contributing to this correlation. Despite the limited sample size, this study represents the largest assessment of self-reported fatigue in this rare disease population to date.
Due to the limited number of pediatric participants in this secondary analysis (n = 9), the use of Peds-FACIT-F requires further investigation in a larger cohort of pediatric RYR1-RD affected individuals in order to confirm whether it is a valid tool for fatigue assessment in younger affected individuals. Although there were limited positive findings in this study with regard to FBI, this biomarker may be best suited to tracking physical fatigue in RYR1-RD affected individuals across the lifespan; an approach that would be made possible with a natural history study [50, 51]. Fatigue was a chief complaint among study participants during qualitative interviews, second only to muscle weakness (unpublished data), and is supported by comparison of FACIT-F and MFI-20 results between RYR1-RD and general populations. Evaluating fatigue in neuromuscular diseases, especially in those where oxidative stress has been implicated, is crucial to a better understanding of affected individuals’ experience. It is, however, important to recognize that individuals with neuromuscular disease may exhibit comorbidities that could influence the respondent’s perception of fatigue. In particular, muscle weakness may be misinterpreted as fatigue on self-report questionnaires. Performing semi-structured interviews may help to discern between weakness (decrease in muscle strength) versus fatigue (tiredness resulting from or independent of exertion) in affected individuals [52]. This study provides preliminary data supporting the use of MFI-20 and FACIT-F to assess fatigue in those affected by RYR1-RD.
CONFLICT OF INTEREST
The authors have no conflict of interest to report.
Footnotes
ACKNOWLEDGMENTS
The authors would like to thank all study participants for their commitment to this study. The authors would like to thank Dr. Ellen Smets of the University of Amsterdam’s Faculty of Medicine for permission to use the MFI-20 questionnaire and FACIT.org for permission to use FACIT-F in this study. This research was supported by the Division of Intramural Research, National Institute of Nursing Research, National Institutes of Health and a 2013 NIH Clinical Center Bench to Bedside Award.