
Abstract
Background/Aim:
Pulmonary function tests are used for screening respiratory insufficiency in patients with myotonic dystrophy (DM). We analysed the agreement between two different approaches in assessment of abnormal findings of forced vital capacity (FVC), forced expiratory volume in the first second (FEV1), maximal inspiratory pressure (MIP) and maximal expiratory pressure (MEP), in DM patients.
Methods:
We used Cohen’s κ- and Bangdiwala’s B- statistic to compare the agreement between different cut-off values recommended by experts (ENMC) and the cut-off values based on the reference range (RR). We further analysed their sensitivity (Sn) and specificity (Sp) in detecting symptoms associated with respiratory insufficiency.
Results:
The observed agreement was: 1) for FVC: κ= –0.002, B = 0.406; 2) for FEV1: κ= 0.944, B = 0.946; 3) for MIP: κ= 0.625, B = 0.674; and 4) for MEP: κ= 0.241, B = 0.373. Overall, RR cut-off values showed higher sensitivity, whereas the ENMC values showed higher specificity in detecting symptoms of respiratory involvement.
Conclusions:
The two approaches showed perfect agreement in assessment of FEV1, substantial agreement for MIP, and weak agreement for FVC and MEP. RR is an established method of assessment for spirometry and should be favoured because it takes variability within the population into account. Further development and validation of regression equations for RR calculations of predicted maximal respiratory pressures, with corresponding lower limits of normal, is required.
The B statistic is more robust in assessing agreement between two diagnostic methods, resolving the issue of the κ paradox.
Keywords
INTRODUCTION
Myotonic dystrophy (DM) is the most frequent hereditary, multisystemic, neuromuscular disease in adults. Main clinical features are muscular wasting and weakness, myotonia, cataracts, and cardiac conduction defects [1, 2]. Two DM forms are genetically and clinically distinguishable: myotonic dystrophy type 1 (DM1) and myotonic dystrophy type 2 (DM2). In general, DM2 has a later onset of symptoms and a milder phenotype [3, 4]. DM1 shows a restrictive pattern of pulmonary dysfunction at an early stage of the disease, due to respiratory muscle weakness [5, 6]. In addition, breathing irregularities [7], sleep disturbances [8, 9], and central respiratory dysregulation [10] affect ventilation in DM patients. This leads to chronic respiratory insufficiency and premature death [11].
Forced vital capacity (FVC) and forced expiratory volume in the first second (FEV1) are frequently used for screening respiratory insufficiency in DM patients, measured with spirometry in upright position. Some authors recommend additional measurements in supine position. A drop of more than 20%between FVC-upright and FVC-supine is considered an indicator of symptomatic diaphragmatic weakness [12]. The American Thoracic Society (ATS) and the European Respiratory society (ERS) recommend the use of the reference range (RR) in assessing normal values of lung volumes and capacities. The RR includes an interval of predicted reference values of a certain variable (e.g. FVC), ranging from the lower limit of normal (LLN) to the upper limit of normal (ULN) [6].
Reduction in the maximal respiratory pressures (MRPs): maximal inspiratory pressure (MIP) and maximal expiratory pressure (MEP), measured with manometry, indicates respiratory muscle weakness [13–15]. Some authors recommend different cut-off values for abnormal findings of these tests. These cut-off values do not reflect any variability on individual level. Instead, Evans and Whitelaw provide calculations for reference values, using the LLN for MIP and MEP [13, 16].
In 2014, a group of experts organised the 207th European Neuromuscular Centre (ENMC) workshop. Their aim was to combine and summarise the current understandings of chronic respiratory insufficiency in DM [3]. The authors developed a new respiratory involvement symptom (RIS) checklist and recommended pulmonary function tests in screening for respiratory insufficiency. They also summarised cut-off values for abnormal findings of FVC, FEV1, MIP, and MEP in myotonic dystrophies, as reported in the literature.
The aim of this study was to analyse the agreement between the cut-off values suggested at the workshop (ENMC) and the LLN values of the RR in assessment of pulmonary function tests in DM patients. This would infer whether the ENMC cut-off values are of use in the clinical practice, as compared to the RR and the LLN, a standard in practice.
PATIENTS AND METHODS
This cross-sectional study was approved by the Ethics Committee of Ludwig-Maximilians-University of Munich (no. 617-15). All patients gave written informed consent prior to study inclusion.
Patients
We prospectively recruited consecutive patients in the outpatient clinic at the Friedrich-Baur-Institute, in the period from September 2015 to April 2016. We included patients with genetically confirmed diagnosis of DM1 or DM2 [17]. Tracheotomy was an exclusion criterion. After taking history, neurologists examined all the DM patients. Prior to the measurements, all patients filled in the RIS checklist [3]. The RIS checklist consists of 27 questions, divided in nine domains of symptoms: orthopnoea, dyspnoea when performing activities of daily living, poor sleep, morning headaches, apnoea, decreased cognitive performance, excessive daytime sleepiness, fatigue, and treated chest infections since last visit. The examiners were blinded to the checklist results.
Measurements
We measured FVC and FEV1 in upright and supine position, using the KoKo PFT System © 2010 nSpire Health Inc. spirometer. The predicted reference values for FVC, FEV1, and FEV1/FVC ratio, including the RR and the LLN, were calculated according to the ATS/ERS recommendations [6]. In brief, we performed at least three measurements for each patient, with calibration and validation, choosing the best performance in each patient.
MIP and MEP were measured in upright position, using the microRPM CareFusion digital manometer. The predicted mean reference values and the LLN for MIP and MEP were calculated according to the recommendations by Evans and Whitelaw. These are in concordance with the ATS and ERS statement on respiratory muscle testing [13, 16]. The LLN for MIP and MEP were based on the fifth percentile values. To improve lip seal, we used a flanged mouthpiece. The supplementary Table 1 presents all the formulas used for predicted FVC, FEV1, FEV1/FVC ratio, MIP, and MEP.
Statistical analysis
We used a t-test, Wilcoxon-rank-sum-test, Fisher’s exact test or chi-square test for comparing the DM1 to the DM2 sample, according to the data characteristics. All tests were two-sided, at a significance level α= 0.05. For comparing the agreement between the RR and ENMC cut-off values, we used Cohen’s kappa (κ) statistic and Bangdiwala (B) statistic [18, 19]. Cut-off values for the RR assessment were the LLN. The ENMC cut-off values, as summarised and reported at the workshop, were: 1) for FVC - any of the following: 50% of predicted values in upright, or supine drop of 20%, or supine drop of 500 ml; 2) for FEV1: 80% of predicted values; 3) for MIP: 60 cmH2O; and 4) for MEP: 40 cmH2O. For each test, we considered the result as abnormal if the measured value was below these cut-off values.
For comparing the performance of the RR and ENMC cut-off values in detecting symptoms of respiratory involvement, we calculated the sensitivity (Sn) and specificity (Sp) for each test. Only for this purpose, we categorised the patients as having respiratory symptom involvement if they have answered affirmatively to any of the questions of the RIS checklist under “orthopnoea”, “dyspnoea”, or “excessive daytime sleepiness”. Furthermore, we calculated the positive (LR+) and negative (LR–) likelihood ratios. We used the statistical software R for data analysis, version 3.2.2 [20].
Sensitivity analyses of the study
We stratified the κ, B, Sn and Sp analyses in DM1 and DM2. We calculated the odds ratios (OR) for having an abnormal pulmonary function test finding in the entire DM sample, with gender and age as exposure; we stratified this analysis for DM1 and DM2.
In order to counteract a wrong selection of symptoms, we changed the conditions that define respiratory insufficiency. We analysed Sn and Sp in detecting each symptom separately and in different combinations of respiratory symptoms (detailed in results).
RESULTS
Descriptive statistics
All patients are Caucasian. We included 55 DM1 patients (31 male - 56.36%) and 17 DM2 patients (3 male - 17.65%) –details shown in Table 1. The mean age of the entire study population was 47.79 years (SD: 14.57), five patients were older than 70 years. DM1 patients had equal distribution of the muscular-impairment rating score (MIRS): 27.27%had MIRS two, 36.36%MIRS three, 32.73%had MIRS four, and 3.64%of the patients had MIRS five. In total, 15 patients (all DM1, 8 women) were on non-invasive ventilation.
The proportion of patients with abnormal findings of the four tests, based on both the RR and ENMC cut-off values, is shown in Fig. 1. In the case of ENMC-based abnormal FVC, 2 patients (both DM1) had 50%of predicted values in upright position, 4 patients (all DM1) had a supine drop of 20%, and 9 patients (8 DM1) had a supine drop of 500 ml.
Descriptive statistics of the DM1 and DM2 sample
Abbreviations: BMI –body mass index, FEV1/FVC –ratio of FEV1 to FVC. †The values of MIP and MEP are expressed in cmH2O. FVC and FEV1 are expressed in litres. *p-values obtained using Wilcoxon, Fisher’s exact, chi-square or t test. **The results are statistically significant.
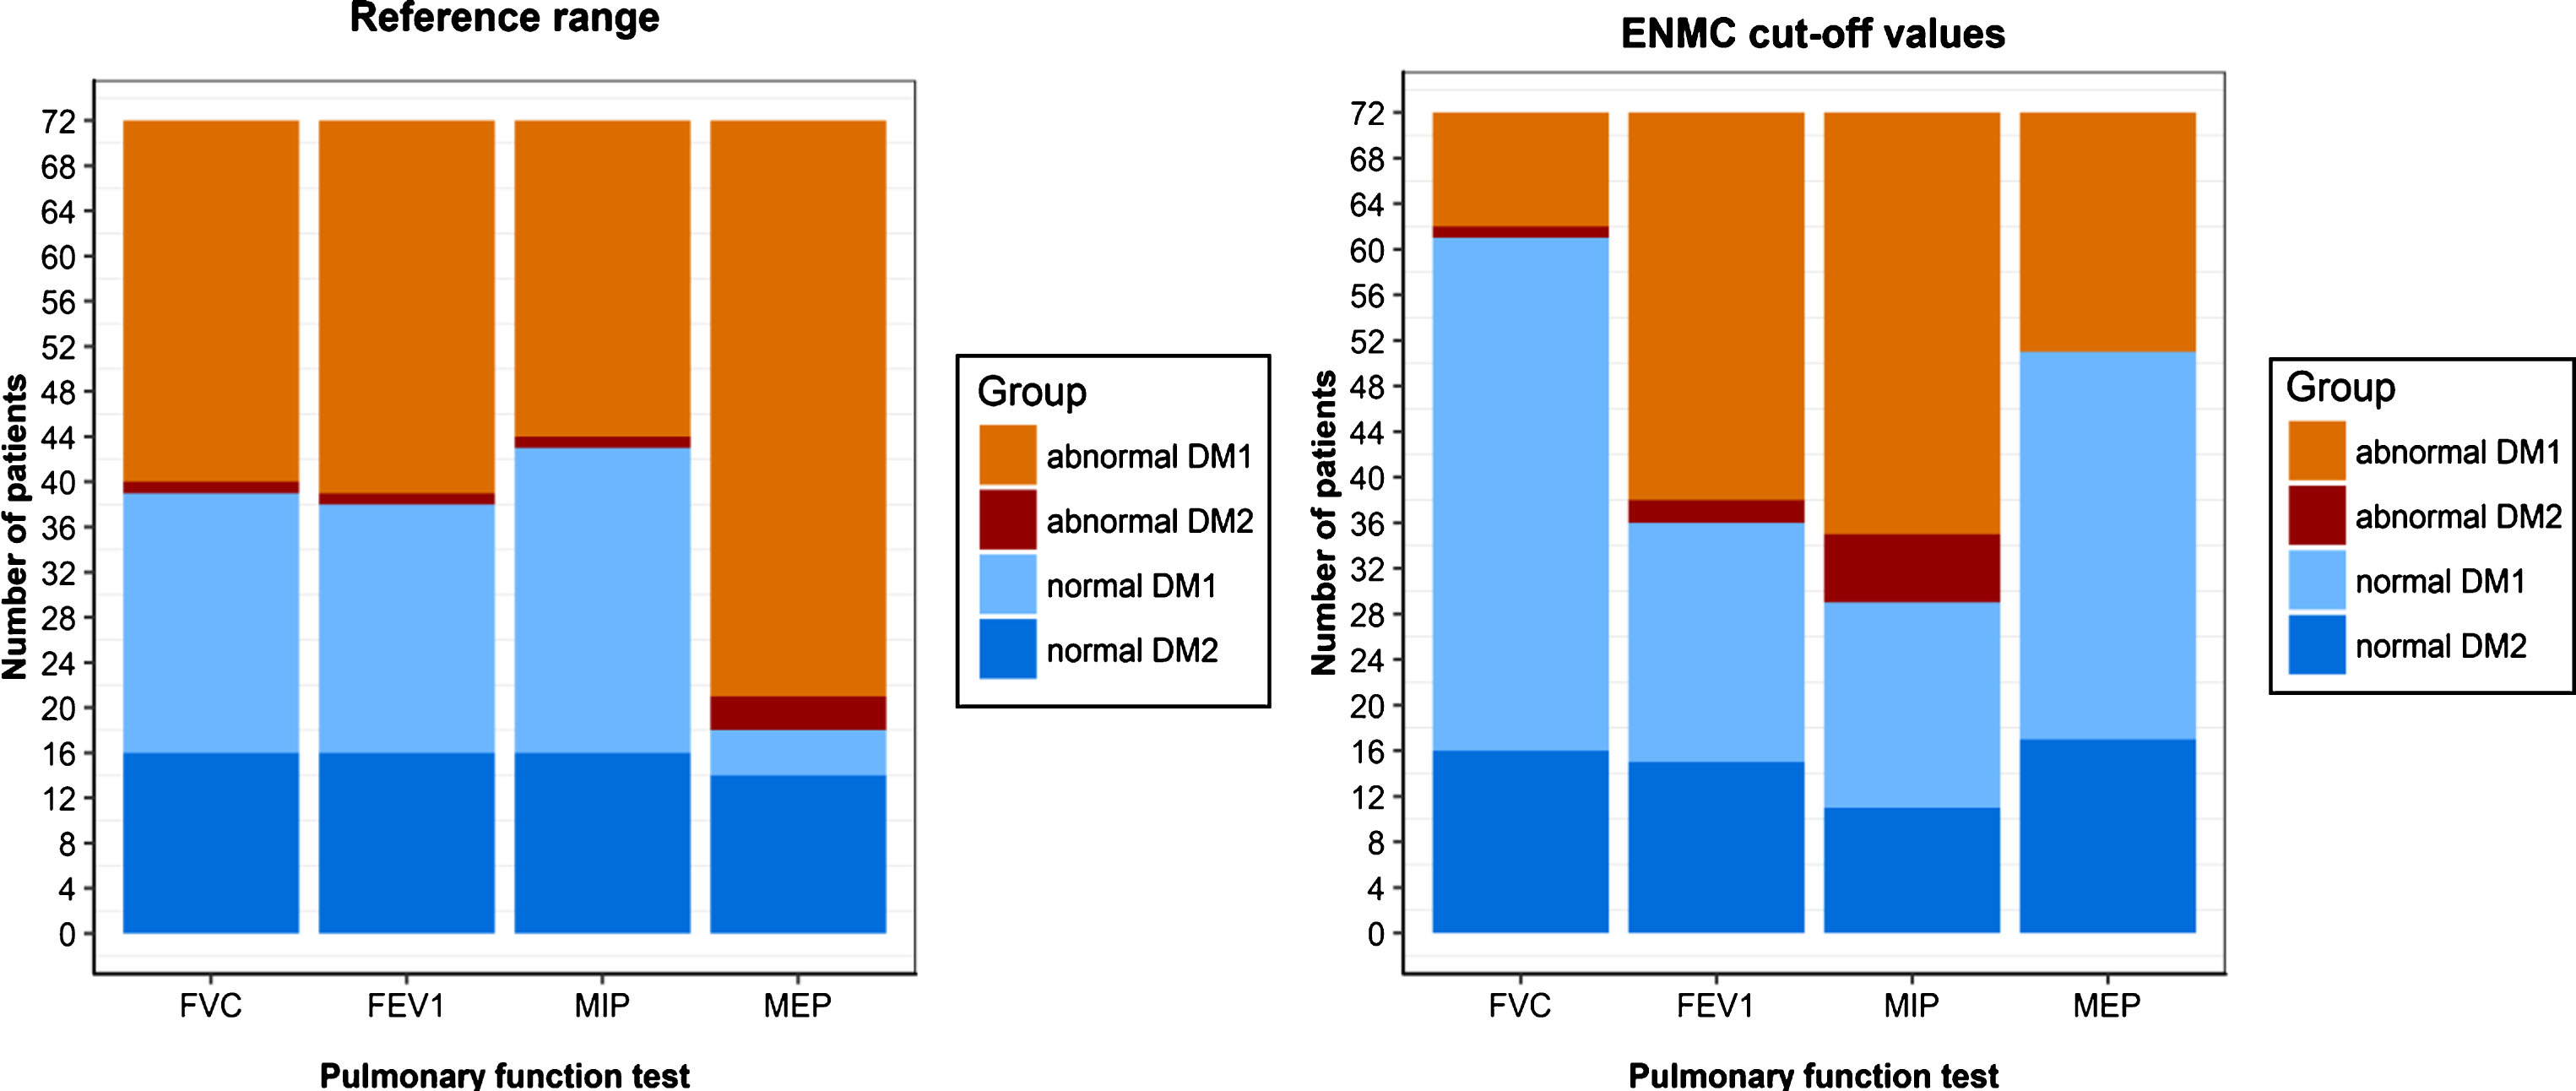
Proportion of abnormal findings in DM1 and DM2 patients.
Figure 2 depicts the prevalence of respiratory symptoms. Only one DM2 patient reported no symptoms. The prevalence of having at least one of the three respiratory symptoms–dyspnoea, orthopnoea or daytime sleepiness–was 72.73%(95%CI: 60.96–84.50%) for DM1 and 35.29%(95%CI: 12.58–58.01%) for DM2 patients.
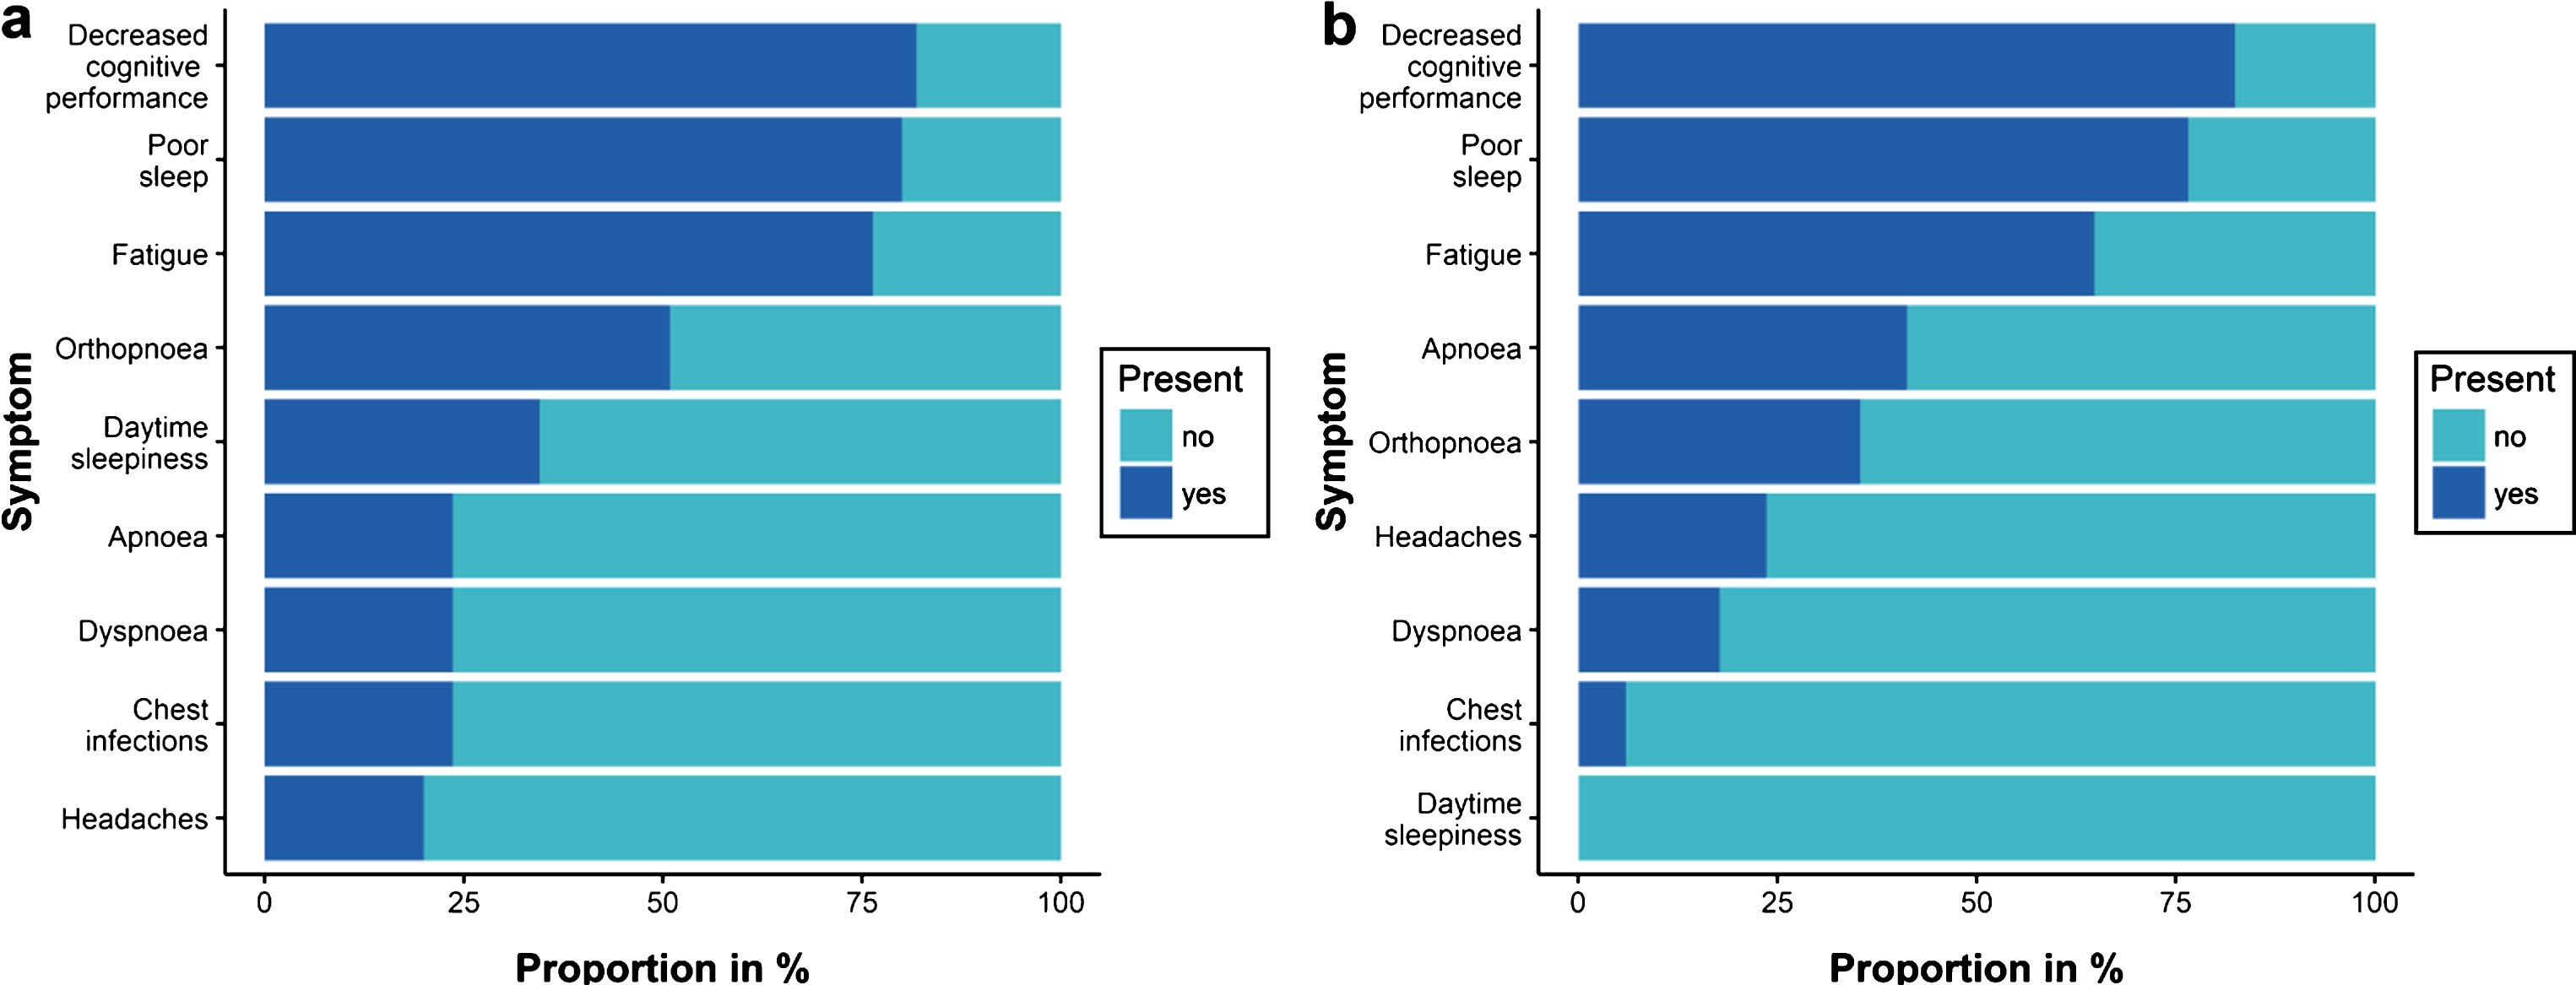
Prevalence of symptoms in: a. DM1 patients; b. DM2 patients.
Inter-method agreement
Inter-method agreement between the RR and ENMC cut-off values was: 1) for FVC: κ= –0.002 (95%CI: –0.181, 0.176), B = 0.406; 2) for FEV1: κ= 0.944 (95%CI: 0.867, 1.00), B = 0.946; 3) for MIP: κ= 0.625 (95%CI: 0.459, 0.791), B = 0.674; and 4) for MEP: κ= 0.241 (95%CI: 0.115, 0.368), B = 0.373. Bangdiwala’s agreement charts, visualising inter-method agreement, are shown in Fig. 3.
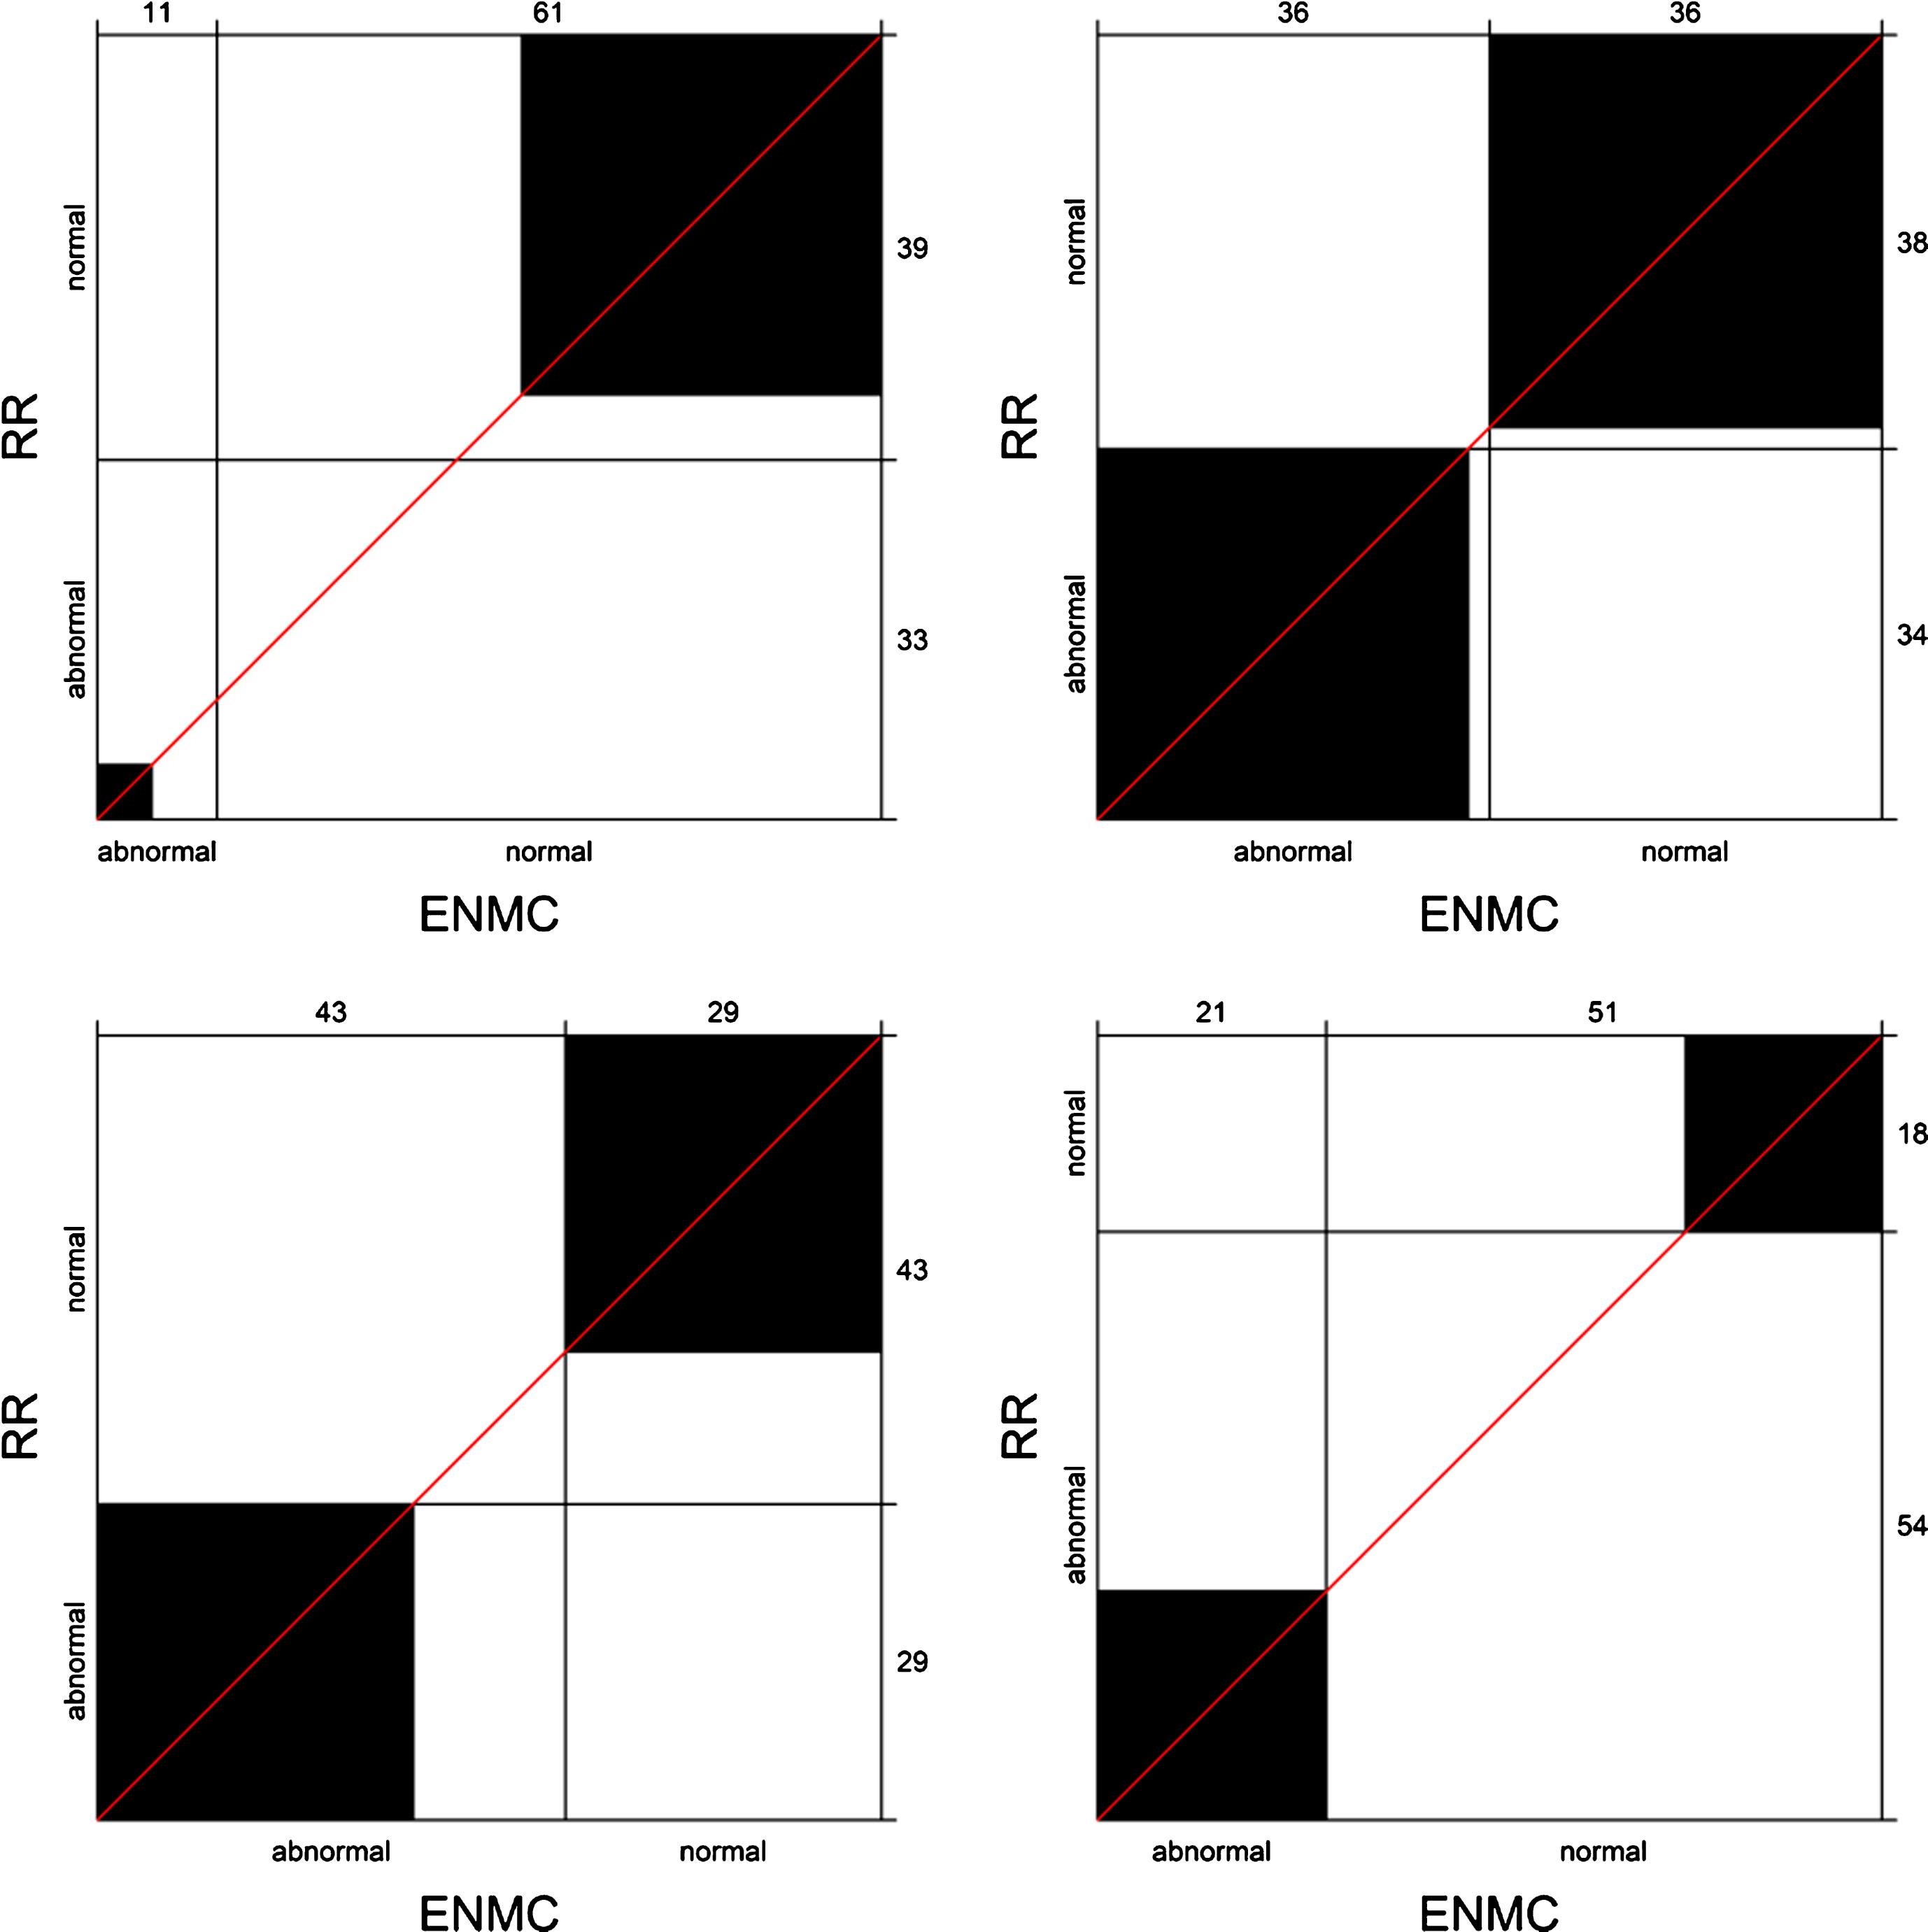
Bangdiwala’s agreement charts for inter-method agreement between the RR and ENMC cut-off values. The agreement charts show fair agreement between the cut-off values for FVC, with low agreement in detecting abnormal findings (upper left). The two methods show almost perfect agreement in differentiating abnormal from normal findings of FEV1 (upper right). We detected a substantial agreement between the RR and ENMC cut-off values for MIP (lower left). The agreement chart for RR and ENMC cut-off values in differentiating findings of MEP shows fair agreement (lower right). Note on how to interpret Bangdiwala’s agreement charts: the size of the black squares represents the level of agreement between the two methods of assessment–the larger the square the larger the agreement on classifying normal or abnormal findings. Furthermore, the larger the triangle formed by the diagonal line and the lines inside the chart, the greater the disagreement between the two methods.
Sensitivity and specificity of the RR and ENMC cut-off values in detecting symptoms of respiratory involvement, with the LR+ and LR–, are given in Table 2. The RR cut-off values had higher sensitivity for FVC and MEP, compared to the ENMC values.
Sensitivity and specificity of RR and ENMC cut-off values for abnormal values of FVC, FEV1, MIP, and MEP, in detecting symptoms associated with respiratory insufficiency (dyspnoea, orthopnoea, and daytime sleepiness)
***With 95% confidence, these values of sensitivity are higher when using the RR compared to the ENMC cut-off values.
**These estimates are statistically significant.
Sensitivity analyses of the study
Stratifying the DM patients in DM1 and DM2 sample did not alter the findings of the main analyses (see supplementary Tables 2). Changing the conditions in defining respiratory symptom involvement, using different combinations of symptoms, also did not provide meaningful alteration of findings (see supplementary Tables 3). The observation that RR cut-off values for FVC and MEP have higher sensitivity compared to the ENMC values remained constant after changing the definition of respiratory symptom involvement as having: 1. only orthopnoea; 2. orthopnoea and dyspnoea; 3. only daytime sleepiness; 4. daytime sleepiness and decreased cognitive performance; 5. daytime sleepiness and dyspnoea; 6. daytime sleepiness and fatigue; 7. only decreased cognitive performance; 8. decreased cognitive performance and headaches; 9. dyspnoea and chest infections; 10. fatigue; 11. poor sleep; 12. poor sleep and apnoea. In addition, the RR cut-off values were more sensitive for MEP in all the conditions tested (the previous twelve and additionally for: only chest infections, only headaches, only dyspnoea, and only apnoea). Overall, the analyses showed a trend of higher sensitivity of RR cut-off values and higher specificity of ENMC values for FVC and MEP, in detecting symptoms of respiratory involvement.
We detected a gender effect in the overall DM sample. Based on the RR and LLN, men had higher odds for having abnormal values of: FVC (OR: 4.5, 95%CI: 1.67–12.15), MIP (OR: 3.55, 95%CI: 2.14, 5.88), and MEP (OR: 4.38, 95%CI: 2.35–8.16), compared to women.
DISCUSSION
Inter-method agreement
The κ- and B- statistic show discrepant results in the analysis. We have faced a κ paradox in assessing agreement for FVC, with disproportionate agreement on normal and abnormal findings (see Fig. 3). Therefore, we base our interpretation on the B-statistic. The B-statistic is more robust to different versions of marginal distributions in the contingency tables and gives more reliable results [21].
We have observed an almost perfect agreement between the ENMC values and RR values in categorising patients for having normal/abnormal FEV1 result. This is expected, considering that the cut-off value of 80%of predicted FEV1 lies in vicinity of the LLN. The two methods also show substantial agreement in categorising patients for abnormal findings of MIP. Using both methods for FEV1 and MIP assessment in practice seems reliable. Still, the RR considers the variability present in the population.
FVC showed fair inter-method agreement, with low agreement in detecting abnormal findings. The disagreement between the two methods is attributable to the higher thresholds of the ENMC cut-off values for abnormal values. Supine drop has been detected in patients with severe progression of the disease, whereas 50%of predicted FVC is a threshold for initiating non-invasive ventilation [3]. We have observed this in our sample - very few patients had values below the ENMC cut-off values and almost all of them were DM1 patients. This suggests that ENMC cut-off values are more specific and might be more indicative of a more severe respiratory insufficiency. The sensitivity analyses of this study show the same trend of higher Sn of RR values and higher Sp of ENMC values in detecting different respiratory symptoms. Although such tradeoffs between sensitivity and specificity are expected, sensitivity is of greater importance in screening purposes. Thus, the RR would be a better method for assessment of FVC in early screening for respiratory insufficiency, detecting patients who are mildly affected, whereas ENMC values would detect patients who have a progressed disease.
RR-based MEP might be a better indicator of disease severity than respiratory insufficiency
The two methods showed lowest agreement in categorising patients for abnormal MEP findings. Based on the RR, MEP was the test with the highest proportion of abnormal findings, showing a ceiling effect in Sn. It suggests a more severe and/or earlier expiratory impairment in DM patients, with regard to inspiratory impairment. Fregonezi et al. (2015) report such observations, with lower MEP/MIP ratio in 25 DM patients compared to healthy controls [22]. They refer to the findings of Veale et al. (1995) where MEP values were lower than MIP values in a small sample of seven DM patients. As the disease progresses, expiratory muscles might be more affected by weakness, resulting in reduced coughing ability and frequent lung infections [23]. Fregonezi et al. (2015) further hypothesise that severe expiratory impairment might be attributable to the weakness of the abdominal muscles. Considering the high proportion of RR-based abnormal findings of MEP, we should further investigate whether MEP might be an early indicator for muscle weakness and disease progression. A recent review discusses MRPs as potentially sensitive measures of respiratory muscle impairment and disease progression [24].
Sensitivity analyses of the study
In the main analysis, we defined a surrogate outcome for respiratory insufficiency with a triad of symptoms that according to literature are indicative of respiratory insufficiency (having dyspnoea and/or orthopnoea and/or daytime sleepiness). If the two methods of assessment have the same power to differentiate normal from abnormal findings of spirometry and manometry, then both RR and ENMC cut-off values for the four tests would have the same Sn and Sp in detecting this triad of symptoms. One could argue that such a selection of symptoms might not be correct or that some of the RIS symptoms are overlapping with DM symptoms. However, in theory, if the two methods of assessment (RR and ENMC) have high agreement in differentiating normal from abnormal findings, they would have similar Sn and Sp in detecting any of the symptoms. To prove this assumption, we have performed sensitivity analyses to test whether the Sn and Sp of RR and ENMC cut-off values would differ if we change the definition of respiratory symptom involvement using any of the symptoms separately, as well as with a different combination of symptoms. We can infer from the results from the sensitivity analyses the same notion of disagreement between RR and ENMC in the assessment of FVC and MEP, with a trend of higher sensitivity of the RR cut-off values and higher specificity of the ENMC cut-off values (see supplementary Tables 3). This confirms that the results of the main analysis on Sn and Sp are reliable.
Strengths and limitations
A major limitation of this study is the small sample size [25]. DM is a rare disease and to the best to our knowledge this is the largest and only sample of DM patients that addresses this question. Furthermore, to best to our knowledge, this is the first study to validate RR regression equations for MIP and MEP.
Although most of the patients with respiratory insufficiency are symptomatic, some are asymptomatic in the early stage of the disease. Using symptoms as a surrogate outcome for respiratory insufficiency, for the purpose of this analysis, might have underestimated the screening sensitivity of the tests in practice. Still, this does not bias the main analysis on inter-method agreement. Furthermore, the two methods, if reliable, should equally discriminate symptomatic from asymptomatic patients who have respiratory insufficiency. In addition, those who have symptoms of respiratory involvement are more likely to have developed respiratory insufficiency. This should not have affected the finding that RR cut-off values are of higher sensitivity and that ENMC cut-off values are of higher specificity in detecting symptomatic patients with respiratory insufficiency.
Other minor limitations are the measurement errors, which always appear in spirometry and manometry. In the case of MEP and MIP, weakness of buccal muscles might have affected the lip seal. To counteract it, we used a flanged mouthpiece. All regression equations for calculating the predicted values are based on measurements in normal individuals aged 18 to 70 years; we used them in five patients aged above 70, due to lack of equations for the elderly.
CONCLUSION AND RECOMMENDATIONS
We recommend the use of the RR and the LLN for differentiating normal values of FVC, when screening DM patients for respiratory insufficiency. RR-based FVC was the only test that showed diagnostic accuracy, with higher sensitivity in detecting respiratory symptoms, compared to the ENMC cut-off values. For assessment of FEV1, the two methods show almost-perfect agreement. However, the RR should be favoured, because it takes variability within the population into account. Furthermore, it corresponds with the guidelines of the ATS and ERS and it is an established method in practice.
There is a substantial agreement between the two methods in assessment of MIP findings. However, due to low inter-method agreement and a ceiling effect in detecting respiratory symptoms using the RR-approach in the case of MEP, we could not infer conclusions from the findings and give recommendations. It is plausible that muscular weakness of the expiratory muscles might appear sooner than in inspiratory muscles, in DM patients. Still, additional development and validation of regression equations for predicting normal values of maximal respiratory pressures, with corresponding LLN as cut-off values, is required.
Overall, ENMC cut-off values seem more specific, meaning that using them would perhaps detect patients in whom respiratory insufficiency has already progressed. As a rule of thumb, clinicians can use the ENMC cut-off values for FEV1 (80%of predicted values), and for MIP (60 cmH2O).
Finally, through this example we demonstrate that the Bangdiwala’s B statistic is a more robust and visually more informative statistical method for assessing agreement between two diagnostic methods, compared to the kappa statistic. We recommend its use in clinical studies on inter-rater and inter-method agreement.
ETHICAL PUBLICATION STATEMENT
We confirm that we have read the Journal’s position on issues involved in ethical publication and affirm that this report is consistent with those guidelines.
CONFLICT OF INTEREST
None of the authors has any conflict of interest to disclose.