
Abstract
Background:
Weakness can be operationalized with several thresholds, which in turn, could impact associations with cognitive impairment when considering obesity status.
Objective:
We examined the associations of absolute, normalized, and collective weakness thresholds on future cognitive impairment by obesity status in older adults.
Methods:
We performed a secondary data analysis on the 2006–2018 waves of the Health and Retirement Study. A spring-type dynamometer collected handgrip strength (HGS). Males were categorized weak if their HGS was <35.5-kg (absolute), <0.45-kg/kg (body mass normalized), or <1.05-kg/kg/m2 (body mass index (BMI) normalized), while females were defined as weak if their HGS was <20.0-kg, <0.337-kg/kg, or <0.79-kg/kg/m2. The modified Telephone Interview of Cognitive Status examined cognitive function. Persons scoring ≤10 had a cognitive impairment. Obesity was categorized as BMI ≥30 kg/m2.
Results:
We included 7,532 and 3,584 persons aged ≥65-years living without and with obesity, respectively. Those without obesity but beneath the absolute weakness threshold had 1.54 (95% confidence interval (CI): 1.24–1.91) greater odds for future cognitive impairment. Persons with obesity and beneath each threshold also had greater odds for future cognitive impairment: 1.89 (95% CI: 1.28–2.78) for absolute, 2.17 (95% CI: 1.02–4.62) for body mass normalized, and 1.75 (95% CI: 1.10–2.80) for BMI normalized. Older Americans without obesity but underneath all the weakness thresholds had 1.32 (95% CI: 1.00–1.74) greater odds for impairment in cognitive function, while persons with obesity had 2.76 (95% CI: 1.29–5.93) greater odds.
Conclusions:
There should be consideration for how body size and different weakness thresholds may influence future cognitive outcomes.
Keywords
INTRODUCTION
Approximately 67% of Americans will experience some level of cognitive impairment [1], and Alzheimer’s disease (AD) is present in an estimated 6.7 million older Americans [2]. The number of older Americans living with a cognitive impairment is projected to increase, and AD/Alzheimer’s disease related dementias (AD/ADRD) is a leading cause of death [2]. Although many risk factors exist for AD/ADRD including an elevated risk at age ≥65-years that potentiates at ≥75-years [3], obesity and muscle-related conditions are associated with cognitive impairment [4, 5]. Therefore, body mass index (BMI) and handgrip strength (HGS) have been discussed as viable screening factors to help identify risk for future cognitive impairment, and for targeted interventions to mitigate such risk.
Although several thresholds exist for determining weakness from HGS, the Sarcopenia Definitions and Outcomes Consortium (SDOC) created absolute and normalized thresholds for weakness [6, 7]. Indeed, normalized cut-points help to provide a stand-alone adjustment of body size for strength capacity, thereby providing precision in measurement, but the quotients derived from these adjustments should be closely observed. For example, concerns for how to interpret longitudinal changes in normalized HGS measures may exist because it is unclear if body size or strength capacity (or both) are driving changes [8]. Therefore, understanding how absolute and body size normalized weakness thresholds linked to cognitive functioning by obesity status present guidance for determining how body size might influence such associations.
While the SDOC has generated weakness classifications from absolute and normalized HGS, opportunities to utilize these classifications together may also exist to better operationalize weakness for prognosis of deteriorating health. For example, previous studies have shown that the odds of future falls and cognitive impairment elevate when persons are beneath absolute and body size normalized weakness thresholds [9, 10], and the proportions of individuals below these weakness thresholds are not equivalent [11]. Given that the SDOC cut-points are emerging as a rigorous method for defining low strength capacity, examining the role of obesity with respect to these thresholds may provide additional guidance into how weakness is associated with cognitive impairment. Following framework from a previous investigation on this topic [9], the purpose of this study was to determine the associations of individual absolute and body size normalized weakness thresholds on cognitive impairment by obesity status in older Americans. We also utilized these individual weakness thresholds collectively in older Americans to determine future cognitive impairment by obesity status.
MATERIALS AND METHODS
Dataset
The 2006–2018 waves of the RAND Health and Retirement Study were analyzed for this investigation. We extracted data from 11,242 participants that were at least 65 years of age with information for ≥1 wave of HGS, and at least another wave of cognitive function assessment. The HRS observes age-related health factors in Americans using a longitudinal-panel design [12]. Participants from the HRS often complete measures every other year until death, and refreshment samples help the HRS maintain a national sample [13]. Interview response rates for the HRS have repeatedly been >80% [14]. Additional information regarding the HRS is published elsewhere [15].
The HRS started performing detailed face-to-face interviews with physical function measures such as HGS beginning in the 2006 wave [13]. These thorough interviews occurred on a random sub-sample of half the HRS participants, with these interviews occurring every other wave, while the other half sample of participants only completed the routine interviews to support study execution. Written informed consent was given by HRS participants and study procedures were approved by the University of Michigan Health Sciences/Behavioral Sciences Institutional Review Board.
Measurements
Cognitive assessment
A modified form of the validated Telephone Interview of Cognitive Status was utilized to assess cognitive function [16]. The modified Telephone Interview of Cognitive Status, which is a cognitive screener modeled from the Mini-Mental State Examination, has the ability to abate ceiling and floor effects [17, 18]. We utilized a composite scale wherein scores ranged from 0–35 points, with greater scores suggesting higher cognitive functioning. Evaluations from the modified Telephone Interview of Cognitive Status included immediate and delayed word recall, serial sevens subtraction beginning at the number 100, counting backward as quickly as possible starting from the number 20, object and date naming, and correctly reporting the president and vice president of the United States. Participants scoring ≤10 were categorized as having a cognitive impairment [19].
Handgrip strength
Participants eligible for HGS testing did not report having surgery, swelling, harsh pain, or an injury to either hand in the 6-months prior to the interview, and if such symptoms were present in a single hand, then only the other hand was used [20]. The HRS uses a Smedley spring-type hand dynamometer (Scandidact; Odder, Denmark) for measuring HGS [20]. Protocols for measuring HGS in the HRS first begin with fitting the dynamometer to the participant’s hand, and then allowing for a practice trial for familiarity on the reported dominant hand while standing with their arm positioned at a 90° angle on the side [20]. All participants are advised to squeeze the dynamometer as hard as possible for a couple seconds, and then release [20]. The handgrip dynamometer is then placed in the non-dominant hand, and HGS values are recorded twice on each hand, alternating hands [20]. If HGS testing was only conducted on a single hand, then a 30-s rest period was elapsed between measurements [20]. Protocol alternatives were allowed for participants unable to stand or grasp the dynamometer, such that persons could be seated and place their arm on a supporting object [20].
The highest HGS documented despite hand of origin was included in the analyses. Males and females were classified as having weakness if their absolute HGS was below 35.5-kg and 20.0-kg, respectively [6, 11]. Adjustments for HGS to body mass helped to further classify weakness, such that males < 0.45 kg/kg and females < 0.337 kg/kg were weak [6, 11]. Likewise, normalization for HGS to BMI categorized weakness for males at <1.05 kg/kg/m2 and females at <0.79 kg/kg/m2 [6, 11]. To unite these absolute and body size normalized weakness thresholds (i.e., collective weakness), we also categorized participants as being underneath 1, 2, or all 3 thresholds. HGS measurements are frequently used to operationalize weakness [21, 22].
Covariates
Participants self-reported their age, sex, race, educational attainment, height, and body mass. Participants with a BMI≥30 kg/m2 were classified as obese [23]. Each participant likewise indicated if they were current or previous cigarette smokers. Persons with multimorbidity reported an affirmative healthcare provider diagnosis for 2 or more of the following conditions: high blood pressure, diabetes, cancer (excluding minor skin cancer), chronic lung disease (e.g., emphysema), stroke, heart condition (e.g., coronary heart disease, myocardial infarction, angina, congestive heart failure), emotional or psychiatric problems, and arthritis or rheumatism. Perceived health was self-rated by participants from 5 categories: excellent, very good, good, fair, and poor.
Depressive symptoms were measured with the 8-item Center for the Epidemiologic Studies Depression scale [24]. Respondents revealed if they felt positive or negative emotions the week before completing scale. Scores ranged from 0–8, with greater scores indicating depressive symptomology was higher. We classified participants as engaging in moderate-to-vigorous physical activity (MVPA) if they reported such physical activity participation for at least a single occasion during the week [25]. Multiple items were used to ascertain social participation: 1) spent time doing volunteer work in the past 12 months for religions, educational, health-related, or other charitable organizations, 2) weekly communications with parents, in-laws, or partners, and 3) current employment status. Scores ranged from 0–3 with greater scores suggesting more engagement in social activities [26]. Participants reported on their ability to use a toilet, dress (including putting on shoes and socks), eat (such as cutting-up food), get in-and-out of bed, bathe or shower, and walk across a room. Those indicating difficulty or incapability in completing an activity of daily living (ADL) were classified as having an ADL limitation. Individuals that had missingness for covariates were not included (n = 126).
Statistical approach
SAS 9.4 software (SAS Institute; Cary, NC) was used to execute the analyses. Details about the data structuring and measures collected during the longitudinal study period are available elsewhere [9]. Baseline descriptive characteristics of the participants were shown as mean±standard deviation and frequency (proportion) for categorized variables by obesity status. Means and 95% confidence intervals (CI) were similarly generated for the baseline demographic participant characteristics by obesity presence to make comparisons between groups.
A generalized estimating equation (GEE) quantified the association between persons categorized as weak with the absolute threshold (reference: not below absolute weakness threshold) and future cognitive impairment. Another GEE analyzed the association between participants classified as weak with the BMI normalized weakness thresholds (reference: not below the BMI normalized weakness threshold) and future cognitive impairment. Moreover, a GEE determined the association between older Americans classified as weak with the body mass normalized weakness thresholds (reference: not below the body mass normalized weakness threshold) and future cognitive impairment. To evaluate the role of the collective weakness classifications, a GEE examined the association between participants underneath 1, 2, or all 3 weakness thresholds (reference: below 0 weakness thresholds) on future cognitive impairment.
The GEEs were adjusted for cognitive impairment at current wave, follow-up time, sex, race, multimorbidity, age, cigarette smoking status, social activities, perceived health, depressive symptoms, MVPA, ADLs, and educational attainment. Covariates were examined at the current wave. Each GEE controlled for repetitive measures and the outcome for the next wave participated was used. An α-level of 0.05 was utilized.
RESULTS
Table 1 shows the baseline participant descriptive characteristics by obesity presence. Of the included 11,116 participants at baseline, 3,584 (32.2%) were living with obesity. Persons with obesity were also aged 70.7±5.4 years, while persons without obesity were aged 73.1±6.8 years. Supplementary Table 1 reveals the means and 95% CIs for the baseline participant descriptive characteristics by obesity status. Figure 1 depicts the number of participants beneath the weakness thresholds by obesity status. There were differences in the number of participants classified as weak relative to the threshold utilized.
Baseline descriptive characteristics of the participants by obesity status
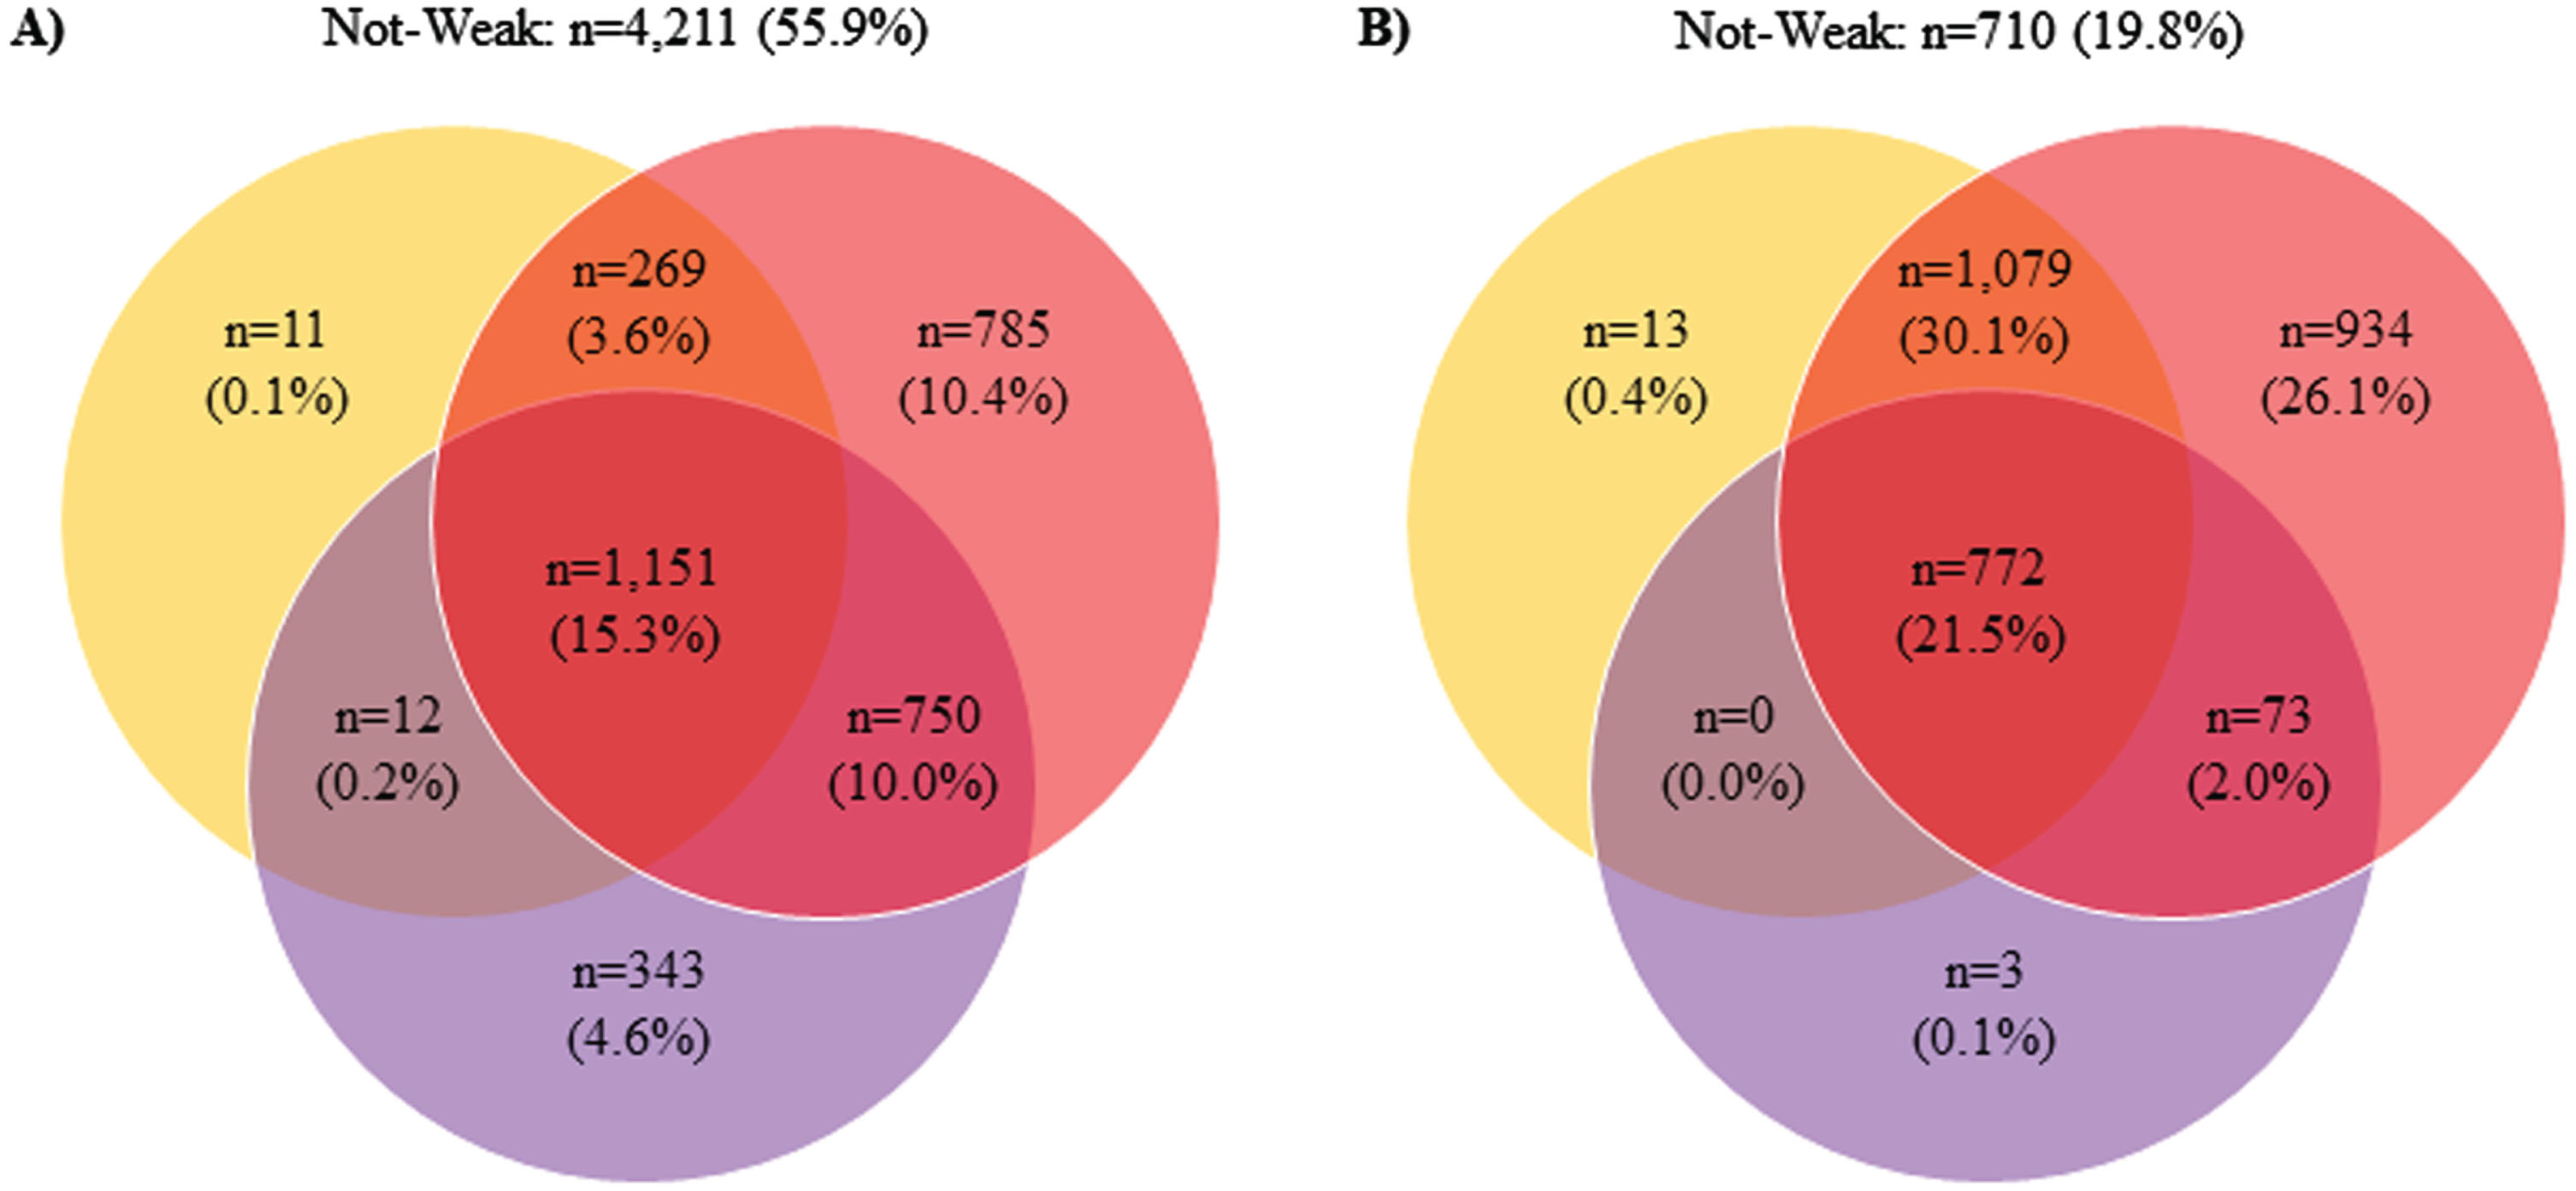
Proportions of Participants Beneath the Weakness Thresholds. A) without obesity; B) with obesity; orange = body mass index normalized weakness; purple = absolute weakness; red = body mass normalized weakness.
Table 2 displays the results for the associations of the individual weakness thresholds on future cognitive impairment by obesity status. For persons living without obesity, only those beneath the absolute weakness threshold had 1.54 (95% CI: 1.24–1.91) greater odds for future cognitive impairment, but there were no observed significant associations for those under the BMI normalized weakness (odds ratio (OR): 1.06; 95% CI: 0.83–1.34) and body mass normalized thresholds (OR: 1.07; 95% CI: 0.86–1.32) regarding those living without obesity. However, participants with obesity that were classified as weak with respect to each threshold had greater odds for future cognitive impairment: 1.89 (95% CI: 1.28–2.78) for absolute, 1.75 (95% CI: 1.10–2.80) for BMI normalized, and 2.17 (95% CI: 1.02–4.62) for body mass normalized weakness.
Results for the Associations of the Individual Weakness Thresholds on Future Cognitive Impairment by Obesity Status
†Reference: no absolute weakness; ‡Reference: no body mass index normalized weakness; ¥Reference: no body mass normalized weakness. CI, confidence interval; OR, odds ratio. The models controlled for cognitive impairment at current wave, follow-up years, sex, race, multimorbidity, age, smoking status, social engagement, self-rated health, depressive symptoms, moderate-to-vigorous physical activity participation, basic self-care limitation, and educational attainment.
The results for the associations of persons beneath 1, 2, or all 3 weakness thresholds future cognitive impairment by obesity status are presented in Table 3. Only participants living without obesity but beneath each of the 3-weakness thresholds had 1.32 (95% CI: 1.00–1.74) greater odds for future cognitive impairment. However, we observed no significant associations for those below 1 (OR: 1.17; 95% CI: 0.88–1.55) or 2 (OR: 1.20; 95% CI: 0.89–1.61) thresholds. A similar trend was found for persons with obesity, such that only participants beneath all 3-weakness thresholds had 2.76 (CI: 1.29–5.93) greater odds for future cognitive impairment, but again, we found no significant associations those underneath 1 (OR: 1.20; 95% CI: 0.50–2.90) or 2 thresholds (OR: 1.88; 95% CI: 0.86–4.07).
Results for the associations of the compounding weakness thresholds on future cognitive impairment by obesity status
Reference: 0 weakness categories. CI, confidence interval; OR, odds ratio. The model controlled for cognitive impairment at current wave, follow-up years, sex, race, multimorbidity, age, smoking status, social engagement, self-rated health, depressive symptoms, moderate-to-vigorous physical activity participation, basic self-care limitation, and educational attainment.
DISCUSSION
The primary results of our study in which we performed a secondary analysis of HRS data suggest that older Americans falling below certain weakness thresholds were at risk for future cognitive impairment. Persons living without obesity but had HGS under the absolute weakness threshold had 54% greater odds for future cognitive impairment. Alternatively, older Americans with obesity and beneath weakness thresholds had greater odds for future cognitive impairment: 89% for absolute, 75% for BMI normalized, and 117% for body mass normalized, respectively. While those without obesity had 32% greater odds for future cognitive impairment when categorized as being beneath all 3-weakness thresholds, persons with obesity had 176% greater odds. Our findings indicate that the odds of cognitive impairment elevate when weakness and obesity are present, and that absolute and body size normalized thresholds (BMI and body mass) may yield differential estimates for future cognitive impairment when additionally classified by obesity status.
Although body size and strength capacity are linked, persons with obesity may challenge how strength is normalized to body size [8], which in turn, may influence associations with clinically-relevant health outcomes such as cognitive impairment. Our results indicate that while absolute weakness was linked to future cognitive impairment regardless of obesity status, persons with obesity also had greater odds for future cognitive impairment when beneath the BMI and body mass normalized weakness thresholds. Such findings suggest that obesity status might factor into how strength capacity is normalized for future cognitive impairment risk. When utilizing HGS to screen for future cognitive impairment, there should be acknowledgement for how normalizing HGS by body mass and BMI with respect to obesity status may influence these measures.
Physical activity participation may help in the prevention and treatment of AD/ADRD [27, 28]. While engagement in higher intensity physical activity lowered AD/ADRD risk, leisure activities are also inversely associated with a decreased risk of AD/ADRD. Indeed, physical activity participation is linked to lower AD/ADRD risk, but physical activity likewise helps in mitigating obesity and preserving muscle strength [29], and may have implications for cognitive function earlier in life [30]. Moreover, physical activity combats obesity [31], which in turn, is linked to executive function and dementia [32]. As such, physical activity could be particularly important for the triangulation between strength capacity, obesity status, and cognitive function.
The SDOC weakness cut-points present unique opportunities to incorporate all of these thresholds into a composite weakness measurement [7]. Previous research has indicated that the sensitivity for future cognitive impairment increased when persons are under all SDOC weakness thresholds [9]. False positives and negatives of an assessment for health can pose many problems, and could be explained by several factors. Our investigation showed that although older Americans below all the weakness thresholds had greater odds for future cognitive impairment regardless of obesity status, the odds were especially high for persons with obesity. These findings note that obesity is a factor when considering weakness status for cognitive function, particularly when normalizing HGS by body mass and BMI. Both weakness and obesity status should be considered when examining motor tasks for cognitive function during aging, and how strength capacity and body size may change over time.
Some limitations should be discussed. We performed analyses for weakness and future cognitive impairment by obesity status; however, comparing estimates and CIs between such statuses should be interpreted with the acknowledgement that such estimates are not being directly compared in our GEEs (i.e., reference group). Proxy respondents for participants with severe cognitive impairment may not have had their HGS collected. A low number of cases within our categorical variables challenged our ability to stratify the analyses by sociodemographic characteristics. Other cut-points for categorizing cognitive impairment may exist. Apolipoprotein E4 was not included in the publicly available RAND HRS dataset. More comprehensive cognitive assessments may have strengthened the predictive value of HGS and obesity.
Conclusions
The findings from this investigation indicate that older Americans beneath the weakness threshold for absolute HGS had greater odds for future cognitive impairment regardless of obesity status, but persons with obesity similarly had greater future cognitive impairment odds if they were beneath the BMI and body mass normalized weakness thresholds. Older Americans with obesity were especially at greater odds for future cognitive impairment when underneath all the weakness thresholds. Our findings suggest that weakness and obesity are associated with cognitive impairment, and caution should be noted for how HGS normalization procedures influence such measures and their predictive value. Continuing to examine the role of body size on HGS for health may yield additional insights.
AUTHOR CONTRIBUTIONS
Joshua Batesole (Investigation; Writing – original draft); Grant Tomkinson (Investigation; Writing – review & editing); Kirk Erickson (Investigation; Writing – review & editing); Donald Jurivich (Investigation; Writing – review & editing); Justin Lang (Investigation; Writing – review & editing); Brenda McGrath (Formal analysis; Investigation; Writing – review & editing); Sheria Robinson-Lane (Investigation; Writing – review & editing); Ashleigh Smith (Investigation; Writing – review & editing); Ryan McGrath (Conceptualization; Formal analysis; Investigation; Project administration; Visualization; Writing – original draft).
Footnotes
ACKNOWLEDGMENTS
The authors have no acknowledgements to report.
FUNDING
Research reported in this publication was supported by the National Institute on Aging of the National Institutes of Health under Award Number R15AG072348 (to RM). The content is solely the responsibility of the authors and does not necessarily represent the official view of the National Institutes of Health. AES is funded by a Dementia Australia Research Foundation Mid-Career Fellowship.
CONFLICT OF INTEREST
The authors have no conflict of interest to report.
DATA AVAILABILITY
Health and Retirement Study data are publicly available at their website.