
Abstract
Muscle nicotinic acetylcholine receptor (nAChR) mutations can lead to altered channel kinetics and neuromuscular junction degeneration, a neurodegenerative disorder collectively known as slow-channel syndrome (SCS). A multivariate analysis using running wheels was used to generate activity profiles for a variety of SCS models, uncovering unique locomotor patterns for the different nAChR mutants. Particularly, the αL251T and ɛL269F mutations exhibit decreased event distance, duration, and velocity over a period of 24 hours. Our approach suggests a robust relationship between the pathophysiology of SCS and locomotor activity.
Keywords
INTRODUCTION
The association between ionotropic receptor gating and disease has been historically studied in vitro [3–5]. Nevertheless, animal models have permitted a more thorough understanding and dissection of the pathophysiology of channelopathies [6, 7]. An example of such case is a condition known as slow-channel syndrome (SCS), which has been reported to develop as a result of point mutations in various muscle nicotinic acetylcholine receptor (nAChR) subunits. However, nAChR mutations compose only a fraction of the cases of congenital myasthenic syndromes (CMS). CMS can also develop as a consequence of a variety of loss of function mutations and/or deficiencies of various pre-, post- andintra-synaptic components that facilitate neurotransmission, all contributing to the wide spectrum of disease presentation [5, 8].
The nAChR is a heteropentamer ligand-gated channel composed of alpha (α), beta (β), delta (δ) and epsilon (ɛ) subunits (expressed in 2 : 1:1 : 1 ratios, respectively), that is responsible for acetylcholine gated cation currents at the neuromuscular junction (NMJ) [3]. Point mutations in SCS have been associated with prolonged channel opening, ionic milieu alterations and hindered NMJ neurotransmission due to nAChR slow channel kinetics [1, 9–13]. Such conditions lead to progressive NMJ dysfunction, and thus severe fatigue and muscle weakness are common clinical findings in SCS patients [6]. Electrophysiological, histological, and molecular characterizations of patients and SCS animal models have proposed that NMJ dysfunction leads to calcium accumulation in the synaptic cleft. As a result, this calcium overload leads to degeneration of the muscle endplate and gives rise to the principal component of the disease clinicopathology [6, 14].
Nevertheless, the behavioral profile of SCS models is limited and what has been described does not fully encompass the physiological presentation of SCS. Locomotor activity and its related metrics are often overlooked, ignoring the impact of conditions such as SCS. Hence, we characterized a panel of SCS mice using running wheels to examine whether these nAChR channelopathy models exhibit locomotor impairment and to what extent these alterations correlate with their pathophysiology. Here we present such behavioral characterization, including three mutations that span the acetylcholine binding subunit of the receptor (αV249F, αL251T and αC418W), two mutations in the delta subunit (δS268F and δS262T), and one in the epsilon subunit (ɛL269F), the latter which has been proposed to be a crucial nAChR subunit for divalent cation permeability [17].
MATERIAL AND METHODS
Locomotor activity data was collected from a panel of mice expressing various muscle nAChR mutations, using running wheels. The University of Puerto Rico Institutional Animal Care and Use Committee (IACUC) approved the protocols for these experiments, which include ad libitum access to water and food, in a 12-hour light cycle. Four to six-month-old male animals were randomly selected for analysis. Age was determined based on previous characterization of clinical weakness and noticeable differences in spontaneous exploratory activity at approximately 5 month of age in a subset of these animals [1, 2]. The SCS transgenic animals used in this study were generated and characterized by our group [1, 12]. Transgenic animals used for experiments were bred as heterozygous, in an attempt to control the copies of the mutant copies of nAChR subunits, which varied from 10–50 copies depending on the mutation [2]. In order to detect the presence of the transgene of interest, we performed a polymerase chain reaction (PCR) using primers designed to amplify regions of the each of the subunits of interest (α, δ and ɛ) in combination with the NEO cassette insert found in the transgene to identify the transgenic mice. Agarose gel electrophoresis was used to identify those animals expressing the desired mutations.
The experimental setup and data acquisition software has been previously described and validated by our group [18]. In brief, we utilized mouse single activity wheel chambers (Lafayette Instrument, model 80820) as a home cage, in which the animals remained for the duration of the experiment with free access to water and food. Animals were acclimated to the activity monitoring cages for 7 days with free access to running wheels, before we collected our data. Every 24 hours, food and water levels were verified and replenished as necessary. We monitored and recorded their activity using Lafayette’s Activity Wheel Monitor Software. This allowed us to record the average velocity (m/s) and duration (s) of activity events throughout a period of 24 hours, at a frequency of 1 data point per second. The data gathered from the monitoring software was sorted, mined and exported using a custom MATLAB code (see supplemental material for pseudocode), that was modified from our group’s previous work [18]. Subsequently, we organized all data points using their timestamp and their duration (seconds) and average velocity (m/min), calling an activity event when we detected consecutive non-zero velocities lasting more than 2 seconds. This allowed us to identify individual activity events throughout the 24 hours of data collected.
For single variable analysis, we filtered the data to select the activity events in the top 50% for each parameter: distance (m, meters), duration (s, seconds), and velocity (m/min, meters/minutes). We also measured: total time spent running, total distance traveled and sum of events. When a normal distribution could be determined using the Kolgomorov-Smirnov test, a parametric One-way ANOVA analysis was performed followed by a Bonferronipost-test. Statistical corrections to account for non-Gaussian distributions were used when necessary, Kruskal-Wallis Test and Dunn’s post-test. One-variable statistical analyses were performed using GraphPad PRISM 5.0®. Furthermore, three-dimensional activity profiles were generated for individual animals of each SCS strain using the 3D Histogram Macro in SigmaPlot® v. 12.0 to produce 10×10 matrices that were used to evaluate data distribution, as described previously by our group [18]. From these matrices, we selected 3×3 regions that encompassed consistent and characteristic populations of high velocity and prolonged duration events from our wild-type strains to compare to our mutant panel. We determined the region of interest (ROI) by identifying the coordinate with the highest frequency and selecting the 3×3 square surrounding it. The regions of interest were analyzed as a proportion of the total events in the heat map.
For statistical comparison, experimental controls were age- and gender-matched while being selected depending on the genetic background of the animals: FVB/NJ mice were used as a control for αV249F, αL251T, δS268F, ɛL269F, and αC418W mice, whereas C57BL/6 was used as a control for δS262T. All animals were randomly selected for this study to avoid a selection bias regarding diseases presentation.
RESULTS
The phenotype of nAChR mutation induced SCS animal models has been partially characterized focusing on grip strength and paradigms such as the hanging wire test, where an animal is place upside down while hanging on a wire between two poles, while measuring the time it takes to either fall down or cross to the one of the corner poles [6]. In brief, these models (αC418W, αL251T & ɛL269F) exhibit a decrease in grip strength when compared to their wild type counterpart, that in the case of αL251T & ɛL269F can be correlated with an increased amount of calcium deposits in the NMJ [6]. In addition, some reports also note an increase in respiratory rate speculated to be a result of accessory muscle weakness and a reduced spontaneous exploratory activity in the ɛL269F [1]. However, a clear lack of more thorough examination into the behavior profile of these mouse models is evident. Thus, we decided to use running wheels to address this issue.
From our panel of SCS mice, the αL251T and ɛL269F mutants exhibit a significant reduction in the total distance traveled in a period of 24 hours (Fig. 1A). However, only the αL251T mutant exhibits reduced total time spent running (Fig. 1B). No significant differences can be appreciated amongst our panel when examining the total amount of running events (Fig. 1E). Comparing the average distance or duration of individual activity events for both αL251T and ɛL269F reveals a significant decrease for the αL251T mutant in distance and substantial, albeit not statistically significant decreases in duration when compared to wild-type (Fig. 1F and I). In addition, ɛL269F mice display a significant reduction in the average velocity of individual events (Fig. 1J). Comparison of the C57BL/6 and δS262T mice reveals a significant increase in the average velocity of individual events (Fig. 1L). Evaluation of total distance, total time running, total running events, average event distance, average event duration, and average event velocity between C57BL/6 and δS262T shows no significant differences (Fig. 1C, D, G, H, and K).
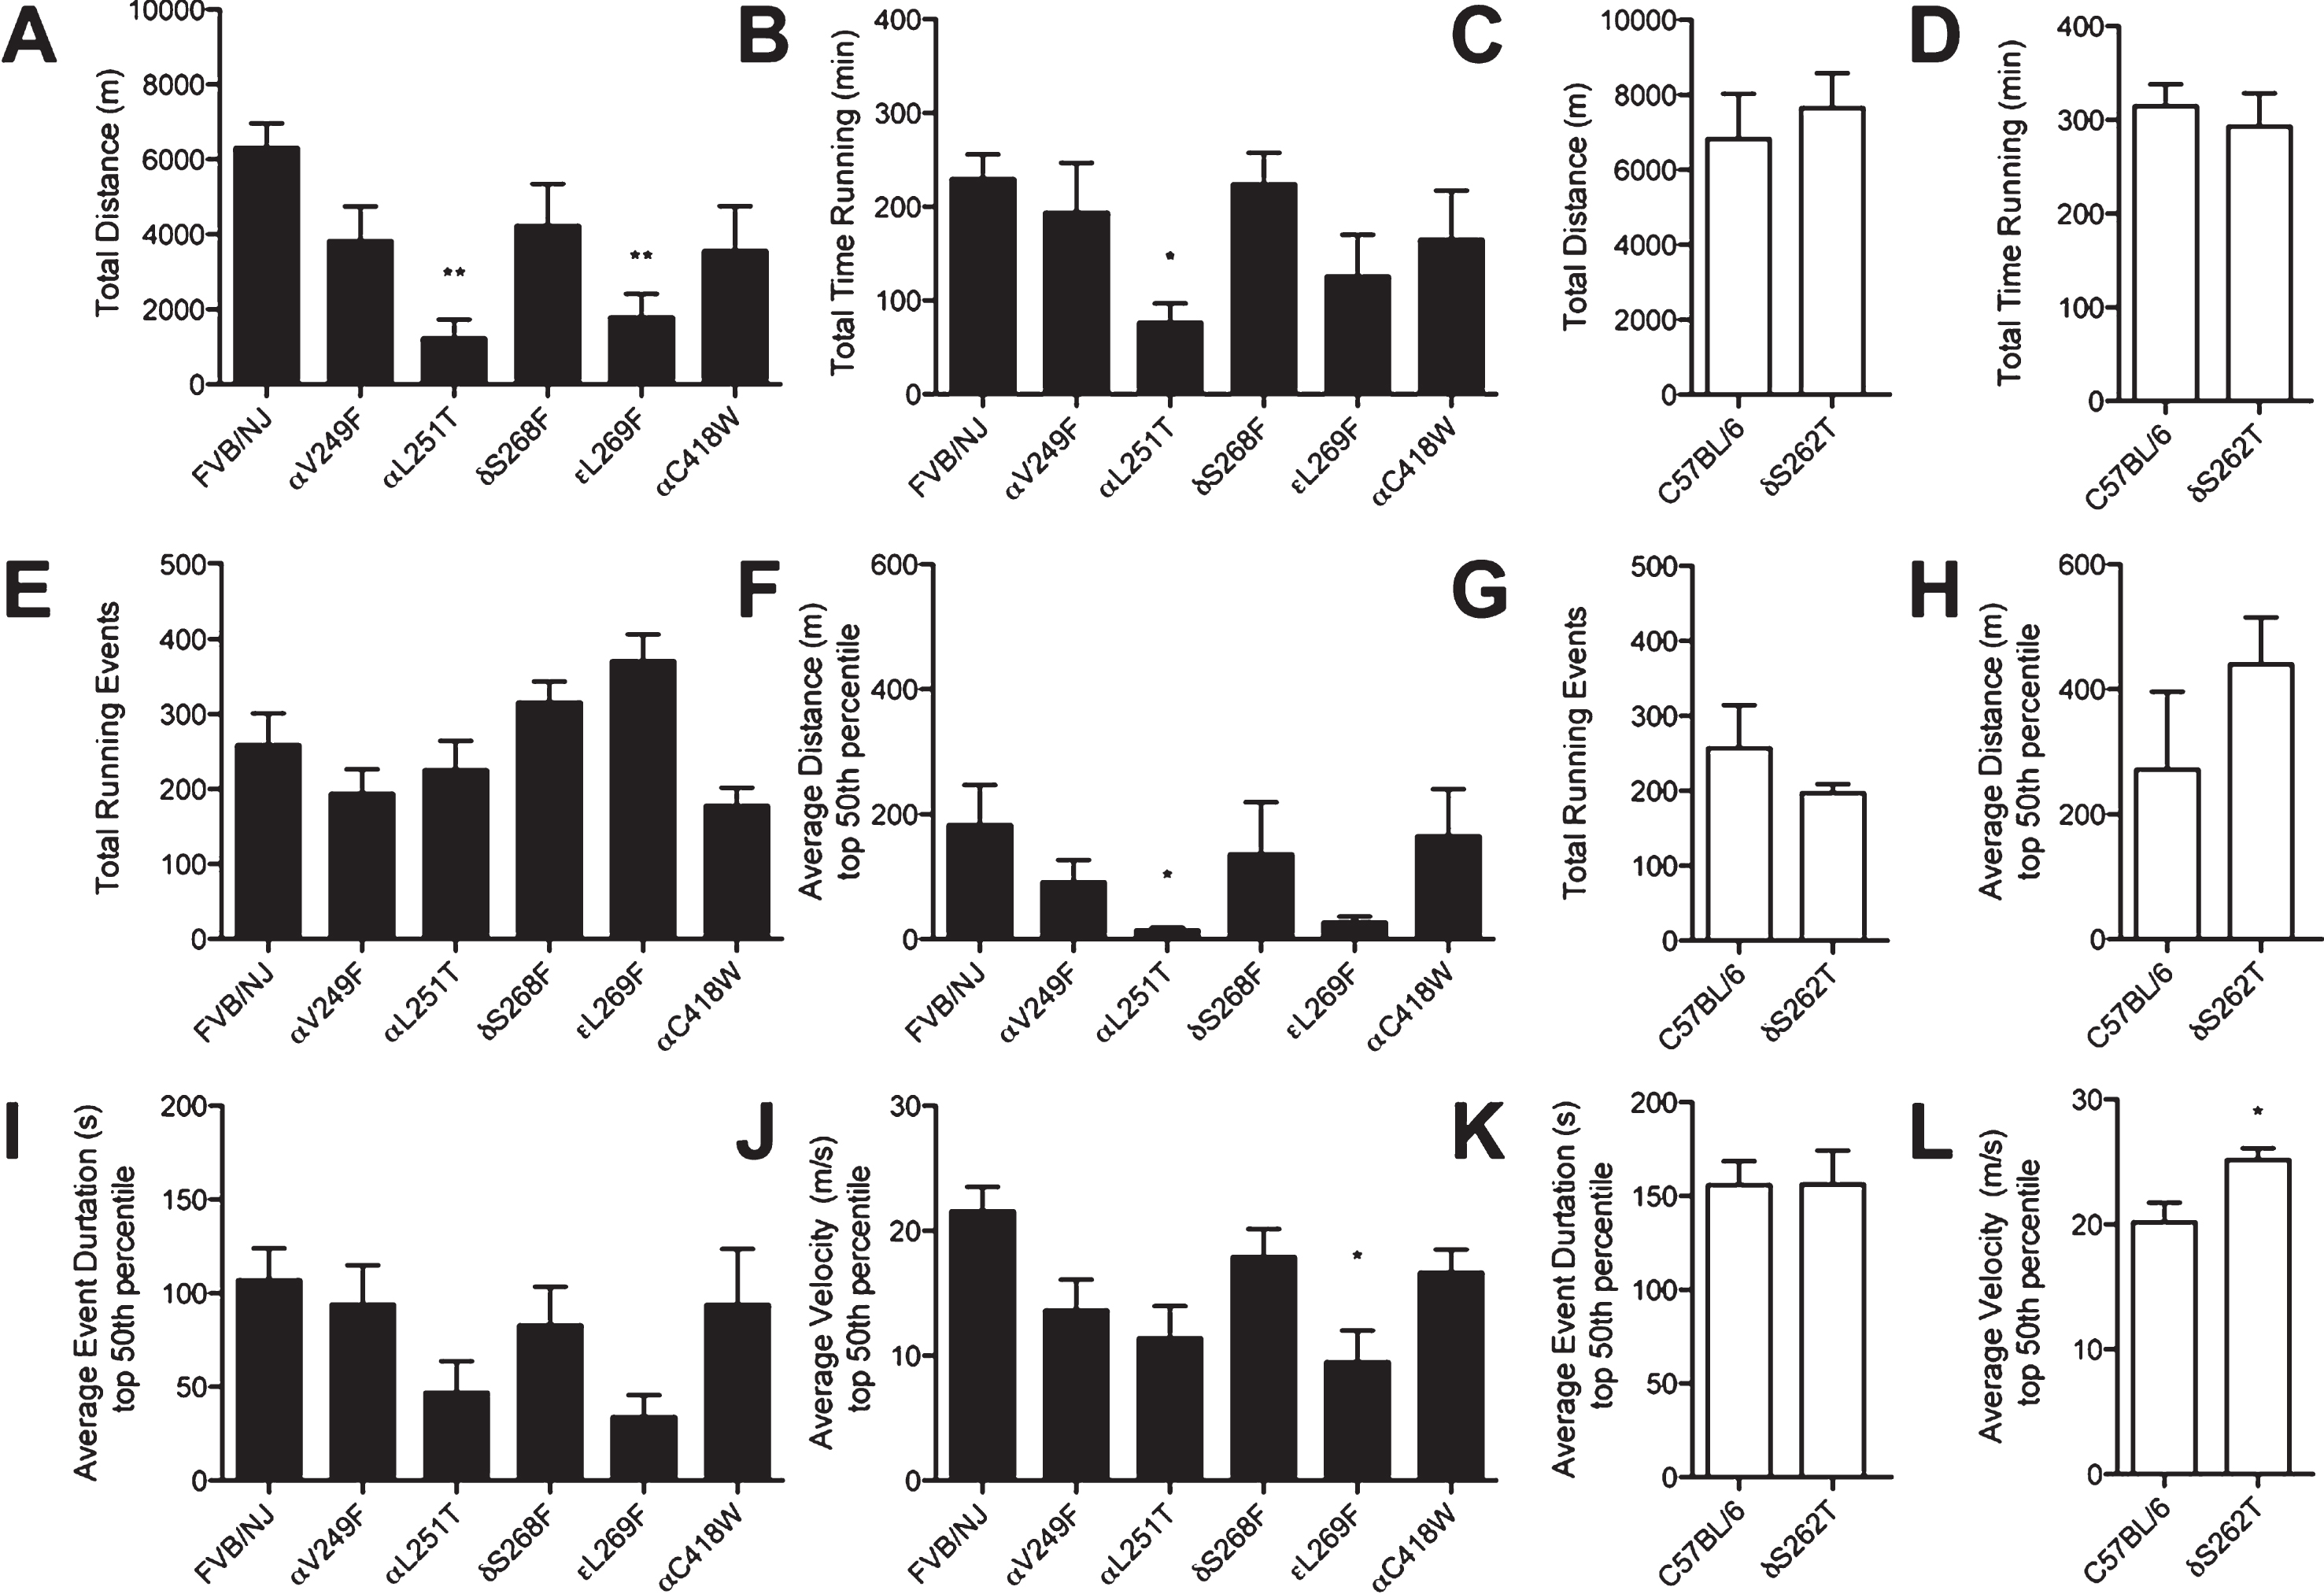
Traditional locomotor metrics reflect variability for a comparison between strains in a panel of SCS mice. Analysis of a 24 hr period of free access to running wheels in a home cage environment reveals decreases in certain facets of locomotor behavior for SCS mice when compared to controls (FVB/NJ n = 6, αV249F n = 6, αL251T n = 6, δS268F n = 6, ɛL269F n = 5, αC418W n = 6, C57BL/6 n = 5, and δS262T n = 6). Comparison of animals from an FVB/NJ background (αV249F, αL251T, δS268F, ɛL269F, αC418W) in terms of total distance (A), total time spent running (B), the amount of running bouts (E), average meters traveled in the 50% longest events in terms of distance (F), average time spent running of the 50% longest events in terms of duration (F) and the average velocity of the fastest 50% events (J). Comparison of animals from a C57BL/6 background (δS262T) in terms of total distance (C), total time spent running (D), the amount of running bouts (G), average meters traveled in the 50% longest events in terms of distance (H), average time spent running of the 50% longest events in terms of duration (K) and the average velocity of the fastest 50% events (L). Bars represent mean +/–SEM with bar color representing the mice background, black bars for FVB/NJ and white for C57BL/6; Unpaired T-test & One-Way ANOVA (Dunn’s Multiple Comparison Test), *P < 0.05; **P < 0.001.
Multivariable analysis of our data shows qualitative differences in the distribution of events with different velocity and duration (Fig. 2A). Quantification of our three-dimensional activity profiles using pre-determined regions, based on wild-type running patterns, reveals differences in the proportion of events located in the region of interest (ROI). Of interest, the selected ROI represents high-velocity/long-duration events and is reduced across our SCS panel, revealing significant differences between the αL251T and ɛL269F mice (Fig. 2B). Multivariate comparison between C57BL/6 and δS262T reveals no significant difference between the ROI in each of the strains (Fig. 2C).
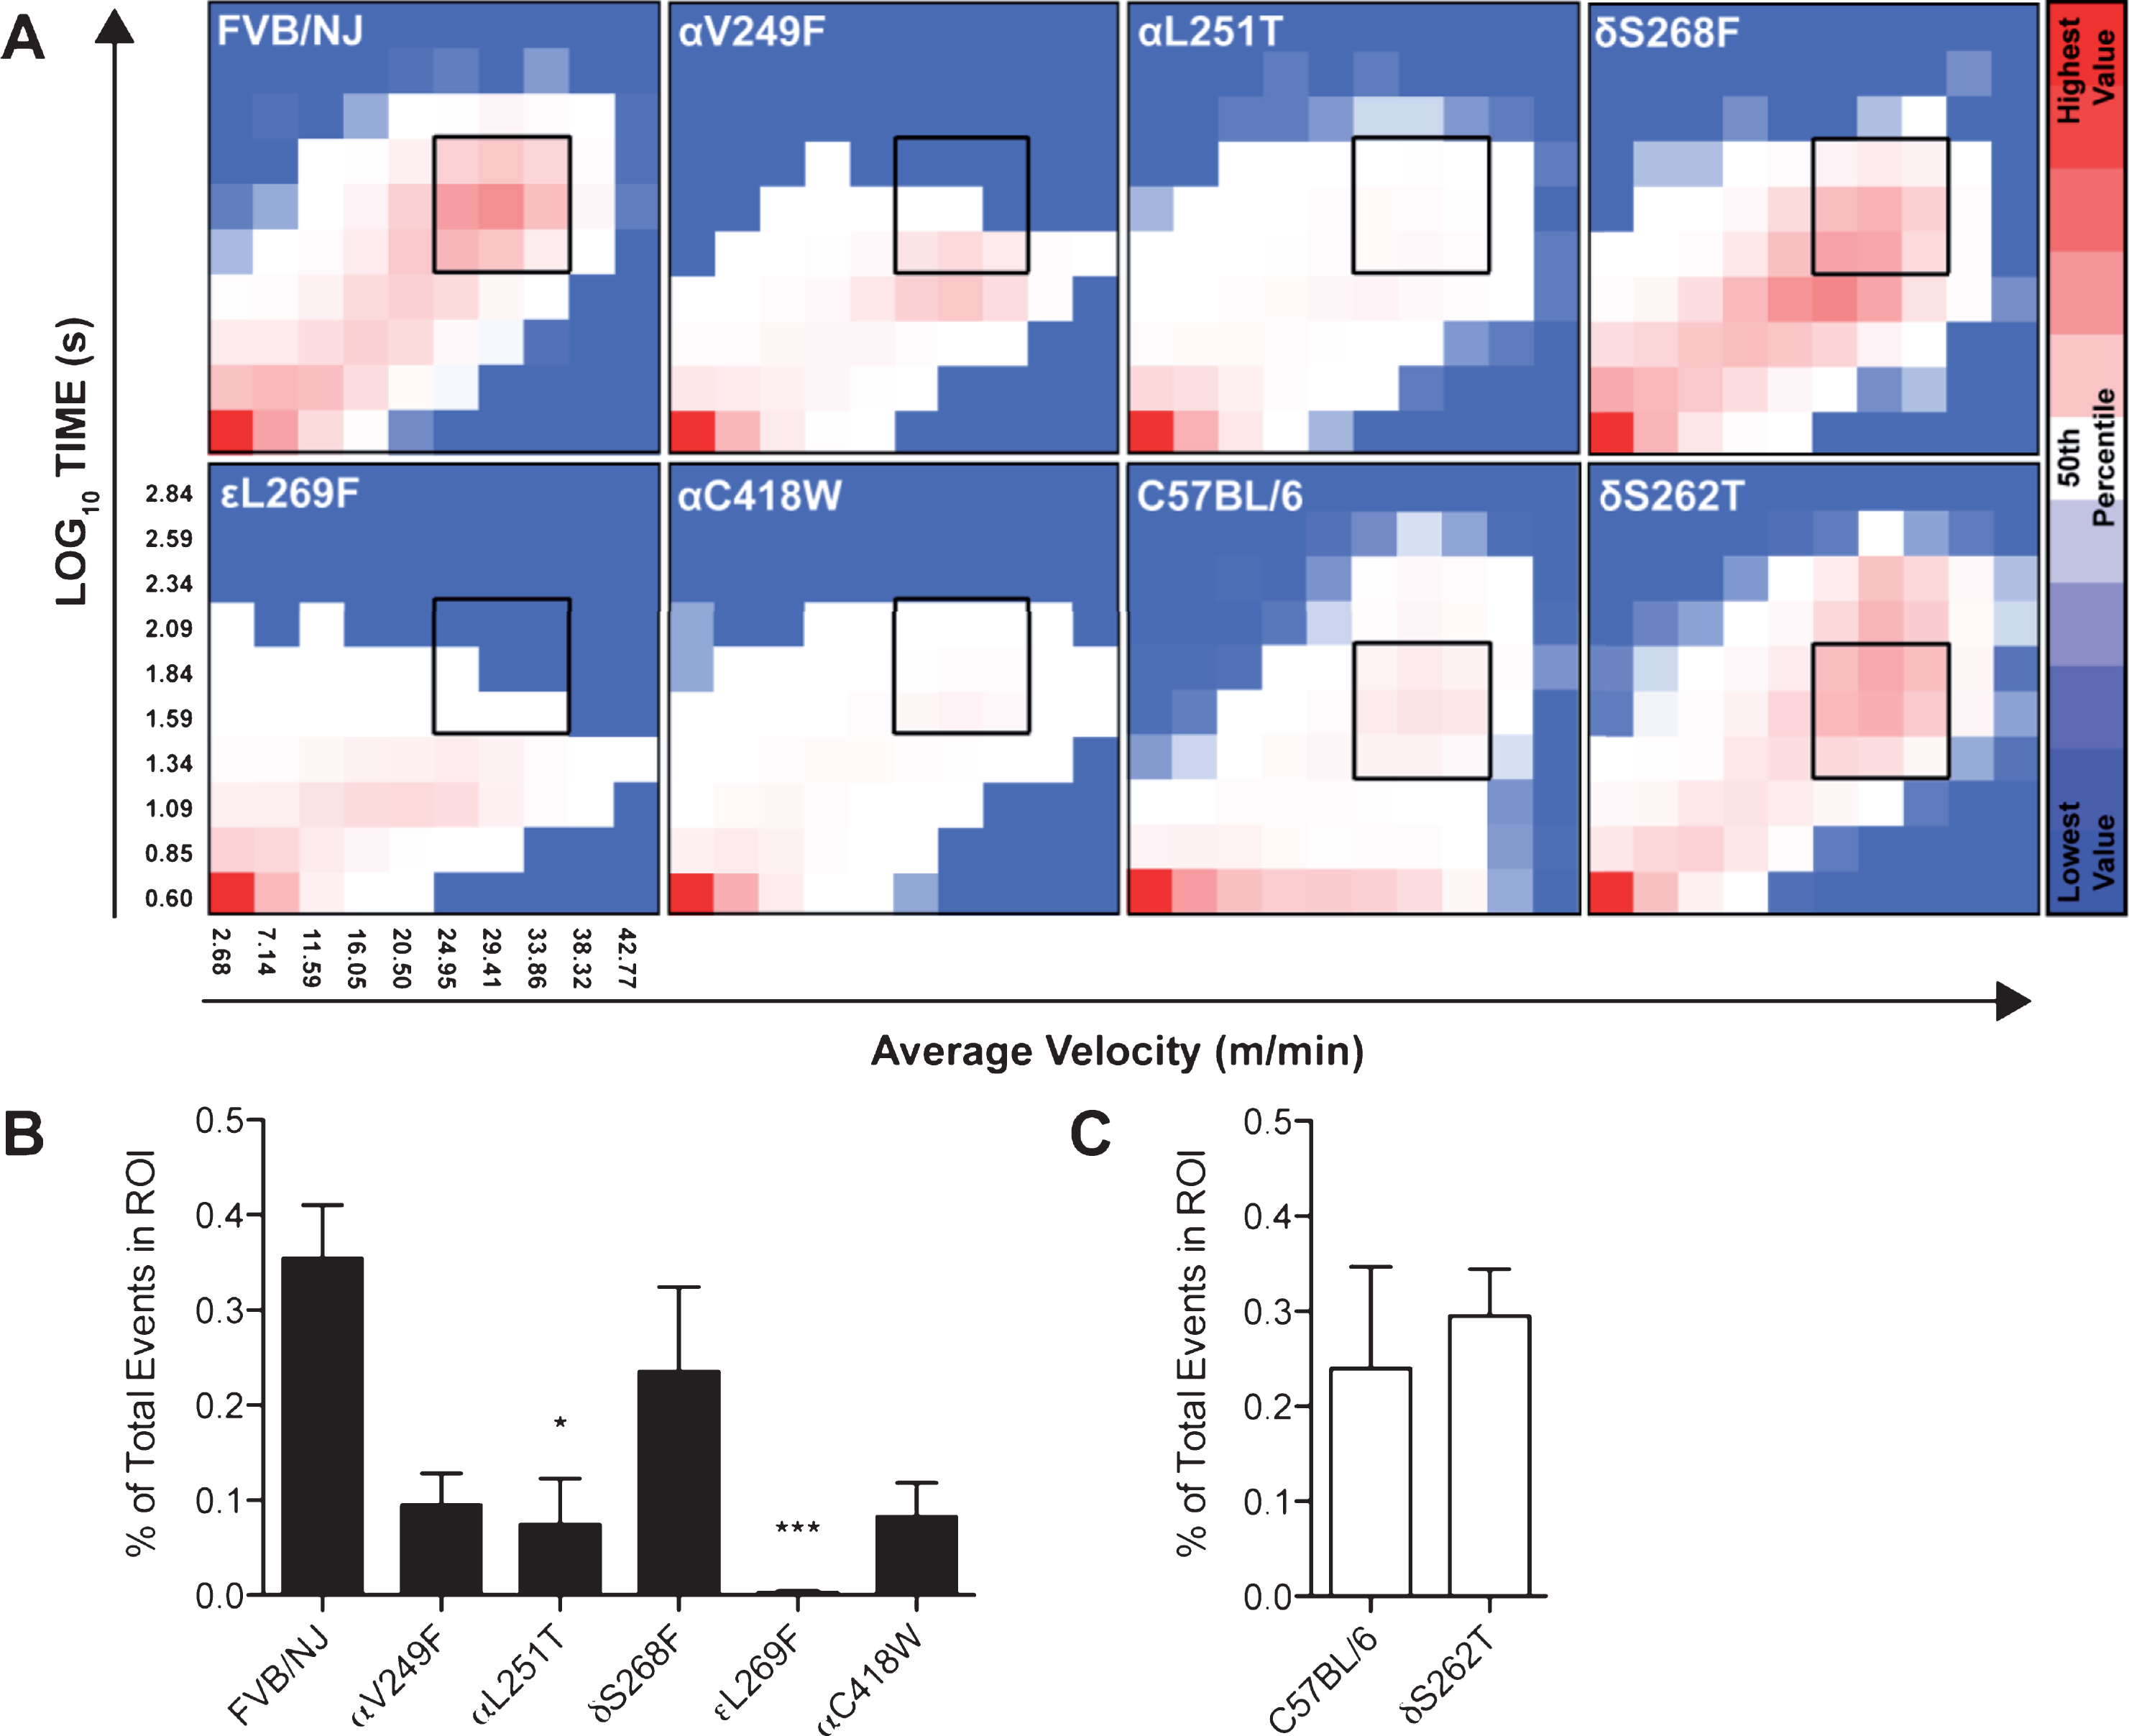
Multi-variable analysis reveals robust differences in locomotor phenotype amongst a panel of SCS mice. Generation of 10×10 matrices between the duration and average velocity of individual activity events, in combination with the frequency of such events, results in a graphical representation of locomotor activity for a period of 24 hours (FVB/NJ n = 6, αV249F n = 6, αL251T n = 6, δS268F n = 6, ɛL269F n = 5, αC418W n = 6, C57BL/6 n = 5, and δS262T n = 6) (A). Comparison of a region of interest (ROI) based on the appropriate wild-type control reveals robust differences between our control animals and the majority of the SCS strains (B, C). Bars represent mean +/–SEM with bar color representing the mice background, black bars for FVB/NJ (αV249F, αL251T, δS268F, ɛL269F, αC418W) and white for C57BL/6 (δS262T); Unpaired T-test & One-Way ANOVA, Dunn’s Multiple Comparison Test, *P < 0.05; ***P < 0.0001.
DISCUSSION
Existing SCS models represent a spectrum that encompasses differences in nAChR channel gating kinetics and disease pathophysiology [6, 7]. In humans, this diversity of clinical presentations is also present, leading to a hindered understanding of the relationship between pathophysiology and phenotype [8]. Of interest to our group is the extent to which muscle weakness affects locomotor functioning in humans suffering from SCS. Various reports note that a subset of patients exhibit difficulties in locomotion, correlated with nAChR mutations [15, 16]. However, this aspect is poorly understood, and its study could provide an answer in terms of more closely relating the animal models we use to study SCS and the human presentation of such disorder.
Running-wheel analysis of SCS mice revealed impaired volunteer locomotor activity as a function of altered nAChR kinetics. Data shows a near three-fold reduction in total distance traveled, a two-fold reduction in time spent running, a non-significant but remarkable 100-fold reduction in the distance traveled during an individual running event, and a 50% reduction in the duration and velocity of individual running events for the αL251T and ɛL269F mutants (Fig. 1A, B, F, I and J respectively). The voluntary locomotor activity phenotype for the αL251T and ɛL269F mutants represents a severe manifestation of SCS and correlates with previous reports in the literature [1, 19]. These strains are characterized by prolonged channel opening, reduced muscle strength, loss of NMJ nAChR and NMJ calcium accumulation that leads to endplate myopathy [6, 20].
Nevertheless, one-dimensional analysis of locomotor data fails to represent the complexity of our animal models. Therefore, we generated three-dimensional representations of a 24 hr activity period using the velocity and duration of individual events to come up with a new metric. The benefit of such analysis relies on its ability to segregate voluntary activity events into three-dimensional collections of points that favor detection of subtle changes. We define our analysis as a voluntary running activity profile. Three-dimensional representation of voluntary locomotor activity permits the exploration of complex motor dynamics and maximizes our capacity to detect differences between our mice models in a qualitative and quantitative manner (Fig. 2A, B and C). To further evaluate these differences we selected an ROI, based on the wild-type strain profile, which represented a discrete and consistent population of activity events. Measuring the sum of events within the ROI, we calculated the proportion of the total events compiled in the heat map and took a quantitative approach towards analyzing our three-dimensional multivariable analysis (Fig. 2B, C). Our data revealed that four of our mutant strains possess diminished voluntary motor activity within the ROI when compared to their wild-type counterpart, suggesting that these SCS models show patterns of hindered locomotor activity for high velocity and long duration running events (Fig. 2B). Although the majority of the SCS panel exhibited some degree of locomotor impairment, the δS262T mutant did not. We speculate that this lack of phenotype is consistent with the lack of clinically evident weakness, degeneration of the NMJ and normal levels of nAChR in the endplate even at 6 months of age [2]. As a result, the δS262T mutation presents an interesting model in which miniature endplate current (MEPC) amplitude is reduced but no phenotype has been described, therefore further investigation might be warranted to elucidate the clinical implications of such mutation. However, studying a mutation that lacks a known phenotype is still relevant for several reasons. First, locomotion has never been thoroughly assessed in SCS animal models, thus we should not assume that the lack of weakness and absent NMJ degeneration translates to normal volunteer activity. Lastly, the use of the δS262T mutant serves as a control to correlate our findings with metrics used in the past; providing a stronger rationale for considering the use of running wheels as a proxy to assess muscle weakness and NMJ degeneration.
It is important to keep in mind that SCS animal models represent a wide range of disease presentation and model to a minimum the complexity and physiology of human SCS patients. Our group has previously described the clinical presentation of SCS-causing nAChR mutations in human patients, and even though SCS can sometimes possess a severe presentation, differences regarding physical exam findings and clinical score confer each one of these mutations a unique clinical scenario [3, 7]. It has been shown that SCS mice present a wide range of nAChR kinetic/gating deficits, but that only the αL251T and ɛL269F uniquely possess muscle weakness, calcium deposits upon exercise and neuromuscular degeneration, which closely resembles human disease [1, 6]. Therefore, our results support the current understanding of these models as described in the literature.
However, subtle differences and variations in SCS presentation are found in the literature and attest to the need of a powerful tool to uncover phenotypical differences in a neurodegenerative model that are not appreciated when evaluated by traditional metrics. As an example, our group previously has shown that traditional metrics were not enough to detect changes in behavior using the αC418W upon membrane cholesterol depletion via statin treatment, but only when a multivariate analysis was used, then the phenotype was uncovered [18]. We believe each model is unique and in some cases, single variable data seems to come up short to describing a phenotype. Therefore, it is possible to take advantage of a multivariable approach like ours to provide a more thorough and sensitive representation. We propose this tool as one to compliment and expand a locomotor test battery in order to identify subtle changes that would be impossible otherwise. Thus, by generating profiles that accurately represent animal behavior, we will reduce the probability of failing to capture an accurate locomotor profile for these complex animal models. The applications of a model like ours should not be limited to the study of locomotor deficits in mice, but should be interpreted as a proof of concept that multivariable analysis of behavioral outputs can help resolve the subtlety and variability of behavioral experiments. Thus, such approaches will enable us to gain an alternate perspective from traditional single metrics that have long shown little or no potential for translation in clinical settings.
In brief, we have demonstrated that changes in the biophysical properties of nAChRs lead to changes in voluntary locomotor activity. Our panel of SCS mice exhibits behavioral differences that can be detected by the use of running wheels and multivariable analyses. The use of locomotion to characterize a mouse model is not new, but the ability to obtain a unique fingerprint-like signature allows us to expand our understanding of how central and peripheral nervous system disorders can manifest in rodent models [21, 22]. Our approach should not be interpreted as one necessarily confined within the variables measured in this article, the potential for further exploration of other metrics related to locomotion represent its depth and unexploited value.
CONFLICTS OF INTEREST
The authors have no conflict of interest to report.
Footnotes
ACKNOWLEDGMENTS
This work was supported by National Institutes of Health (NIH) Grants 1P20GM103642 (J.R. and J.A.L.D.), NIH Grant R01 NS033202-15A2 (C.M.G.), Research Initiative for Scientific Enhancement (RISE) Program Grant 5R25GM061151-16 (A.G.G., M.D.V. & OQ), the Minority Access to Research Careers (MARC) Program Grant 5T34GM007821-38 (J.G.G.R.; G.E. G.R. & OQ) and NIGMS P20GM103642 (J.A.L.D).