
Abstract
The interpretation of the electroencephalogram (EEG) signal is one method that can be utilized to diagnose epilepsy, which is one of the most prevalent brain illnesses. The length of an EEG signal is typically quite long, making it difficult to interpret manually. Extreme Learning Machine (ELM) is used to detection of Epilepsy and Seizure. But in ELM Storage space and training time is high. In order to reduce training time and storage space African Buffalo Optimization (ABO) algorithm is used. ABO is combined with Sparse ELM to improve the speed, accuracy of detection and reduce the storage space. First, Wavelet transform is used to extract relevant features. Due to their high dimensionality, these features are then reduced by using linear discriminant analysis (LDA). The proposed Hybrid Sparse ELM technique is successfully implemented for diagnosing epileptic seizure disease. For classification, the Sparse ELM-ABO classifier is applied to the UCI Epileptic Seizure Recognition Data Set training dataset, and the experimental findings are compared to those of the SVM, Sparse ELM, and ELM classifiers applied to the same database. The proposed model was tested in two scenarios: binary classification and multi-label classification. Seizure identification is the only factor in binary classification. Seizure and epilepsy identification are part of multi-label classification. It is observed that the proposed method obtained high accuracy in classification with less execution time along with performance evaluation of parameters such as prediction accuracy, specificity, precision, recall and F-score. Binary classification scores 96.08%, while multi-label classification achieves 90.89%.
Keywords
Introduction
Computer-aided medical diagnosis has become very common in the field of medicine. The major challenge in medical diagnosis is the absence of ambiguity in the decisions made by the computer-aided systems. Any machine learning technique deployed for the purpose of medical diagnosis should be able to produce non-ambiguous outcomes. Machine learning methods applied for classification are cost-effective means to perform diagnosis, prediction, or detection of most outcomes in health care research. Epilepsy is common neurological disorder which is persistent in nature in human and causes recurrent seizure. It is estimated that almost a percent of human population is suffering from epilepsy. An epileptic seizure is highly fatal, in the sense that it causes death to a patient. This makes it essential to identify and treat at an initial state to avoid fatal losses. In most cases in our country occurrence of epileptic seizures are usually identified by means of interviewing a patient. And the inspection of the electroencephalogram (EEG) signals by specialists. However, it is a usual scenario that the patient may be unaware of the occurrence of seizure, hence the EEG signals can be analyzed and used for the diagnosis of epilepsy. Since it is difficult for a patient to foresee when these seizures will occur, it is essential to predict their occurrence so that preventive measures can be taken to avert loss of consciousness, which can occasionally result in death. The electroencephalogram (EEG) is a technique that uses electrodes placed on the scalp to record the electrical activity of the brain under controlled conditions. Changes in EEG waveform can be seen as a reflection of particular frequencies. Clinicians can use comparisons to identify certain illnesses of the nervous system. Electrocorticography (ECoG) [1], functional magnetic resonance imaging (fMRI) [2], positron emission tomography (PET) [3], single-photon emission computerized tomography (SPECT) [4], and electroencephalography (EEG) [5] have all been used in investigations of epilepsy monitoring. EEG signal devices are lightweight and inexpensive compared to other epilepsy methods, and their time-domain recordings can be converted to the frequency domain for further analysis. Electroencephalogram (EEG) signals are generated by ionic currents from fluctuations in voltage originating from neurons in the brain, and they are commonly utilized for the detection of epileptic seizures [6]. Based on their symptoms, neurologists have classified seizures as either partial or generalized.
The symptoms of a partial seizure can be identified as being caused by damage to only one hemisphere of the brain. Additionally, there are two primary categories of partial seizure types: simple-partial and complex-partial. Patients with complex-partial tend to act erratically, become confused, and typically act by chewing and mumbling, in contrast to those with simple-partial, who appear to be aware and able to communicate in general. There are two basic phases to a generalized seizure as well. Conclusive seizures are more challenging to detect because they don’t present with motor indications, but nonconclusive seizures are easier to identify. The individual is restricted to staring without the ability to move or speak. Because EEG signals during a seizure will display some distinctive indications like spikes, neurologists examine and diagnose the information reflected from EEG signals during the epileptic seizure detection job.
However, it is important to remember that physicians’ visual evaluation of patients can be time-consuming, tiring, and prone to human error when it comes to the accurate detection of epilepsy seizures. It is valuable and necessary to discover a method for addressing these issues. Computer-based prediction methods, such as machine/deep learning classifiers, could help overcome these obstacles as artificial intelligence (AI) research progresses. Diseases, and particularly epileptic seizures, have benefited greatly from the widespread application of machine/deep learning techniques in recent years. These machine learning/deep learning methods dramatically alleviate the burden placed on physicians, boost the efficiency with which diagnoses are made, and provide an unbiased and precise assessment. Machine learning and deep learning have been the subject of an increasing number of academic investigations in this area. All of the Existing approaches only addressed linear features, which means that they might not be able to uncover the underlying subtle shifts in the time series. They didn’t use any feature selection strategy to cut down on the number of features, and they didn’t demonstrate how changing the confidence levels affected the outcome of the data reduction process. Major drawbacks are storage space required, the amount of training time required, and the number of features required. To address these issues, we suggested a Hybrid Sparse Extreme Learning Machine that combines the African Buffalo Optimization Algorithm with a feature selection technique. The remaining portion of this work is divided into sections as follows: Section II provides the gist of a survey conducted by a number of researchers Section III summarizes the process that was proposed, Section IV explains the Experimental Results: Assessment of the proposed method. Finally, Section V Ends the paper with a list of cited references.
Related study
Classical approaches for detecting and classifying epileptic electroencephalogram (EEG) signals rely on manual visual inspection and analysis by professionals; this process is time-consuming, laborious, and prone to errors. To get over the drawbacks of both eye inspection and conventional machine learning methods, it is crucial to look into autonomous modes that make use of AI. Time, frequency, time-frequency, and nonlinear methods are only few of the many that have been developed utilizing traditional and machine learning techniques [7, 8] Nonetheless, DL algorithms find its applications in epileptic seizure prediction and classification due to the emergence of a massive amount of data in the form of signals, texts, images, and sounds, among others, in health care management and the need for automated, smart, portable, wearable, and low-cost devices to improve patient diagnosis. The ability to process massive amounts of data and learn from the raw data has led to its widespread adopti on, making manual feature extraction obsolete compared to more traditional methods [9]. Changing electrical activity in the brain can be measured by analyzing an electroencephalogram (EEG), which is a one-dimensional (1D) signal in the temporal domain. Electrode recordings from the scalp (EEG) or from within the brain (ECoG) help distinguish between seizure and non-seizure states in epilepsy patients [10]. Preventing patients from losing consciousness, which can lead to harm or death, and aiding doctors in diagnosis and treatment, early detection and identification of epileptic seizures are crucial. Ictal EEG is electroencephalographic data collected during a seizure, although it might be difficult to use this information alone to distinguish between seizure and non-seizure epileptic signals due to the unpredictability of seizures [11].
The African Buffalo optimization is hybridized with Extreme Learning Machine to improve the speed and to obtain better result [12]. The detailed reason for the usage of ABO in combination with ELM is discussed in the fore-coming sections. All of the approaches that were discussed, however, only addressed linear features [13], which means that they might not be able to uncover the underlying subtle shifts in the time series. They did not use any feature selection strategy to cut down on the number of features [14], and they did not demonstrate how changing the confidence levels affected the outcome of the data reduction process. In addition to this, neither their training nor their testing time is optimum. To address all of these issues, we suggested a hybrid sparse extreme learning machine with optimum feature selection methods in this study. Morphological EEG was considered for separating epileptic patterns from non-epileptic of new patients [15]. New structure for detecting epilepsy by adopting six epileptic database [16] in an idea to identify the best combination was the ultimate objective of this work. FAM [17] takes the data and separates its important attributes. Then after, as RB fully utilizes the data from the convolutional layer, it discovers further crucial components. Last but not least, HT keeps the effective local attributes that were retrieved from the layers located at the various levels of the approach. a real - time detection model using extended short-term memory (LSTM) and convolutional neural networks (CNN). By [18] fusing CNN with LSTM classifiers, it aims to extract time and space data. Like a class-imbalance learning technique, Easy Ensemble may help to reduce the generalization performance of the epileptic phases. Despite ensuring sufficient effectiveness, the suggested strategy can greatly simplify the tasks that comes with data classification [19]. In order to streamline epileptic evaluation and treatment easier [20], an automatic epilepsy recognition approach that relies on bidirectional gated recurrent unit (Bi-GRU) neural network is suggested throughout this research.
To enhance classification accuracy in machine learning, numerous models have been devised that demonstrate its necessity. Recent research is instrumental in further advancing machine learning-based techniques applied to epileptic seizure classification and prediction using electroencephalograms (EEGs). One intriguing approach in this regard is the combination of Tunable-Q wavelet transformation, multiscale analyze and multivariate entropy in conjunction with Support Vector Machine (SVM) classifier has shown remarkable precision [21]. Another promising approach would be the Time- Time transform combined with developing local linear radial basis function networks utilizing algorithm for harmony searching [22]. Researchers have proposed the combination of Singular Value Decomposition (SVD) with Extreme Learning Machine (ELM). Researchers have proposed concepts such as Singular Value Decomposition (SVD), Extreme Learning Machine (ELM), as solutions. Exploration is another avenue of investigation and use Extreme Learning Machine ELM). The Extreme Learning Machine ELM] as possible solutions [23]. Researchers have proposed two other avenues (SVD+ELM). The other avenue of investigation being explored is Extreme Learning Machine ELM). Additionally, an innovative method combining Laguerre polynomial wavelets with support vector machines has achieved remarkable accuracy using different cross-validation techniques [24]. A further novel approach relies on single octal and wavelet transform patterns to detect epilepsy-related seizures within EEG signals [25].
Scientists have developed techniques for detecting abnormal epileptic EEG signals using Stockwell transforms and graph-based extreme machines. Furthermore, an adaptive neuro-fuzzy system (ANFIS) coupled with neural networks has proven highly successful at recognizing epilepsy from EEG signals - it boasts an impressive 96.7% sensitivity rate, 98.1% specificity and 99.7% accuracy [26]. Research efforts have also explored the intriguing idea of using reversible EEG networks as triggers for seizures, providing valuable insight into their causes and nature. Taken together, these studies represent significant advances towards improving EEG-based seizure classification as well as prediction capabilities. These efforts represent important advances towards improving accuracy and innovation within EEG seizure classification as well as prediction technologies. Overall, these developments represent important advances towards greater accuracy and innovation within seizure prediction technologies such as seizure classification capabilities as well as classification technologies [27]. Taken collectively, these advancements represent significant advances toward accuracy and innovation as EEG classification tools. In totality these efforts are significant advances towards improving accuracy as well as innovation within EEG seizure classification as well as prediction capabilities. All combined, these research efforts contribute towards accurate seizure classification as well as prediction by using EEG data. These advances constitute vital advances towards greater accuracy and innovation within seizure classification as well as classification. In summary these advances represent essential progress within EEG seizure prediction techniques. These research efforts represent important advances towards increased accuracy within EEG seizure prediction; all in total these research efforts represent important advances that contribute toward accurate classification as well as for accuracy as predicted prediction within EEG classification [28, 29].
Proposed method and mathematical expressions
In this study, we analyze many critical issues associated with the identification of epilepsy, including the amount of storage space required, the amount of training time required, and the number of features required. As a result, we design our process in such a way that it minimizes the amount of space required for storage, the amount of training required, and the number of features. We use a Hybrid Sparse Extreme Learning machine with African Buffalo Algorithm Fig. 1 in order to cut down on the amount of storage space required and the amount of time required training. In order to cut down on the necessary features, we use feature selection based on Pearson correlation coefficient. Our proposed model is applied on both binary classification and multi-label classification.
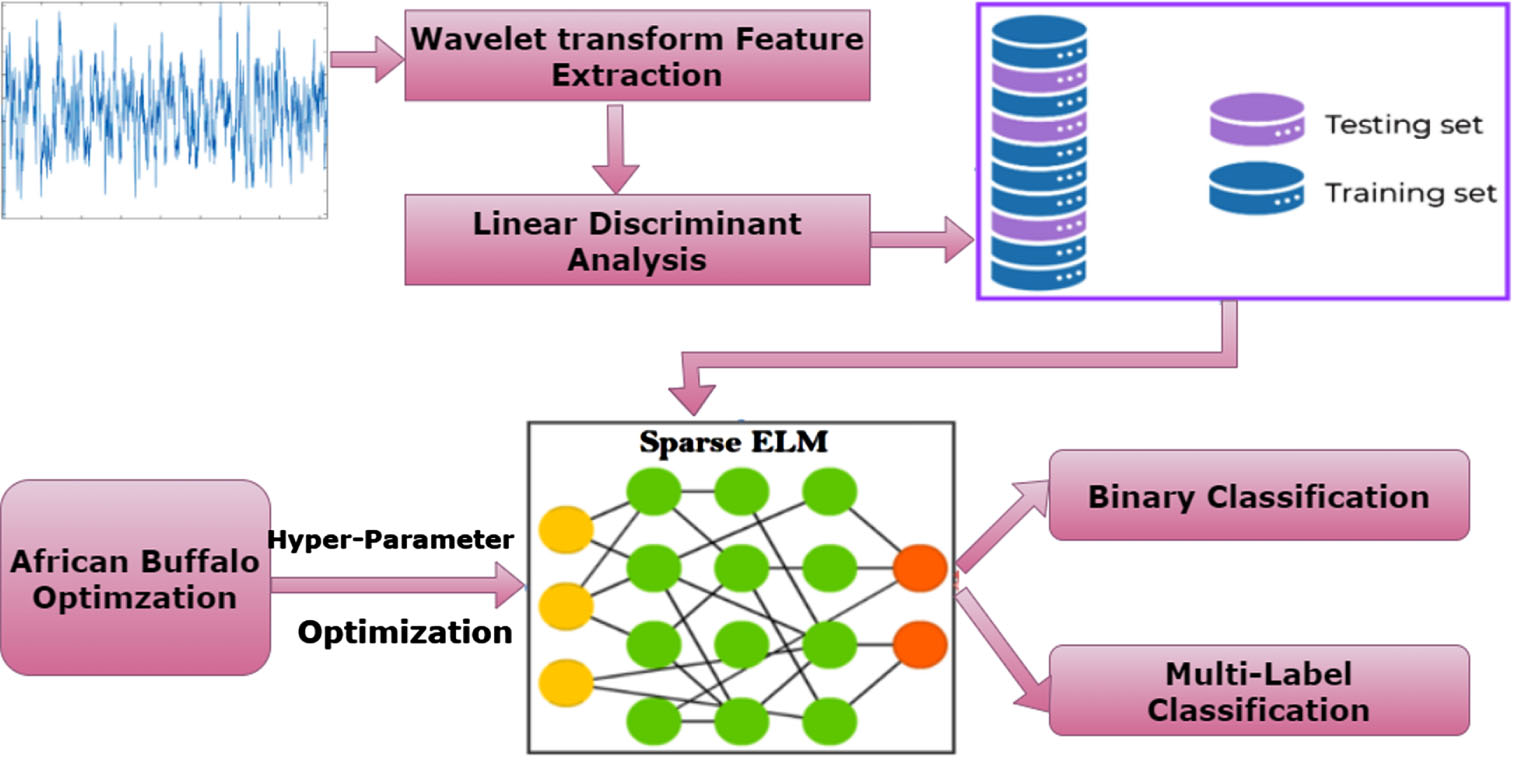
Proposed framework.
In this study, we extract a variety of features, including linear and nonlinear features, among other sorts of features. The following features have been extracted from the data: the minimum, the maximum, the skewness, the mean, the standard deviation, the mode, the interquartile range, the first quartile, the third quartile, the Shannon entropy, the Hurst exponent, the fluctuation index, the sample entropy, the median, and the kurtosis. A approach known as feature selection searches an entire dataset in an effort to find the most relevant and useful subset of features. The search space is comprised of all of the possible feature combinations that can be selected from the dataset that has been provided. The objective is to explore the search space and identify the feature set configuration that, when compared to all other configurations, results in the highest level of performance leverage. The primary advantages of feature selection include a reduction in the amount of overfitting, an improvement in accuracy, and a reduction in the amount of time needed for training. The following is a description of the feature selection algorithm that has been proposed:
High-quality feature subsets have a strong correlation with the overall class but little to no correlation with one another. Therefore, in order to examine the degree to which one feature is correlated with another feature or with a class, we make use of the Pearson correlation coefficient, which can be formally expressed as,
Where conv (p
m
, p
n
) is the co-variance of the two random variables p
m
and p
n
and variance is represented by σ2. The sample correlation is given by the below equation,
Where T and
Where mx and mn are each feature’s maximum and minimum value respectively. If eighty percent or more of the data points are outside of this range, then we don’t use that feature in our optimal feature set. Our final feature set for classification is obtained by filtering out all the irrelevant ones.
Studies have proven the Wavelet Transform (DWT) to be an efficient means of analyzing Electroencephalogram (EEG) signals [31]. For maximum precision and minimal computational load in seizure detection and minimizing computational burden, our study will use three kinds of wavelets for EEG analysis: Daubechies Coiflet and Symlet wavelets have been selected due to their extensive use in various research settings. Decomposition using wavelets and feature extraction are central elements in our classification method. To maximize effectiveness, we decided to split our decomposition process into four stages corresponding to distinct frequencies such as beta, gamma beta alpha theta delta; with level two producing especially fruitful results by producing lower frequency components that make for ideal feature extraction.
Within each dataset (A B C D and E), we analyzed 500 EEG signals that result in a combined data set of 500 6 = 3000 datapoints across six wavelets. After careful evaluation of features derived by Coiflet wavelets, we have settled upon them for our research study and have chosen significant features like Power Spectrum Density (PSD), Shannon Entropy Energy Mean, Kurtosis and Standard Deviation which form six key characteristics essential to epileptic seizures following decomposition. Each one plays an essential part of classification procedure. Figure 2 provides an example of four-level decomposition resulting from Wavelet Transforms. This figure gives a glimpse into the decomposition process while showing gradual refinement of EEG signals at every level. As previously discussed, we conducted an Coiflet wavelet decomposition of seizures EEG signals, illustrated visually in Fig. 7; specifically, the Delta component can be seen to have lower frequency values compared with its Symlet and Daubechies wavelet transform results showing similar characteristics at lower frequencies (Figs. 8, 9). As part of orthogonal wavelets family, Daubechies Coiflet and Symlet wavelet transforms are integral to EEG analysis of signals. Each offers its own distinct set of features and benefits for EEG analysis.
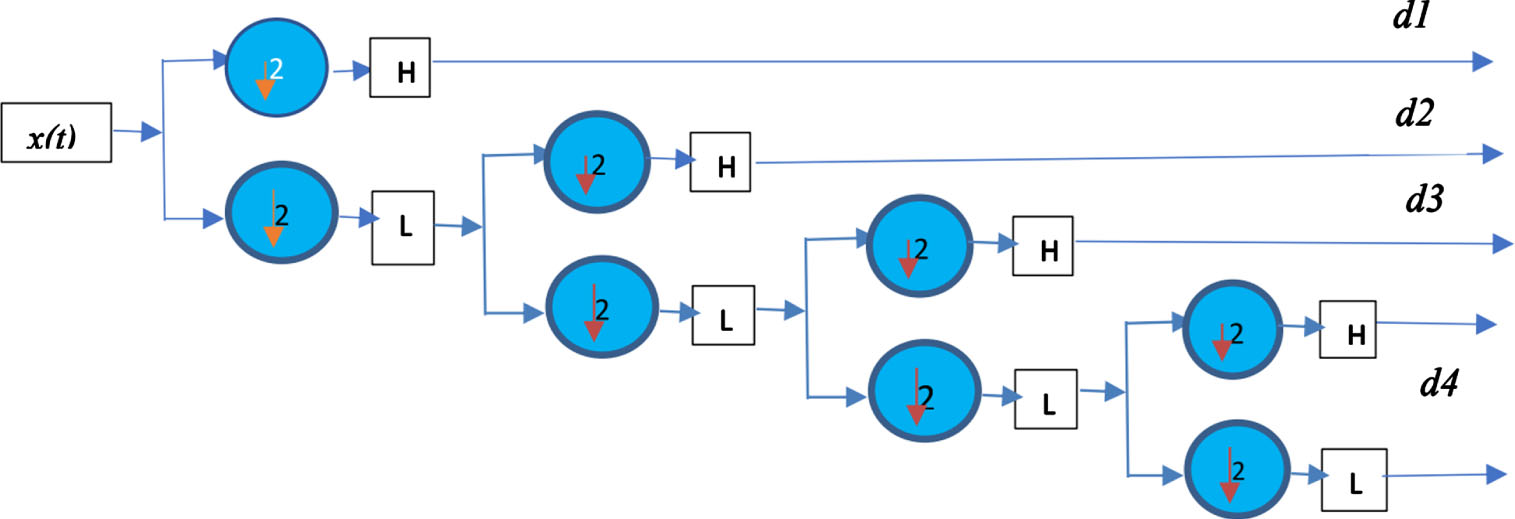
Signal decomposition algorithm (4-step).
When selecting features, it is vitally important to account for redundancies and non-related features. Failing to do this could lead to overfitting, in which a model works exceptionally well when trained, but struggles when presented with untested data. One solution for this issue is Linear Discriminant Analysis (LDA) [31].
LDA (Linear Discriminant Analysis) is an efficient feature engineering technique which seeks to identify a linear combination of features that contribute most effectively to classification processes. Its main goal is to reduce data samples to smaller spaces by compressing them together more tightly thereby decreasing set dimensions. Reducing dimensionality serves two important purposes. First, it helps unify features that are closely associated with data in close proximity and thus simplify their features. Second, this new feature space not only increases effectiveness of detection but also improves classification - striking an equilibrium between feature elimination and protecting valuable information. Examining LDA against Principal Component Analysis (PCA), after reducing dimensionality, there are notable distinctions. Most importantly, LDA demonstrates a more distinct median value for newly developed features than PCA; this difference can be seen clearly through box plots that display median values as highlighted points. Figures 3–5 provide visual representations of class probability distribution and median values by drawing red lines, providing insight into how well LDA generates discriminative features that improve classification processes overall.
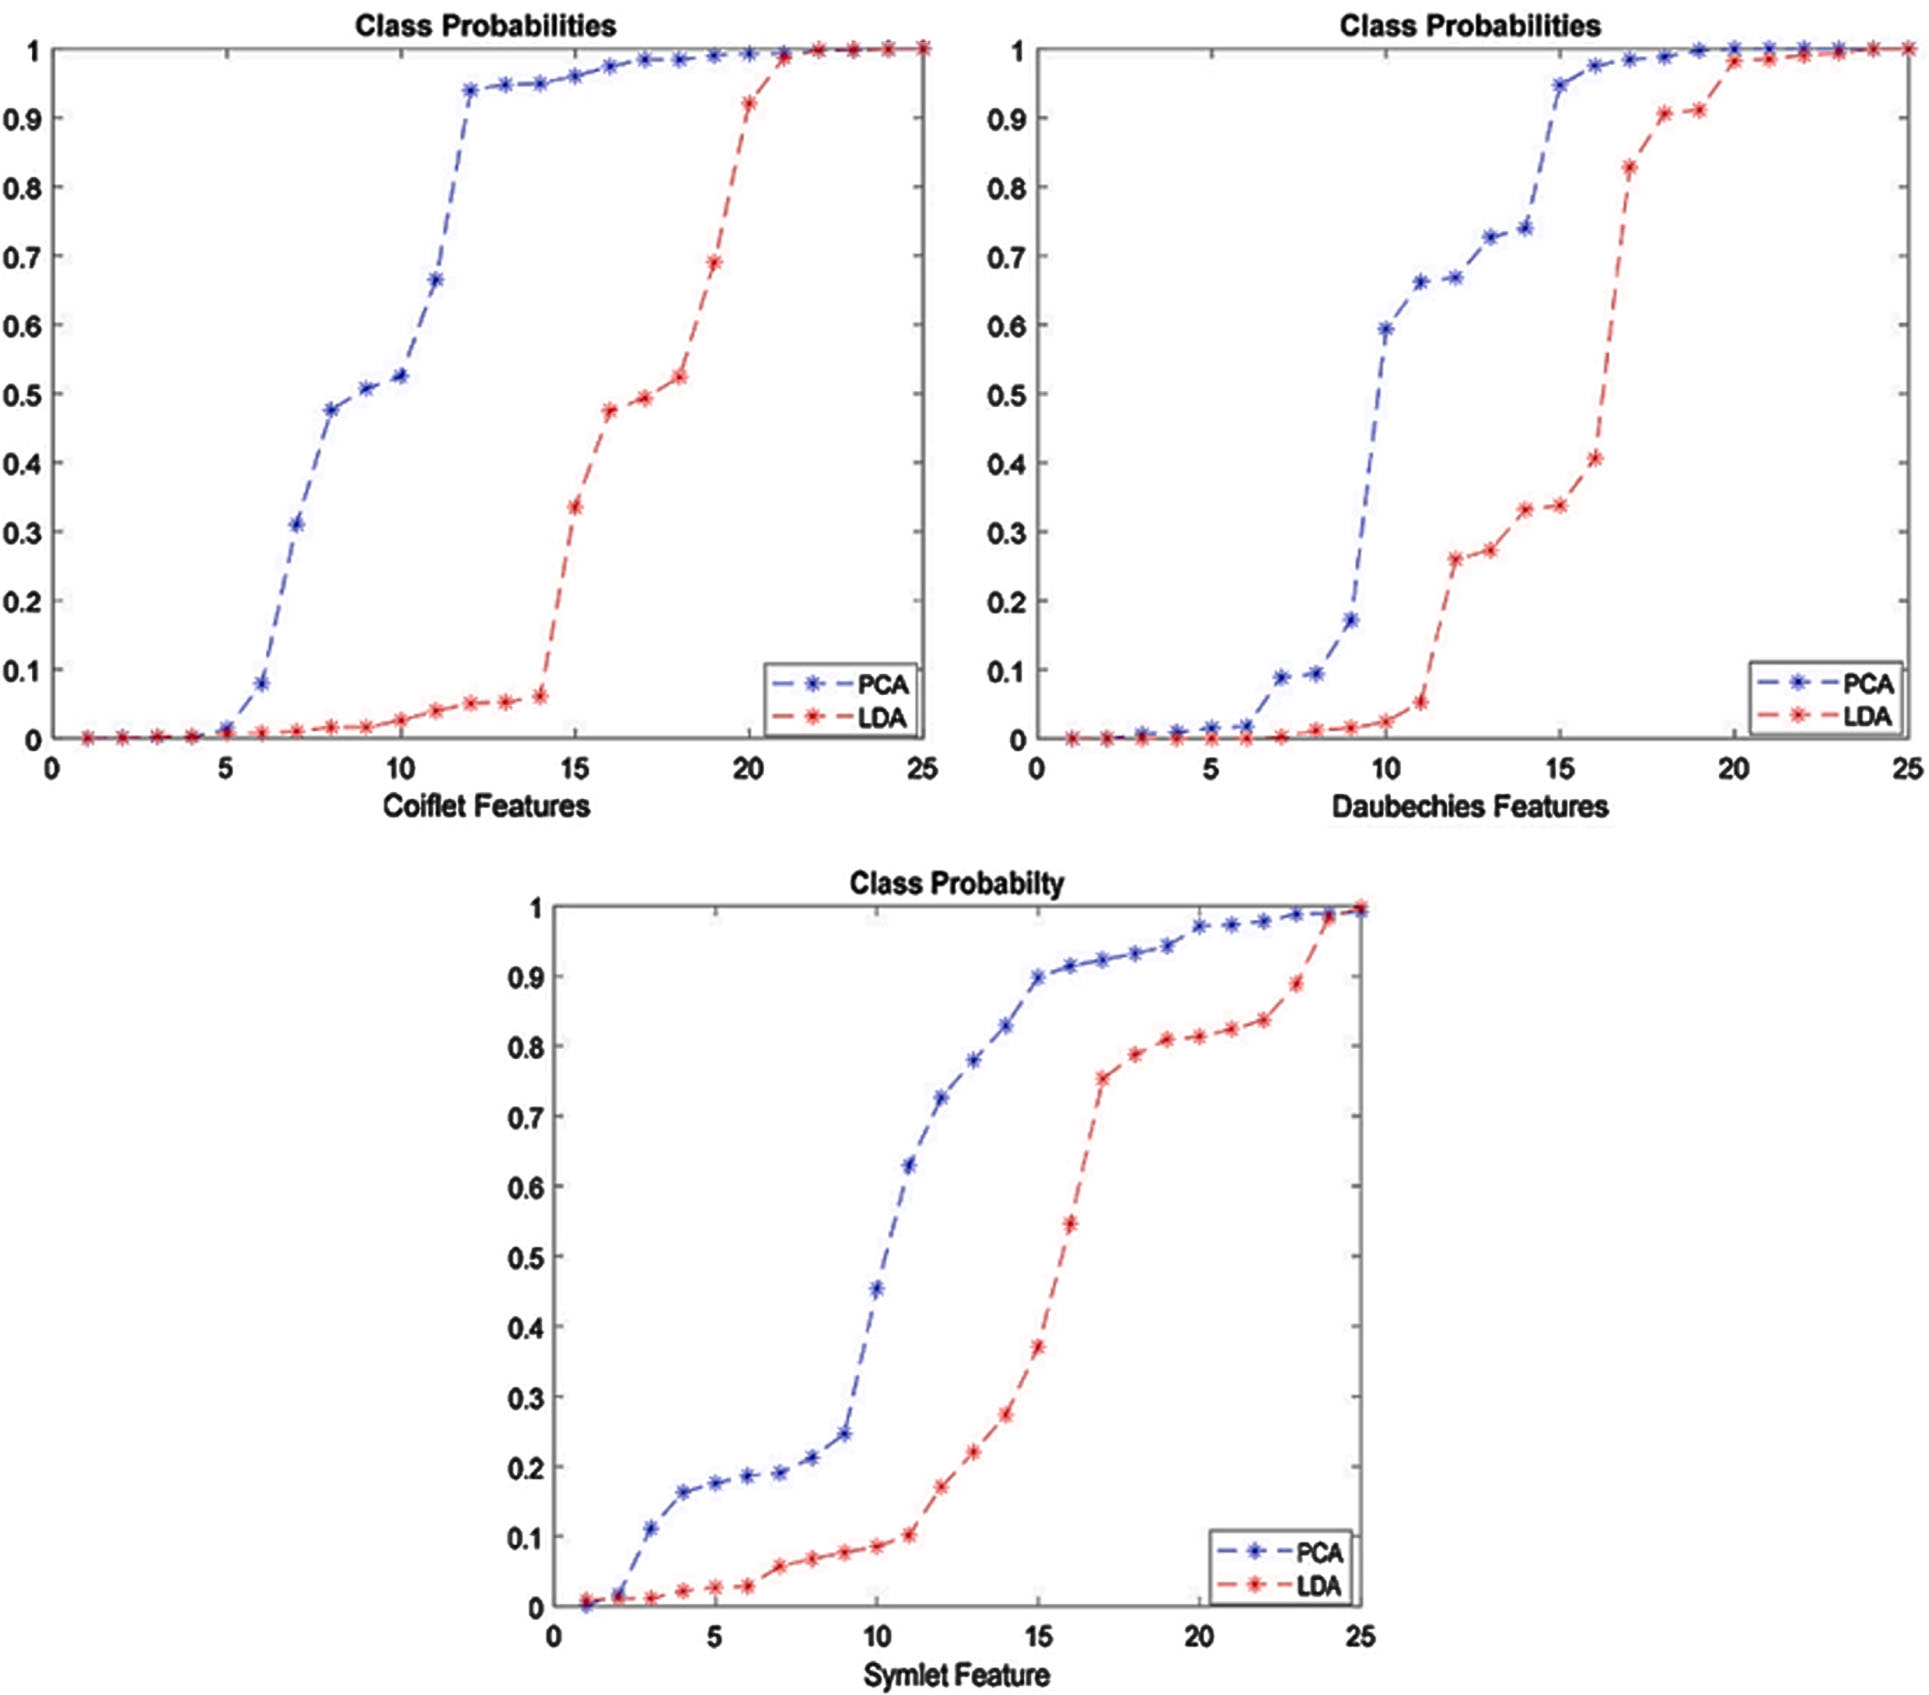
Probabilities of different classes after PCA and LDA is applied.
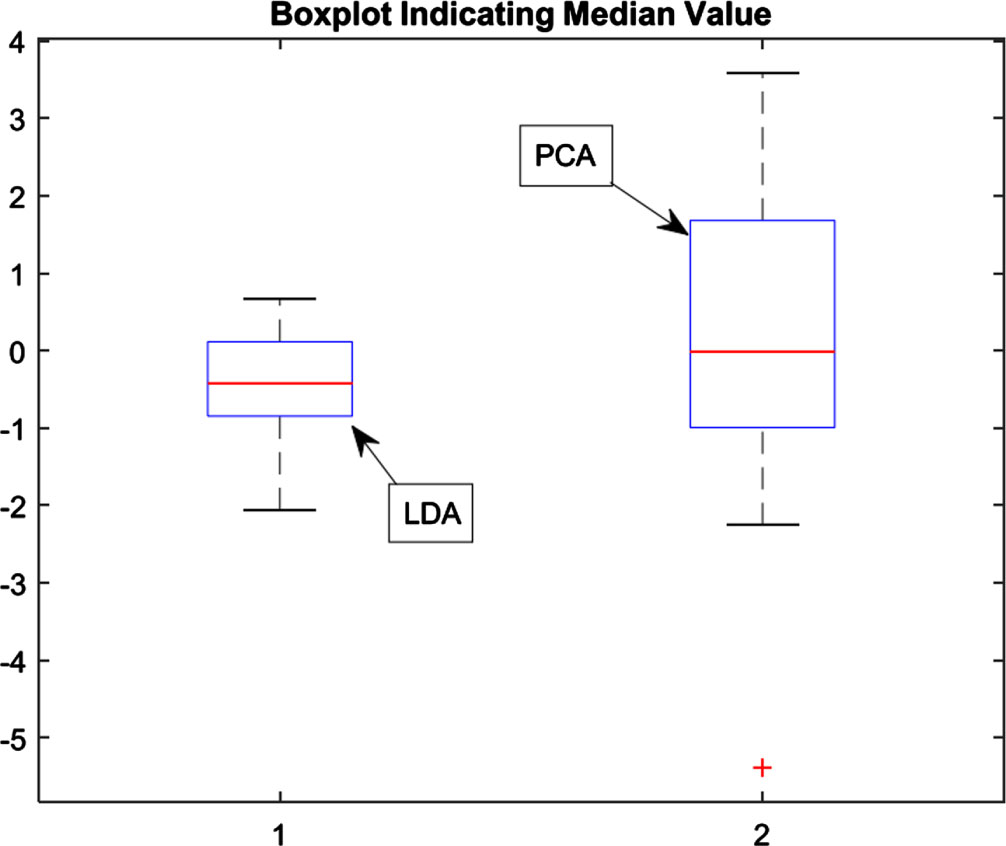
Boxplot representation after PCA and LDA is applied.
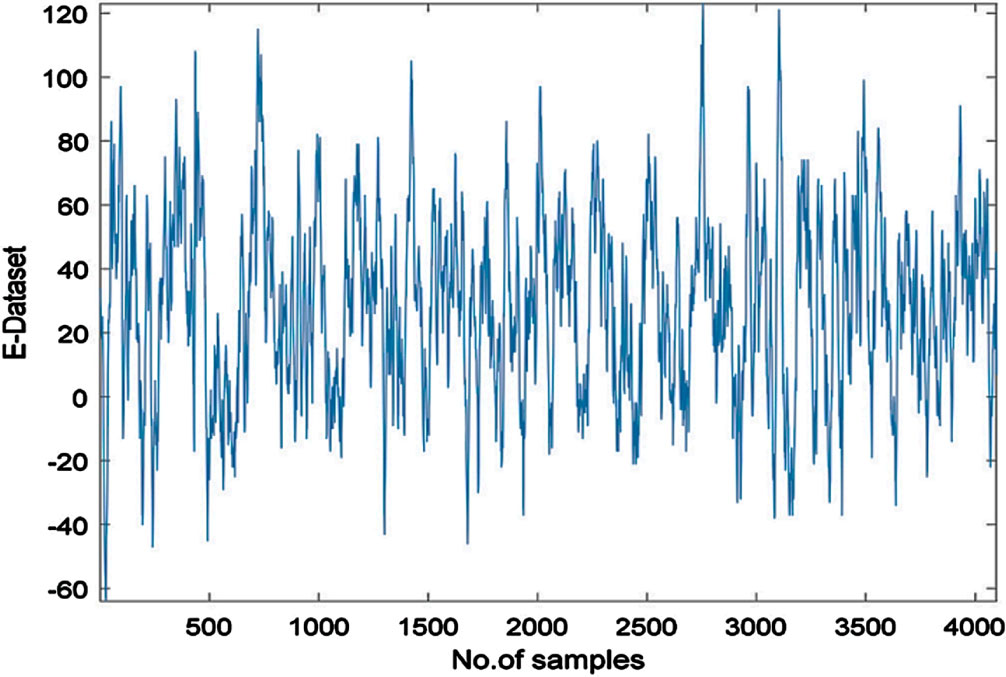
Representation of Seizure EEG signal over E-Subset.
Although Sparse Extreme Learning Machine (SELM) training is analogous to that of Support Vector Machine (SVM), it would be simpler to implement due to the reduced number of constraints and the fact that only a single Lagrange variable needs to be modified at each training iteration. It can be written as a quadratic problem as follows, Minimize:
Subject to: 0 ≤ θ r ≤ C, r = 1, …, N,
Where N is the number of training samples, θ r is the Lagrange multiplier, t r ∈ { ± 1 } is the associated class label, and C is a predefined regularization constant. k (x r , x s ) is kernel function that is used for nonlinear classification, and the kernel functions could be,
Gaussian kernel is
Laplacian kernel is
Polynomial kernel is
The training algorithm of the SELM is summarized as follows.
Since only one Lagrange multiplier needs to be updated in each iteration, choosing the updated θ
c
is vital. The index c of the updated θ
c
in each iteration is determined according to
Where J
r
= g
r
· d
r
, g
r
= (∂/∂θ
r
) L
d
denotes the gradient of L
d
, and d
r
indicates the way in which θ
r
should be updated, expressed as follows:
The corresponding Lagrange variable θc is updated as follows:
The unconstrained point must be checked to ensure that it is in the feasible range [0, C], and the new clipped function can be written as follows:
After updating θ
c
, g
r
(r = 1, 2, …, N) is updated as follows:
Based on the updated values of g r and d r , J r ‘s (r =1, 2, …, N) are updated according to the definition.
Repeat the above iteration until
When the training stage is finished and the parameters are determined, we can classify a new object x with
The ABO approach illustrates the three distinct behaviors that are characteristic of African buffalos by mimicking the way in which they look for grasslands. First, buffaloes have a large memory capacity, which enables them to keep track of their travels over thousands of kilometers over the African continent. In addition to this, buffaloes are quite helpful to one another. They are merely representatives of animal species, each of which puts its own life at jeopardy in order to safeguard one of its own risks. The second characteristic of buffaloes is their ability to communicate cooperatively, which can be interpreted as a sign of better or worse times. Their tremendous intelligence is only one of the three distinguishing features of buffalos. The buffalo herd can hold a “election” to determine the next course of action when members make conflicting calls. According to the three characteristics, African buffalos are the most well-organized and productive herbivores in the history of the world. The most important aspects of population-based algorithms are to the way in which individuals work together to share information with one another in order to coordinate the many methods of exploitation and exploration that are involved. The ABO algorithm divides cooperative behavior among the individuals of a herd into two categories, based on the sounds most fundamental to human communication: - The term “waaa,” which stands for “move and explore,” refers to the requirement that the location be changed owing to the presence of a particular risk or that exploration of alternative regions be undertaken due to the low resource levels observed at the new site. - The’maaa’ strategy, which translates to “stay and exploit,” enables herd members to continue occupying their place (the location they were given) while also taking advantage of the resources already there. The African Buffalo Optimization algorithm, in essence, models the three main traits of the African Buffalo that have already been mentioned. The m k symbol stands for the buffalo k sound “maaa,” and the w k symbol stands for the “waaa” sound.
The steps of African Buffalo Optimization are given as follows:
Exploration and exploitation of k th buffalo (k = 1,2, ... ,n) is represented by w k and m k respectively. L1 and L2 are the learning factors. b maxk and c maxk herd’s best and individual best respectively,
In order to get the best weights for the Sparse Extreme Learning Machine method, the African Buffalo Optimization algorithm (ABO) is used throughout the study. The hybrid algorithm that is developed improves the accuracy of both the exploration (diversification) and exploitation (intensification) phases. When looking for the best possible answer during the exploitation phase, a broader search is conducted. During this phase of the search process, the goal is to exhaustively search all possible spaces by first looking in all possible places that have not yet been recognized. In the ABO algorithm’s 1exploitation phase, the best buffalo stands for the best possible solution at the moment, when several options are being explored. The most productive buffalo, as well as the most productive position in relation to every buffalo, serve as guiding points that direct the herd toward alternative, more productive areas. Updates to the location are based on both the individual buffalo’s current position and the herd’s optimal location. The rate of exploitation is calculated with Equation (14). If the optimal herd location shifts the x value used to establish a time window for relocating buffalos, this can be done during the exploration phase. As a result, the remaining buffalos adjust their positioning to mimic the most productive strategy. The rate of exploitation is calculated using Equation (18).
As can be seen in Fig. 6 the operation commences with the generation of initial weights by the original Sparse ELM classification model, which are done so in a random fashion. Following the Sparse ELM algorithm’s determination of the suitable weights wij, the values from the input data are multiplied by those weights, and the resulting products are then sent on to the pattern layer. The latter are transformed into a summation layer as well as an output layer by means of a transfer function. The output layer is the final layer, and it almost never has more than one class because most of the time, only one particular output is requested. During the training phase, the objective is to determine the weights that should be attached to the connector line with the highest degree of precision. In addition, the output is computed multiple times throughout the training, and the results are compared to the desired output that is produced by the training and testing datasets.
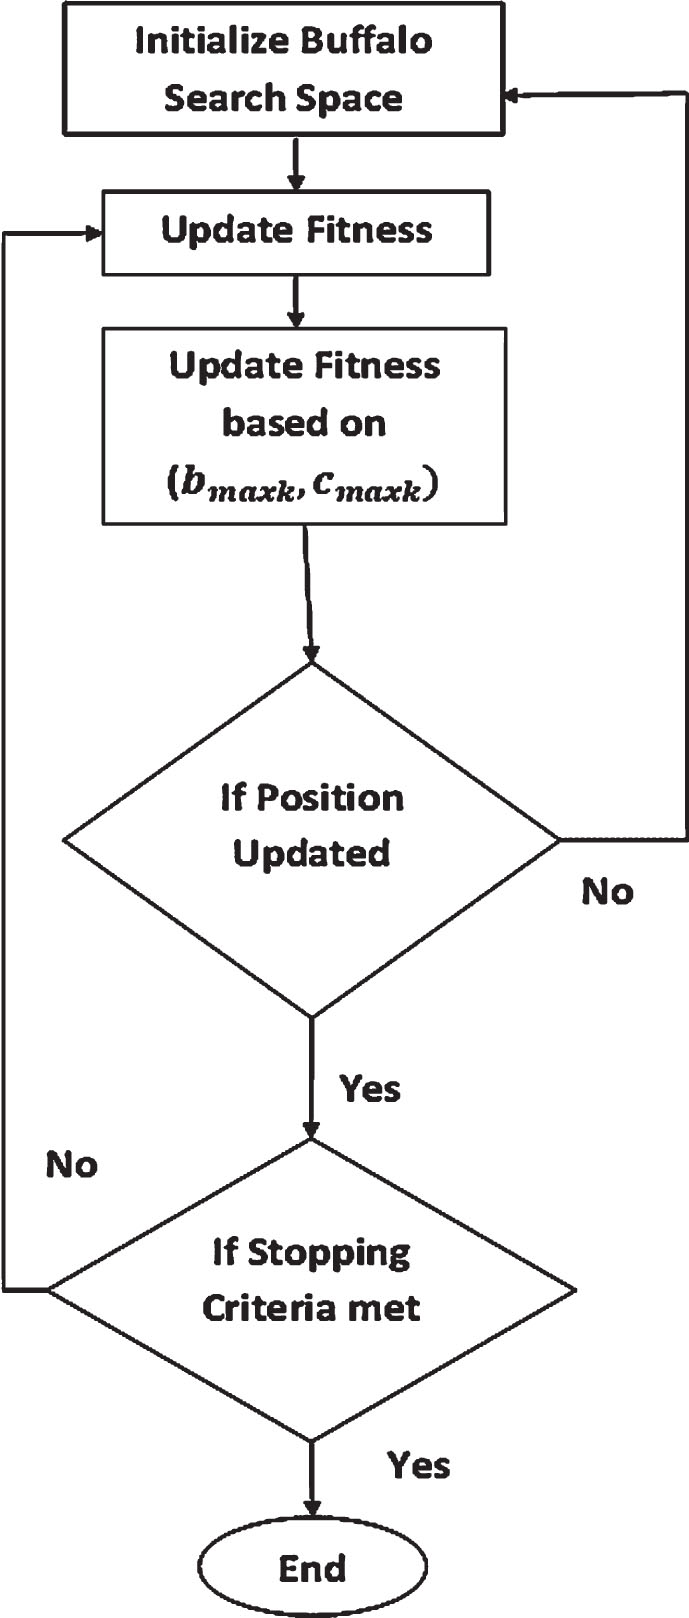
African buffalo optimization algorithm.
In this section, the effectiveness of the proposed method and the experimentation done for evaluation is discussed. The experimentation is done with respect to the proposed Hybrid Sparse Extreme Learning Machine, Extreme Learning Machine and Support Vector Machine. The experimentation is carried out on a computer with 3.20 GHz, quad-core processor, 8GB RAM and runs on Windows 10 Operating System. The epileptic seizure dataset that was used in this paper came from Bonn University and can be located on the website for the UCI Machine Repository. This dataset has five classes, numbered 1 through 5, each consisting of 100 signals and having a duration of 23.6 seconds.
Classes 5 and 4 were collected from five healthy human beings, two of whom had their eyes closed while the other two had their eyes open. The data for the remaining three classes—classes 3, 2, and 1—came from a total of five epileptic individuals. When there was no epileptic seizure present, both class 3 and class 2 seizures were recorded (the class 3 were recorded from pre-seizure hippocampal contralateral hemisphere and the class 2, was obtained from epileptogenic region of patient.) And a recording of class 1 was made. An analog-to-digital converter with 12 bits of resolution is used in conjunction with a 128-channel system to collect all of the EEG signals at a sampling rate of 173.61 hertz. The dataset has 11,500 different samples as in Table 1, each of which has 178 characteristics, and they are all organized in a systematic way. In classes 2, 3, 4, and 5, there is not a single patient who has ever experienced an epileptic fit. In this experimental inquiry, we looked at two cases. The first type of classification is binary classification, and the second is multilabel classification. People in class 1 were the only ones who had epileptic seizures. As a consequence of this, our analysis will be a binary structure for both instances of epileptic seizure and cases of non-epileptic seizure, with classes 2,3,4,5. Sample EEG signal is shown in Fig. 7.
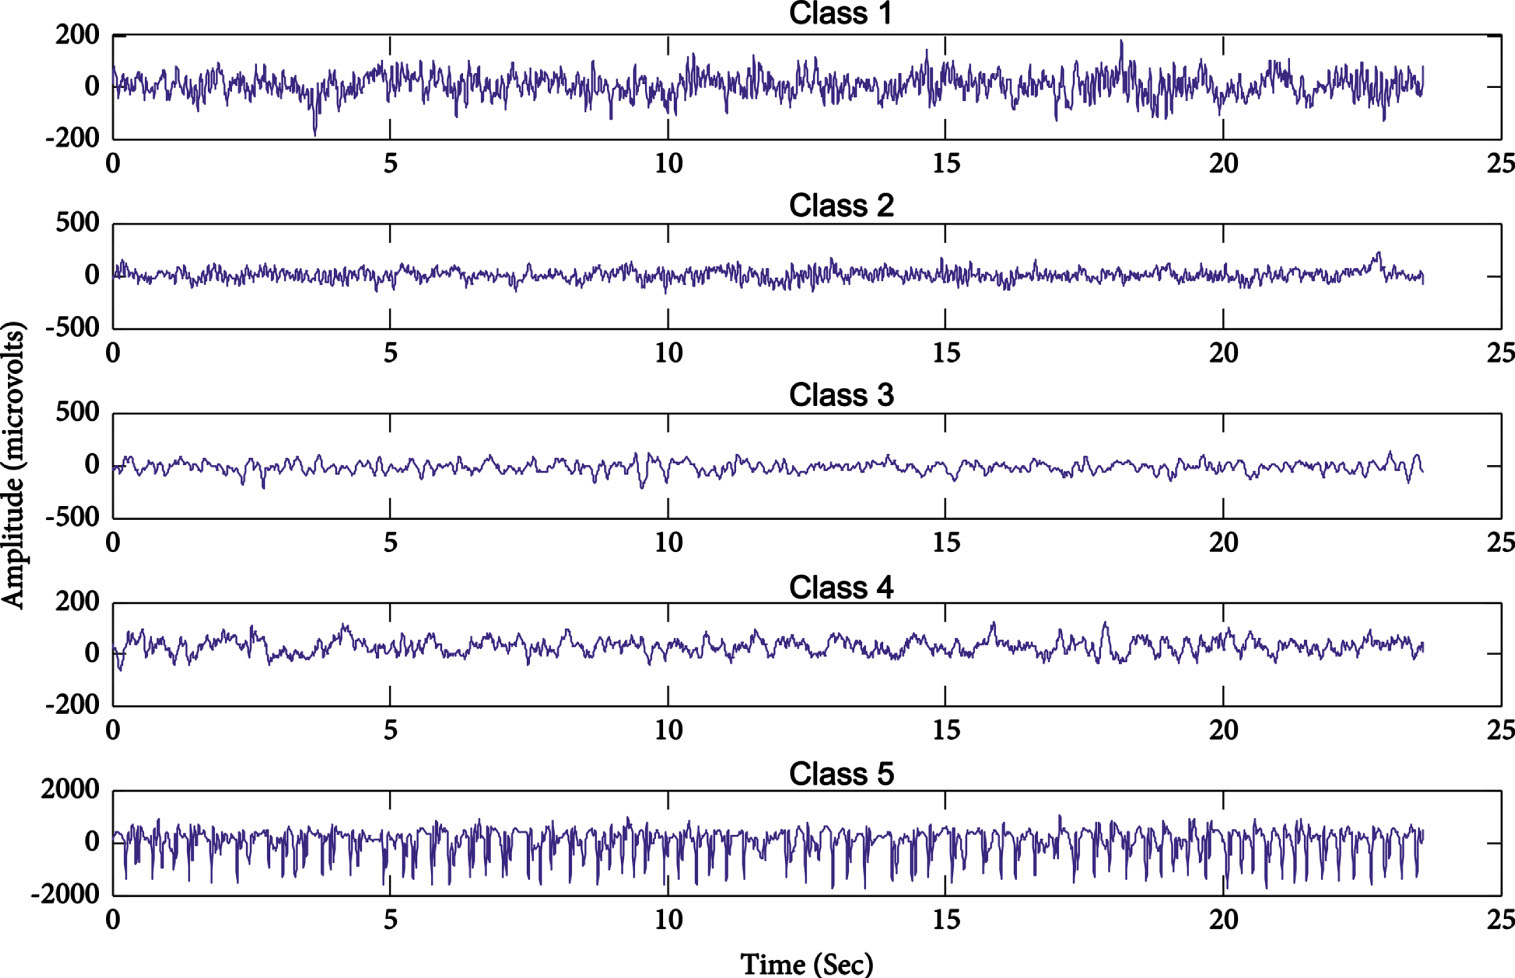
Sample EEG signals.
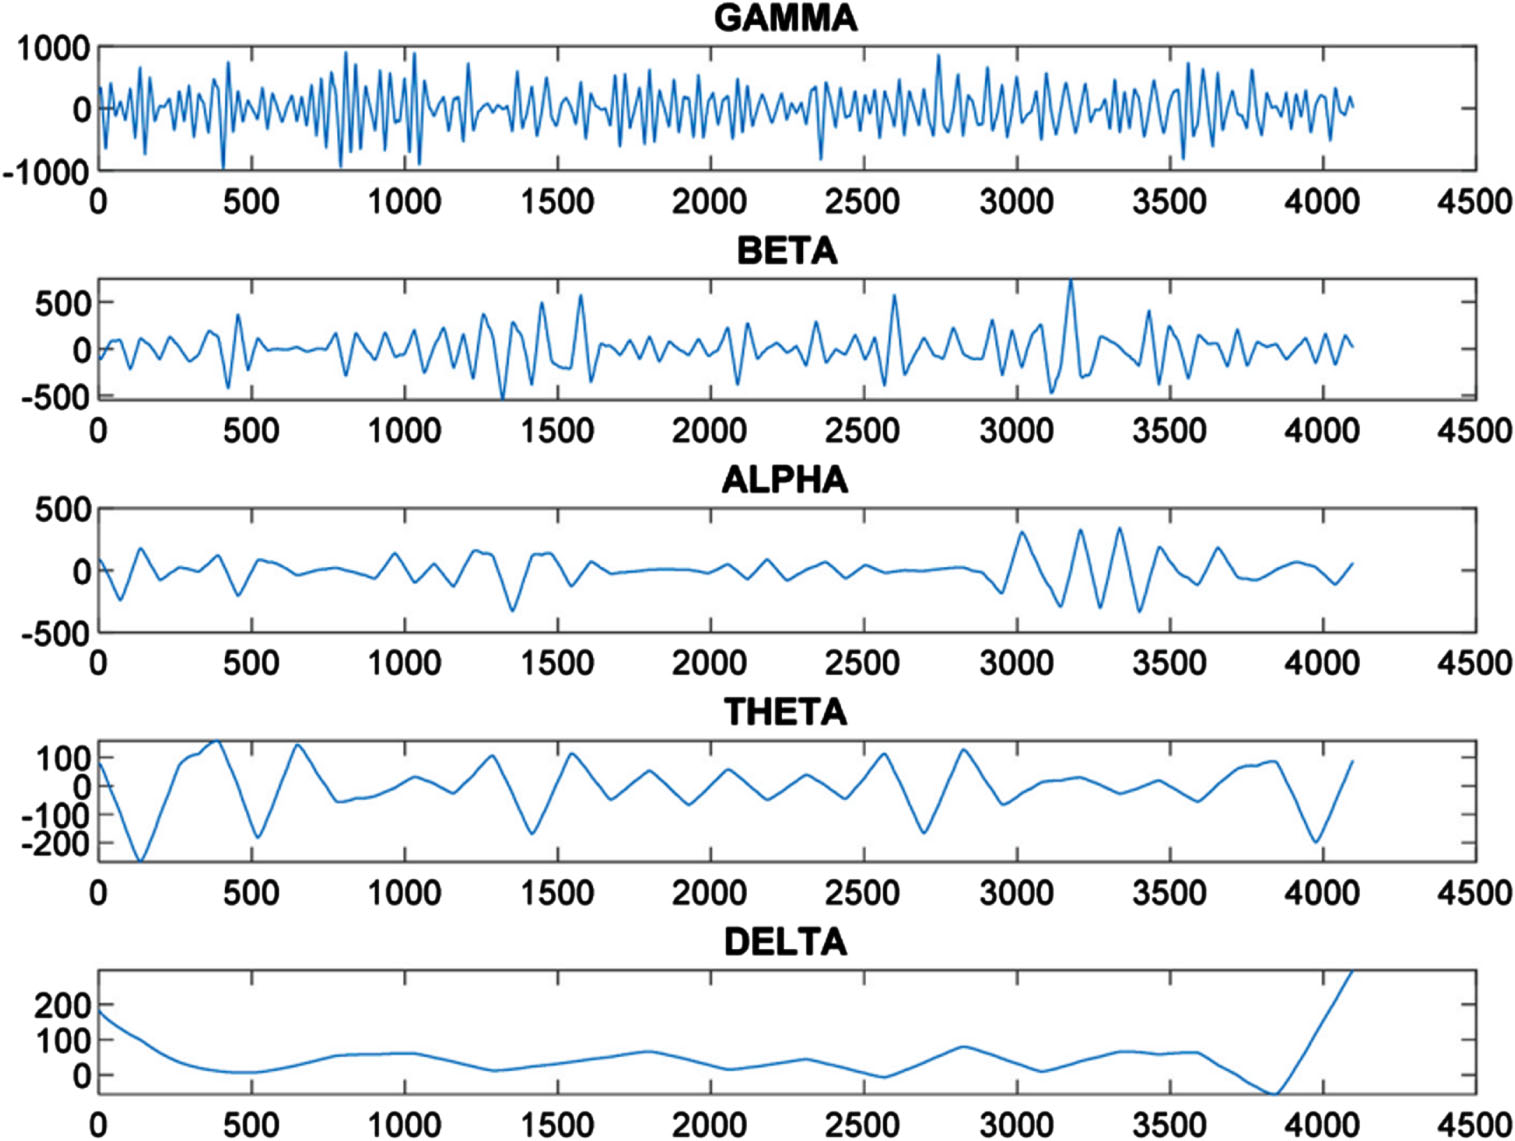
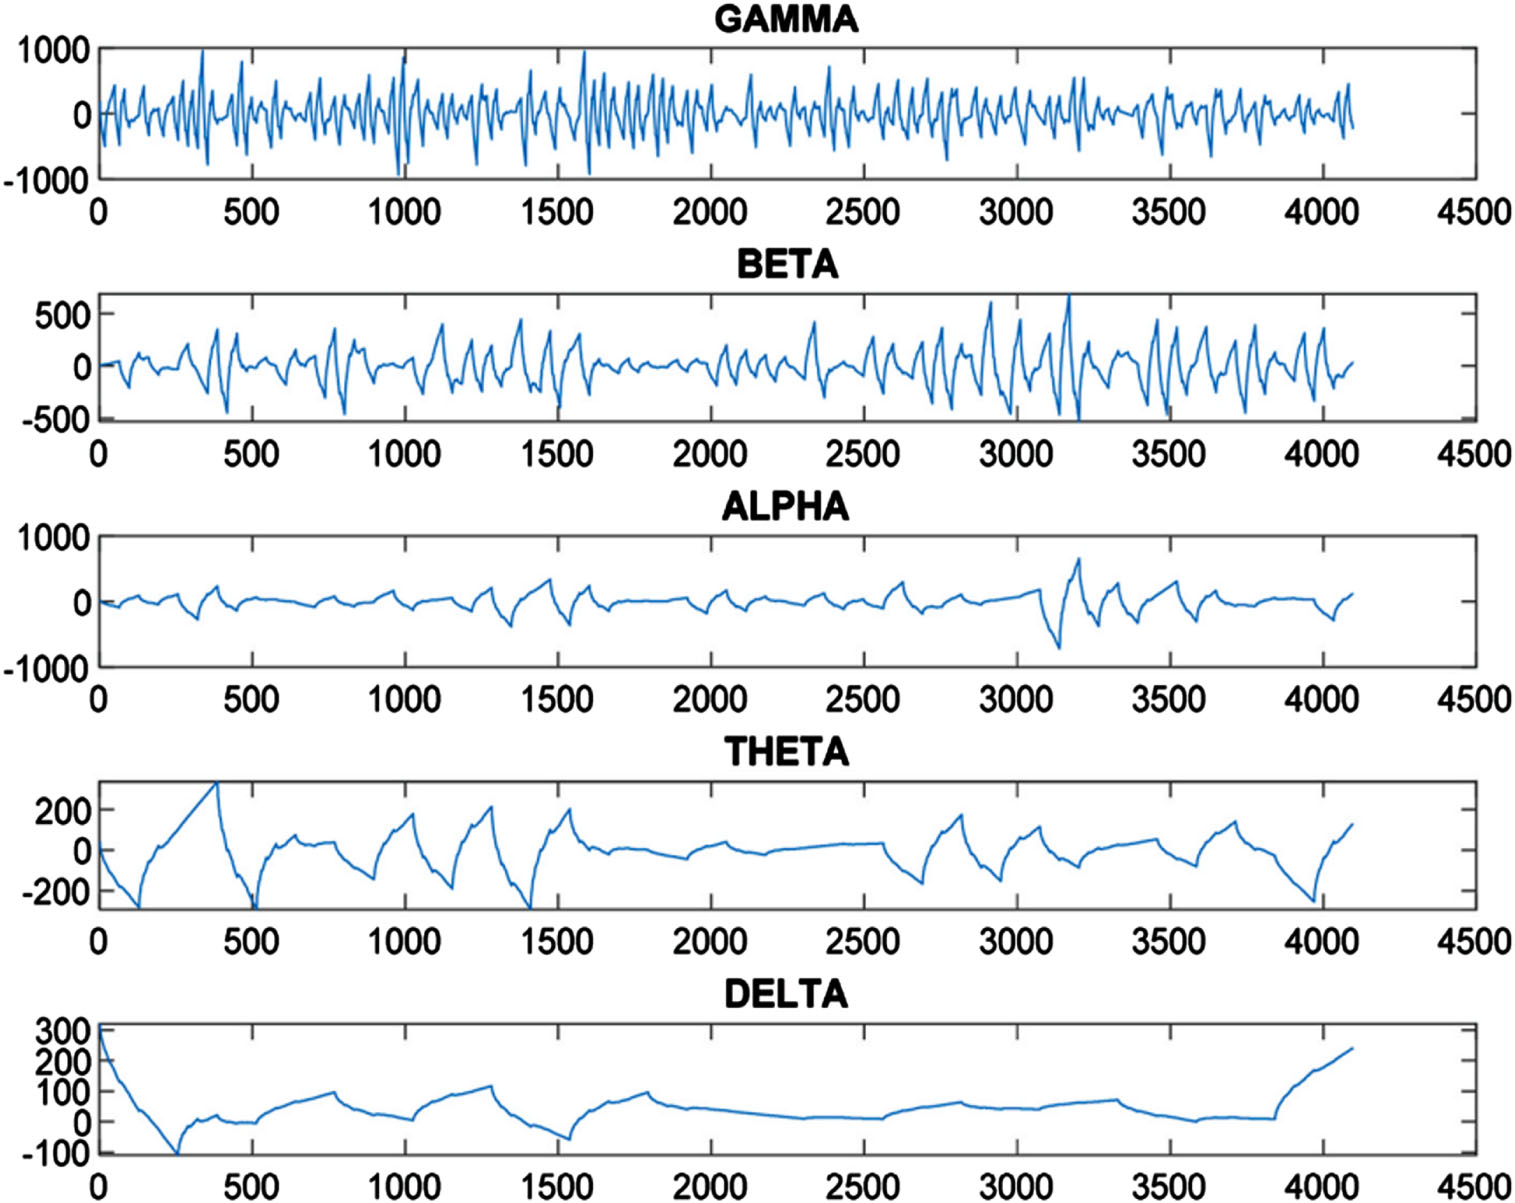
Figure 5 depicts an EEG signal used in seizure detection known as E-Subset data that contains 4093 data points as seen in Figs. 8 and 9 respectively. Coiflet wavelet decomposition results, showing Alpha component which highlights seizure region prominently represented through Alpha component; Symlet wavelet decomposition shows similarly prominent seizure area represented through Theta component and vice versa. Figure 10 provides us with an in-depth exploration of the levels of decomposition achieved with Daubechies Wavelet decomposition, which include Gamma Alpha, Beta Alpha, Theta and Delta levels with distinct frequency ranges; Gamma has the highest frequency recorded at 106.00 dollars while Beta and Alpha each had 44.00 Hz for Beta 44.00 Hz for Alpha 13.00 Theta 13.00 Hz with 7.00 Hz of Delta and 13.00 Theta dissolution respectively. The data set was then refined, leading to an aggregate total of 3000 data feature points derived from six features derived in each subset of data. Testing and training sets were divided up accordingly with over 80% allocated for training use while 20% dedicated for testing purposes. To ensure a comprehensive model evaluation, over 500 repetitions of training and testing the methodology used to evaluate it have been undertaken to establish its efficacy and performance.
Breakdown of EEG signal (Coiflet wavelet).
Breakdown of EEG signal (Symlet wavelet).
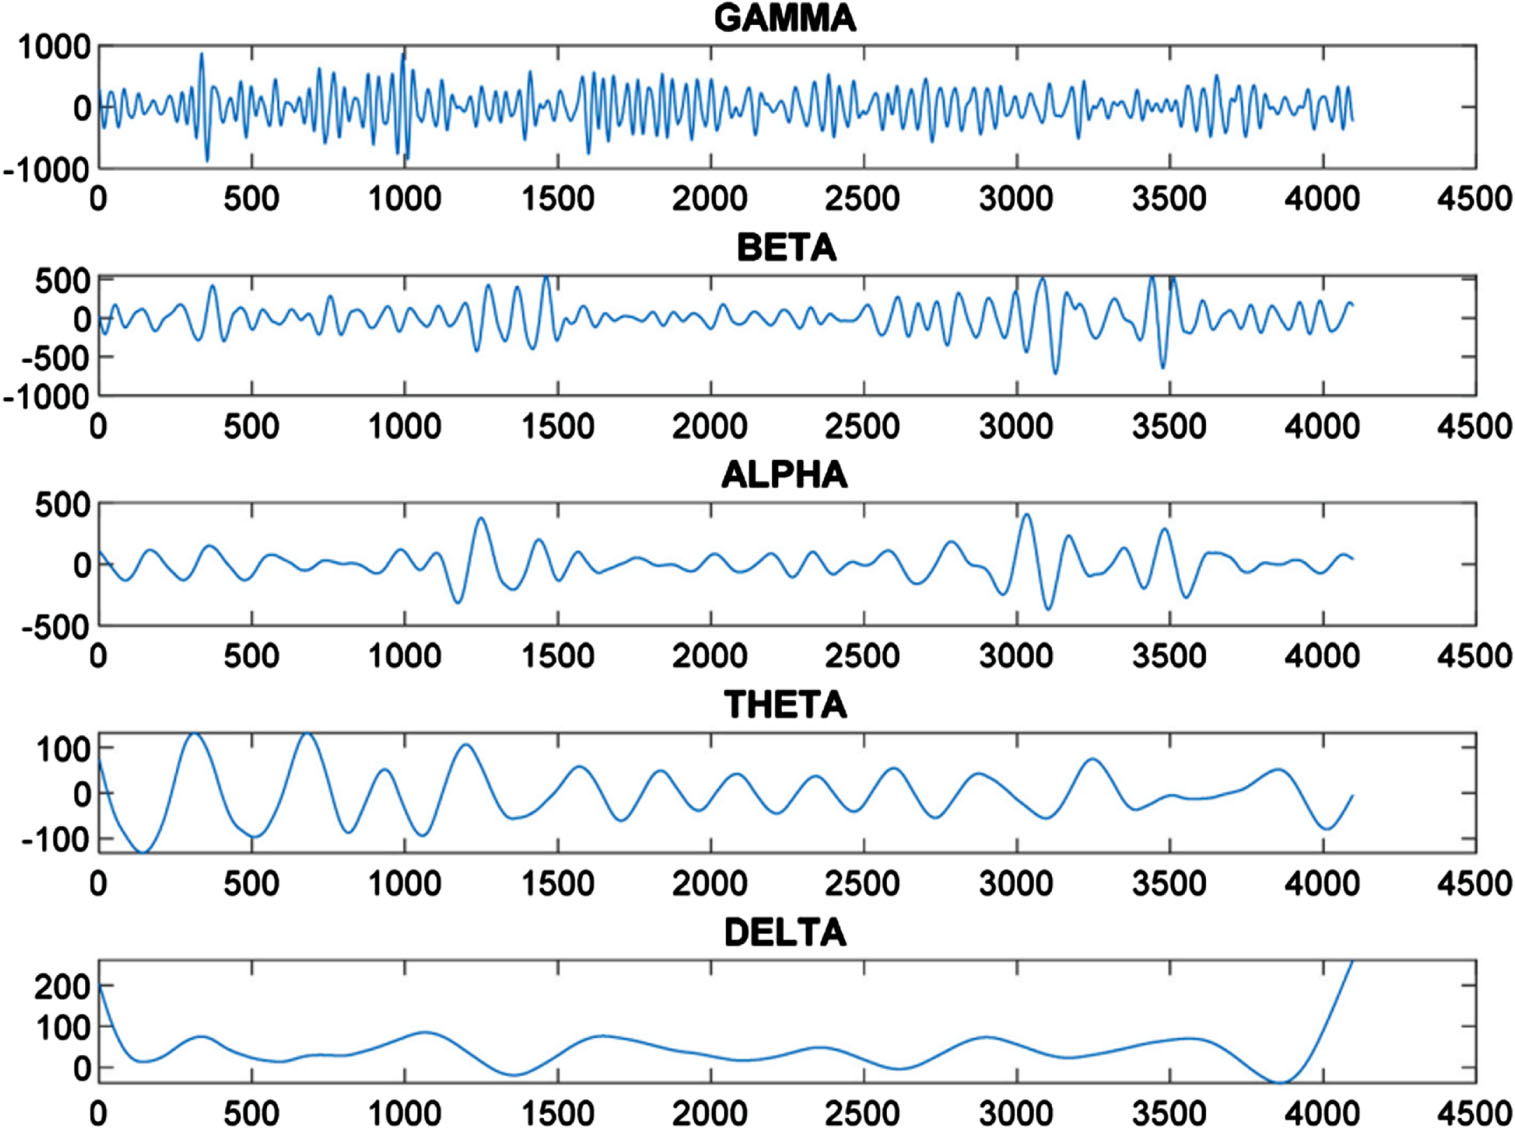
Breakdown of EEG signal (Daubechies wavelet).
The performance is evaluated in terms of six parameters namely (i)Prediction Accuracy, (ii) Sensitivity, (iii) Specificity, (iv) Precision, (v) Recall and (vi) F-score. Prediction accuracy is defined as the percentage of appropriate detection of epilepsy and non-epilepsy. It is the ratio between the sum of True Positive and True Negative indications against the sum of the True Positive, True Negative, False Positive and False Negative components.
A True Positive is the number of cases which are predicted correctly, False Negative is the number of epilepsy predictions that are not epilepsy cases, False Positive is the number of non-epileptic cases that are predicted to be epileptic cases and True negative is the true non-epileptic cases predicted. Sensitivity is the percentage of appropriate detection of epilepsy. Sensitivity is the ratio between the True Positive and the sum of True Positive and False Negative detections. Specificity is the percentage of appropriate detection of non-epilepsy. Specificity is the ratio between the True Negative and sum of True Negative and False Positive values. F-score is the ratio between the weighted average of positive prediction value and sensitivity. The method performs well as the F-score increases and degrades as the F-score decreases. The number of hidden layers and nodes play a vital role in the efficiency of any neural network. Hence it is a critical factor that determines the success of implementation. The total number of nodes that are made available in the hidden layer is 920, since the network deals with 920 input rows, which contains different parameters pertaining to each row. The Sigmoid function is used as the activation function. The conclusive results are tabulated in Table 1. From Tables 2 and 3, it is evident that the proposed hybrid model produces better results compared to that of the prevalent ELM, Sparse ELM and SVM classifiers. It is clearly visible that the proposed technique is appropriate for the classification of epilepsy cases and it is much faster compared to SVM and better in accuracy compared to that of ELM.
Dataset description
Testing accuracy comparison for binary classification
Training accuracy comparison for binary classification
Figure 11 shows the training accuracy of the proposed model. Confusion Matrix of proposed method is shown in Fig. 12. In Fig. 13, a comparison of several classifier models is shown in terms of the amount of time it takes for them to complete an execution. The execution time for the proposed hybrid sparse extreme learning machine is 61.87 seconds, whereas the execution time for the ELM, Sparse ELM, and SVM is 71.18, 73.72, and 75.82 seconds respectively.
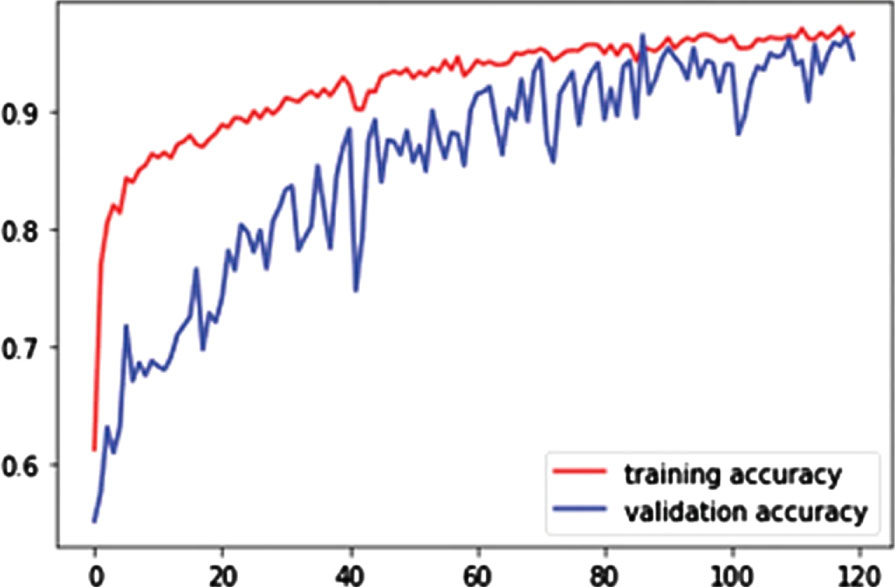
Accuracy of proposed method.
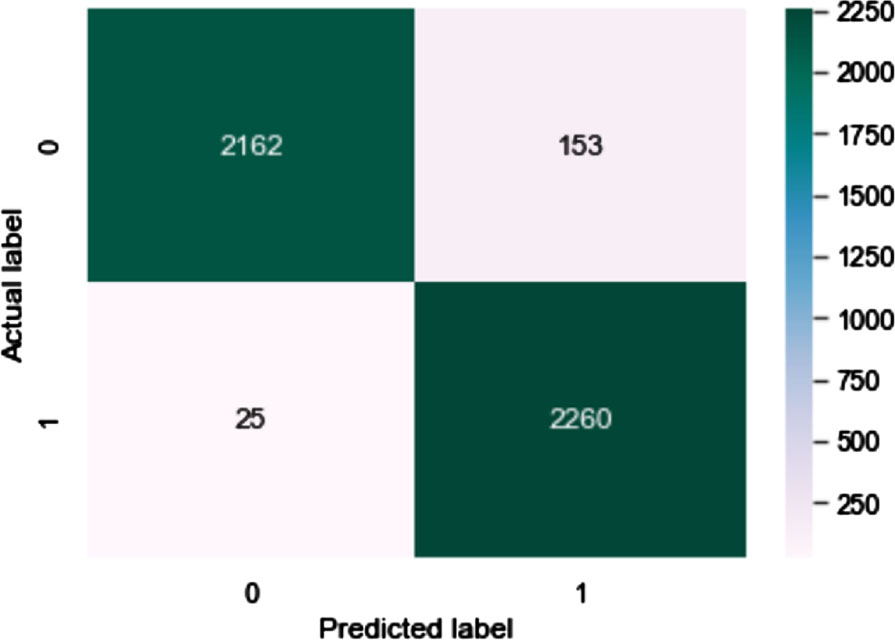
Confusion matrix.
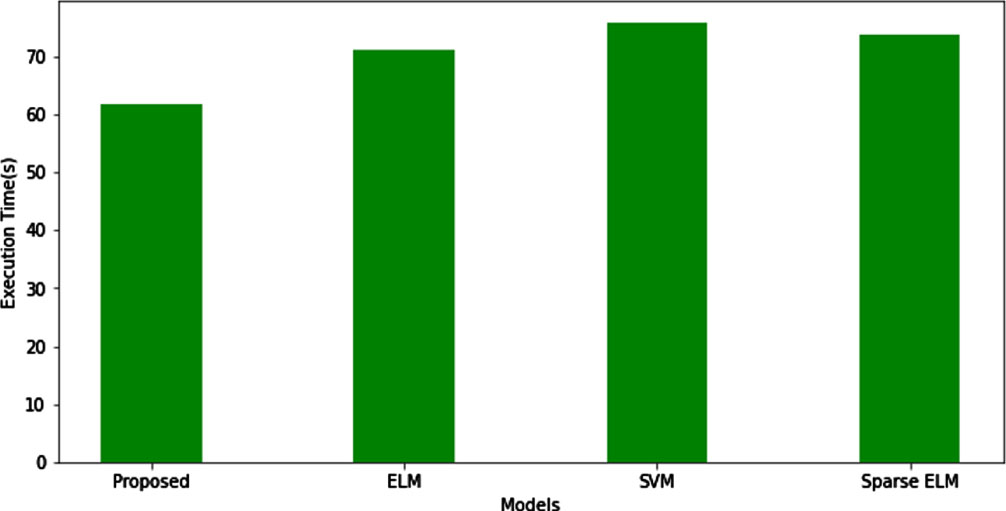
Execution time comparison.
In Fig. 14, a comparison of several classifier models is shown in accuracy. The proposed hybrid sparse extreme learning machine has the higher accuracy of 96.08%, whereas the accuracy for the ELM, Sparse ELM, and SVM is 86.9, 87.27, and 78.27 seconds respectively.
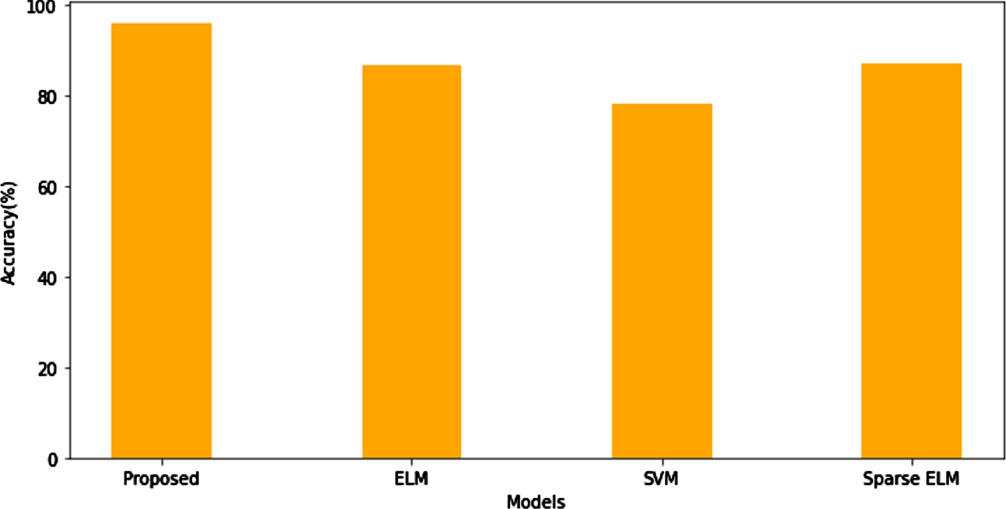
Accuracy comparison of classifiers.
The accuracy of the proposed model’s training and testing is evaluated in comparison to that of existing standard models in Tables 4 and 5. On the same dataset, we also ran models that already existed for determining standards, making sure those models were adapted for multi-label classification. It is pretty apparent that the proposed model works better (has higher accuracy) than the standard models that have been hyper-tuned in order to function on the same dataset.
Testing accuracy comparison for multi-label classification
Training accuracy comparison for multi-label classification
Table 6, Figs. 15 and 16 demonstrate that the proposed model has a higher accuracy in terms of categorization, as compared to state-of-art. It was determined, on the basis of the findings of an experiment, that the ABO algorithm had the potential to achieve both an increased accuracy rate and a faster convergence speed. When compared to the other ways that are already in use, this new method was able to improve classification accuracy while simultaneously reducing the amount of time needed to converge on a decision.
Comparison with State-of-art
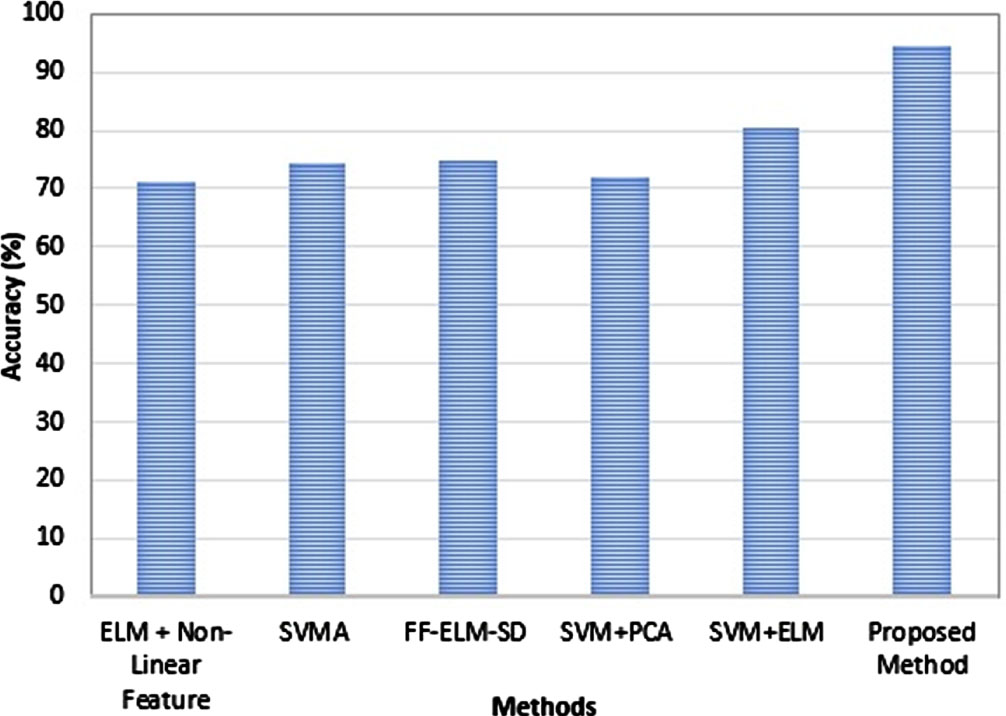
Accuracy analysis.
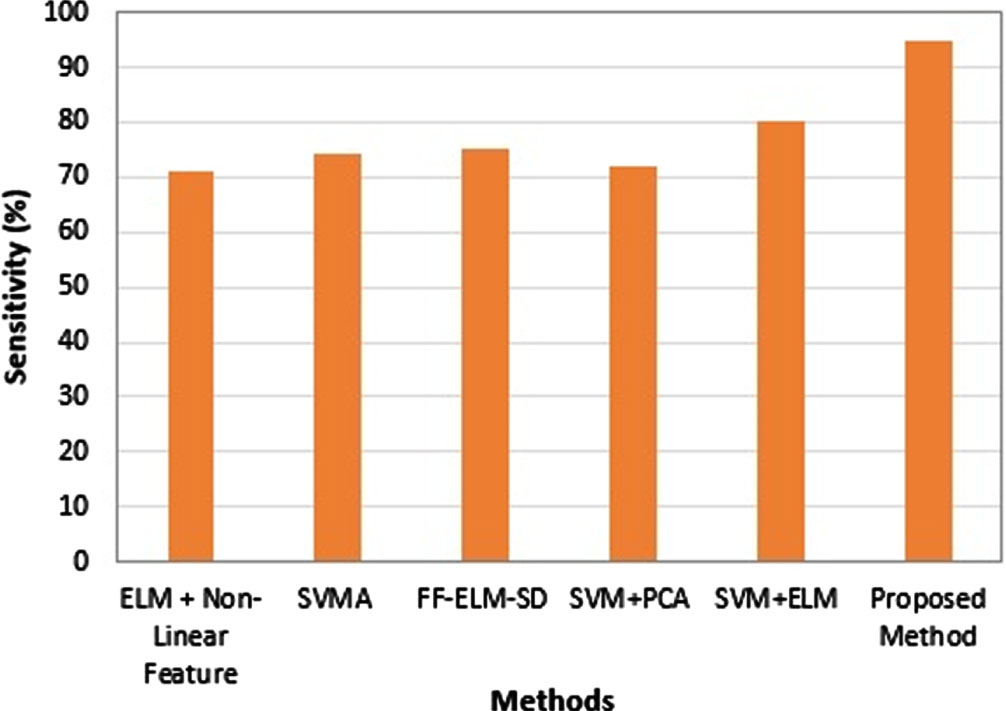
Sensitivity analysis.
The above discussion makes it abundantly evident that the suggested ABO demonstrates superior performance when compared to the existing algorithms (in terms of accuracy, sensitivity, and specificity). Due to the fact that a large number of candidates are gathered in close proximity to the best solution, the ABO possesses a strong potential of exploitation and is able to locate better solutions. On the UCI Epileptic Seizure Recognition Dataset, the method that has been proposed works very well. This conclusion can be reached due to the fact that ABO converges at a steady and rapid pace, and as a result, it can contribute to the development of superior solutions.
In this paper, an efficient and fast learning technique to accurately identify the existence of epilepsy in a particular case. The technique proves to be of high speed both in the training and testing phase compared to its predecessors namely ELM and SVM. The application of African Buffalo Optimization in Sparse Extreme Learning Machine produces reliable decisions with a minimization of error and learning speed compared to that of ELM, Sparse ELM and SVM. The experimental results demonstrate that the proposed hybridization produces significant result in epilepsy and seizure detection. The experimental results show that the proposed method outperforms SVM, Sparse ELM and ELM in terms of accuracy and running time. In future the proposed Hybrid ELM can be tested for better accuracy with different activation functions and will focus on more detailed non-linear features from EEG Signal.