
Abstract
As society evolves, companies produce more homogeneous products, shifting customers’ needs from functionality to emotions. Therefore, how quickly customers select products that meet their Kansei preferences has become a key concern. However, customer Kansei preferences vary from person to person and are ambiguous and uncertain, posing a challenge. To address this problem, this paper proposes a TF-KE-GRA-TOPSIS method that integrates triangular fuzzy Kansei engineering (TF-KE) with Grey Relational Analysis (GRA) and Technique for Order Preference by Similarity to an Ideal Solution (TOPSIS). Firstly, a Kansei evaluation system is constructed based on KE and fuzzy theory. A dynamic triangular fuzzy Kansei preference similarity decision matrix (TF-KPSDM) is defined to quantify customer satisfaction with fuzzy Kansei preferences. Secondly, dynamic objective weights are derived using Criteria Importance Though Intercrieria Correlation (CRITIC) and entropy, optimized through game theory to achieve superior combined weights. Thirdly, the GRA-TOPSIS method utilizes the TF-KPSDM and combined weights to rank products. Finally, taking the case of Kansei preference selection for electric bicycles, results indicate that the proposed method robustly avoids rank reversal and achieves greater accuracy than comparative models. This study can help companies dynamically recommend products to customers based on their Kansei preferences, increasing customer satisfaction and sales.
Keywords
Introduction
With the intensification of market competition and product iteration, manufacturers have significantly increased their investment in product development to meet customers’ changing needs [1]. As a result, more homogeneous products are being produced by companies. The sales of products, which serve as the material foundation for physical enterprises, are crucial for their survival and growth [2]. In such a scenario, companies can enhance customer satisfaction by providing product recommendations that satisfy customers’ specific needs, thus stimulating their purchase desire and driving product sales [3, 4]. Moreover, as society rapidly evolves and the market becomes saturated with homogeneous products, customers’ demands have gradually shifted from purely functional considerations to emotional appeals [5]. Meeting customers’ Kansei preferences has become vital to addressing their emotional needs.
Nonetheless, customers’ Kansei preferences are subjective, uncertain, dynamic, and vary from person to person, posing some challenges [6, 7]. Thus, how to help customers quickly select the most appropriate product for their vague perceptual preferences has become a critical issue for companies to address. Further, developing a methodology that can effectively select products based on customers’ ambiguous Kansei preferences is paramount to business and society.
The study in this paper focuses on selecting products that are perceptually preferred by customers, which is essential for product decision-making. Some researchers have proposed numerical assessment methods based on the Multi-Criteria Decision Making (MCDM) framework for direct Kansei preference decision-making [5, 8–12]. However, they only consider the cost and benefit characteristics of the perceptual metric and rank alternatives according to the numerical magnitude of the direct outcome of the customer’s judgment, ignoring the fact that the Kansei preferences of customers vary from person to person and are personalized and dynamic. That creates a gap between the ranking results and customers’ valid preferences.
To address these issues and bridge the gap, this paper proposes a dynamic decision-making approach based on the fuzzy Kansei preferences of customers. It aims to reduce ambiguities and uncertainties in the Kansei preference decision-making process and assist companies in dynamically recommending products to customers based on their Kansei preferences, enhancing customer satisfaction and ultimately driving sales. First, a Kansei profile of product alternatives is constructed by experts. The TF-KPSDM is then used to quantify customers’ satisfaction with their fuzzy Kansei product preferences. Customer satisfaction increases as the similarity between their fuzzy Kansei preferences and a product’s Kansei profile strengthens. By replacing the traditional decision matrix with TF-KPSDM, this approach can avoid the gap caused by focusing only on the metric size in traditional decision-making. Moreover, recommending products is dynamic and needs to adapt to changes in the customer’s perceptual preferences in real-time. We employ an objective weighting methodology to match the dynamic characteristics to calculate the indicator weights. Finally, it is essential to note that dynamically recommending a product involves an MCDM process. In this paper, we use GRA-TOPSIS as the basic framework and combine triangular fuzzy set and Kansei engineering (KE) to efficiently handle the dynamic ranking problem of products of customers’ fuzzy Kansei preferences in a fuzzy uncertain environment.
The remainder of this paper is structured as follows: Section 2 presents a literature review and the contributions of this study. Section 3 presents the general research framework and basic steps. In contrast, Section 4 validates the feasibility and effectiveness of the proposed approach through a case study, comparing and discussing experimental results from comparison models. Finally, in Section 5, conclusions are drawn, and topics for future research are suggested.
Literature review
The MCDM is primarily utilized for comprehensive evaluation based on multiple attributes of objects, enabling analytical decisions to be made in scenarios with incommensurability [13]. It has been widely applied to resolve decision-making problems such as plant location, strategic supplier selection [14], drinking-water quality monitoring issues [15], renewable energy location [16], water resource management [17], electric vehicle selection [18], and logistics service supply chain management [19]. Currently, researchers in the field of MCDM have utilized various methods such as VIKOR [7, 20], TOPSIS [21–29], rough distance [6], prospect theory [30], Decision-making Trial and Evaluation Laboratory (DEMATEL) [25], data envelopment analysis (DEA), and regret theory [31]. Among these methods, TOPSIS stands out due to its simplicity in computational operations and ability to produce relatively accurate and satisfactory results. Therefore, it is a widely used and effective method in MCDM research. TOPSIS can compare and rank multiple alternatives based on multiple mutually constraining criteria [32]. Nevertheless, it requires a monotonically increasing (or decreasing) utility function. The fundamental principle of TOPSIS is to rank evaluation objects by measuring their distance from the positive ideal solution (PIS) and negative ideal solution (NIS). An object is considered superior if it is closest to PIS and farthest from NIS; in contrast, it is deemed inferior. Memari et al. proposed an intuitionistic fuzzy TOPSIS method to select suitable sustainable suppliers and validated the method with actual cases [28]. They selected nine evaluation indicators, including seven benefit criteria (quality of products, service performance, environmental performance, green image, health and safety, and employment practices), which means that the bigger, the better. The two remaining indicators are cost criteria, namely price and pollution control, with smaller values preferred. To enhance the accuracy and validity of concept design evaluation, Z-TOPSIS was employed to select the optimal solution based on the z-number environment [26]. The proposed method’s feasibility and validity were validated through a case study on selecting a kitchen waste container. Shao et al. employing TOPSIS, the absolute value of five typical energy storage systems was assessed in four dimensions, namely flexibility, technicality, economy, and environment [33]. The four dimensions encompass eight benefit indicators: response time, capability, power density, energy density, energy conversion efficiency, unit power cost, cycle life, and wind power curtailment rate. Li et al. proposed a data-driven algorithm based on entropy and TOPSIS methods to evaluate the suitability potential of shallow geothermal energy [34]. Mathew et al. presented a spherically fuzzy AHP and TOPSIS method for selecting advanced manufacturing systems in an uncertain decision-making environment, considering five benefit indicators (quality of results, ease of use, competitiveness, adaptability, expandability) and one cost indicator (annual depreciation and maintenance costs) [22].
On the other hand, TOPSIS has also been applied to dynamic decision-making processes [35, 36]. Recently, a dynamically weighted TOPSIS method was proposed for identifying influential nodes in complex networks [37]. The authors determined the dynamic weights of each attribute using the GRA and Susceptible Infected Recovered (SIR) model, which overcame the limitations of single weights. A novel 2-tuple linguistic TOPSIS model was proposed by Li et al., which takes into account opinion dynamics and is validated through the supplier selection process of a Bluetooth headset manufacturer [38]. Meanwhile, Lin et al. presented a grey number TOPSIS model for dynamic ranking subcontractors combined with multi-period evaluation, where reliability, management capacity, and workforce quality are selected as benefit indicators [39]. To choose an appropriate third-party reverse logistics provider, a dynamic intuitionistic fuzzy TOPSIS method was proposed by Su et al. and its validity was verified through numerical examples [40]. Seven indicators were selected, including benefit and cost indicators. The intuitionistic fuzzy ideal solution is the maximum value for the benefit indicators (delivery, engineering capability, inability to meet future demand, willingness, and attitude) and the minimum value for the cost indicators (quality, reverse logistics cost, rejection rate).
However, as the TOPSIS method has been extensively researched, scholars have discovered that it only takes into account the Euclidean distance between indicators and fails to reflect their trends [27, 42]. Therefore, there is room for improvement in TOPSIS. Grey Relational Analysis (GRA) is a decision-making method that systematically analyses incomplete information from a comprehensive perspective [43]. It evaluates the proximity between schemes and ideal solutions by comparing the similarity of change trends among each index’s data. Then it ranks them based on their degree of grey correlation. The GRA method can effectively reflect the internal change trend of each scheme and compensate for the deficiency of TOPSIS [44, 45]. Therefore, some extension methods of TOPSIS have been proposed. For instance, Sakthivel et al introduced the GAR-TOPSIS method by integrating GRA with TOPSIS [27]. The GRA-TOPSIS method not only considers the object’s location distance but also fully considers the correlation between the indicators [24]. Therefore, its closeness combines grey correlation and Euclidean distance. Chen utilized a combination of intuitionistic fuzzy TOPSIS and GRA methods to select sustainable suppliers of building materials [46]. Intuitionistic fuzzy entropy was employed to determine the weights assigned to four indicators. Among these indicators, three are benefit criteria where higher values indicated superior performance (business credit, technical capability, and quality level). Conversely, lower values are preferable for the remaining cost criterion (price).
In summary, the evaluation criteria in TOPSIS and its extension methods are mainly benefit and cost criteria. However, regarding human perceptions of products, i.e., the process of human perceptual evaluation, people are only concerned with whether the perceived indicators of products meet their preferences, not with the magnitude of specific values [47]. The more similar the product’s perceptual indicators are to the customer’s perceptual preferences for that product, the higher the customer’s satisfaction with it, and vice versa [48]. Moreover, TOPSIS and its extensions cannot be directly applied to rank products of customer’s perceptual preferences due to the significant disparity between the benefit and cost indicators and perceptual indicators. KE is a widely utilized scientific approach for addressing the perceptual assessment of products [49]. However, people’s preferences for perceptual indicators of products involve human perceptual interpretations that are somewhat ambiguous and uncertain [5, 12]. Fuzzy theory, initially proposed by Professor Zadeh, is an effective method for handling uncertainty problems in a fuzzy environment [50, 51]. Researchers integrated fuzzy theory and KE to evaluate samples based on perceptual adjectives without measuring the degree of customer satisfaction with perceived preferences for products [52–54]. However, in this paper, fuzzy theory and KE are combined to determine the degree of customer satisfaction with perceptual indicators for products, thereby transforming them into benefit indicators. So TOPSIS and its extensions can be utilized to rank products of customers’ perceptual preferences. Additionally, GRA-TOPSIS can effectively measure the uncertainty between objects and rankings [47]. Therefore, this paper integrates GRA-TOPSIS, fuzzy theory, and KE to rank products according to customers’ perceptual preferences.
Determining the weights of indicators is a pivotal aspect of MCDM. Once these weights are determined, alternatives can be prioritized based on their performance across all criteria. However, this study aims to rank alternatives according to the extent to which the customer’s fuzzy Kansei preference for the product perceptual indicators is realized. Due to individual customers’ varying fuzzy Kansei preferences, the decision-making process is dynamic. Therefore, choosing an appropriate weighting algorithm is paramount in this paper. The objective weighting algorithm is a method of determining weights by calculating the amount of information contained in each indicator based on the raw data of the evaluation [36]. As such, it enables the accurate computation of metric weights from dynamic customer preference raw data. Entropy and CRITIC are widely used as practical algorithms for objectively calculating indicator weights [6, 55]. Although entropy and CRITIC are commonly used to determine objective weights, they have limitations [24]. The single CRITIC method does not consider the dispersion between indicators, whereas entropy only considers the dispersion between indicators. Therefore, researchers have combined the two methods to address these shortcomings using simple additive or multiplicative principles [56, 57]. However, this approach can lead to conflicts among the resulting weights. Game theory is an equilibrium-based decision-making method in which multiple decision-makers compete and compromise with each other to maximize their interests [58, 59]. It effectively resolves the conflict between two weights by balancing them. [41, 47] employed game theory to optimize the combination of subjective and objective weights for resolving conflicts arising from such factors. Therefore, we employ game theory to optimize the combination of CRITIC and entropy, resulting in dynamic objective combined weights. Each customer’s fuzzy Kansei preference is assigned an individualized weight for indicators, which mitigates errors caused by a fixed weight and enhances the accuracy of product decisions based on customers’ fuzzy Kansei preferences.
Overall, Table 1 provides an overview of MCDM. While many TOPSIS and its extended MCDM methods have succeeded in ranking alternatives, few methods can rank products based on the degree to which they satisfy customers’ fuzzy Kansei preferences. Moreover, the product perception evaluation is compounded by the ambiguity and uncertainty inherent in human perception as well as the dynamic nature of customers’ perceptual preferences. Therefore, this paper integrates five methods (TF-KE, CRITIC, entropy, game theory, and GRA-TOPSIS) to construct an integrated TF-KE-GRA-TOPSIS method for dynamic ranking products of customers’ fuzzy Kansei preferences. The following are the main contributions of this paper.
A brief overview of methods, criteria types and weights, evaluation environments, and dynamics in MCDM
A brief overview of methods, criteria types and weights, evaluation environments, and dynamics in MCDM
We define a new dynamic matrix (TF-KPSDM) to describe the satisfaction with products of customers’ fuzzy Kansei preferences. The greater the similarity between customers’ fuzzy Kansei preferences and the properties of a product, the higher their satisfaction level. To extend the MCDM approach to dynamically select products based on the fuzzy Kansei preferences of customers, we innovatively replace the conventional matrix with TF-KPSDM as input for GRA-TOPSIS.
Using the dynamic TF-KPSDM as input, we integrate CRITIC, entropy, and game theory to develop a model to determine dynamic objective weights. Significantly, this combined model outperforms any individual models regarding decision accuracy.
Taking the electric bicycle as an example, we tested the consistency of the customer’s ranking and the comparison model ranking and made a Leave-One-Out (LOO) analysis. Furthermore, we selected ten additional customers to verify the accuracy of the superior model once again. The results show that the proposed method has better accuracy and robustness in this paper.
Research framework
To more accurately select the product that satisfies the customer’s fuzzy Kansei preferences from the alternatives, this study proposes an integrated TF-KE-GRA-TOPSIS approach that includes TF-KE, CRITIC, entropy, game theory, and GRA-TOPSIS. Figure 1 illustrates the proposed research framework in three parts. The first part employs KE to construct a perceptual evaluation structure for the product. The next step involves utilizing the triangle fuzzy semantic difference (TF-SD) method to acquire all experts’ fuzzy Kansei evaluation information. Subsequently, the TF-KPSDM is constructed based on customers’ fuzzy Kansei preferences and experts’ fuzzy Kansei evaluations. In the second part, we utilize the TF-KPSDM to compute indicator weights through CRITIC and entropy methods. Subsequently, game theory is employed to determine optimal combined weights for these indicators. Finally, we apply these combined weights in conjunction with the GRA-TOPSIS method. In the third stage, a weighted normalization matrix is constructed based on TF-KPSDM and the combined weights. Next, the PIS and NIS of each alternative are determined. The Euclidean distance and grey relational degree between each alternative and ideal solution are then calculated, followed by dimensionless transformation to obtain a new weighted closeness value. Finally, all alternatives are ranked in descending order according to their closeness values.
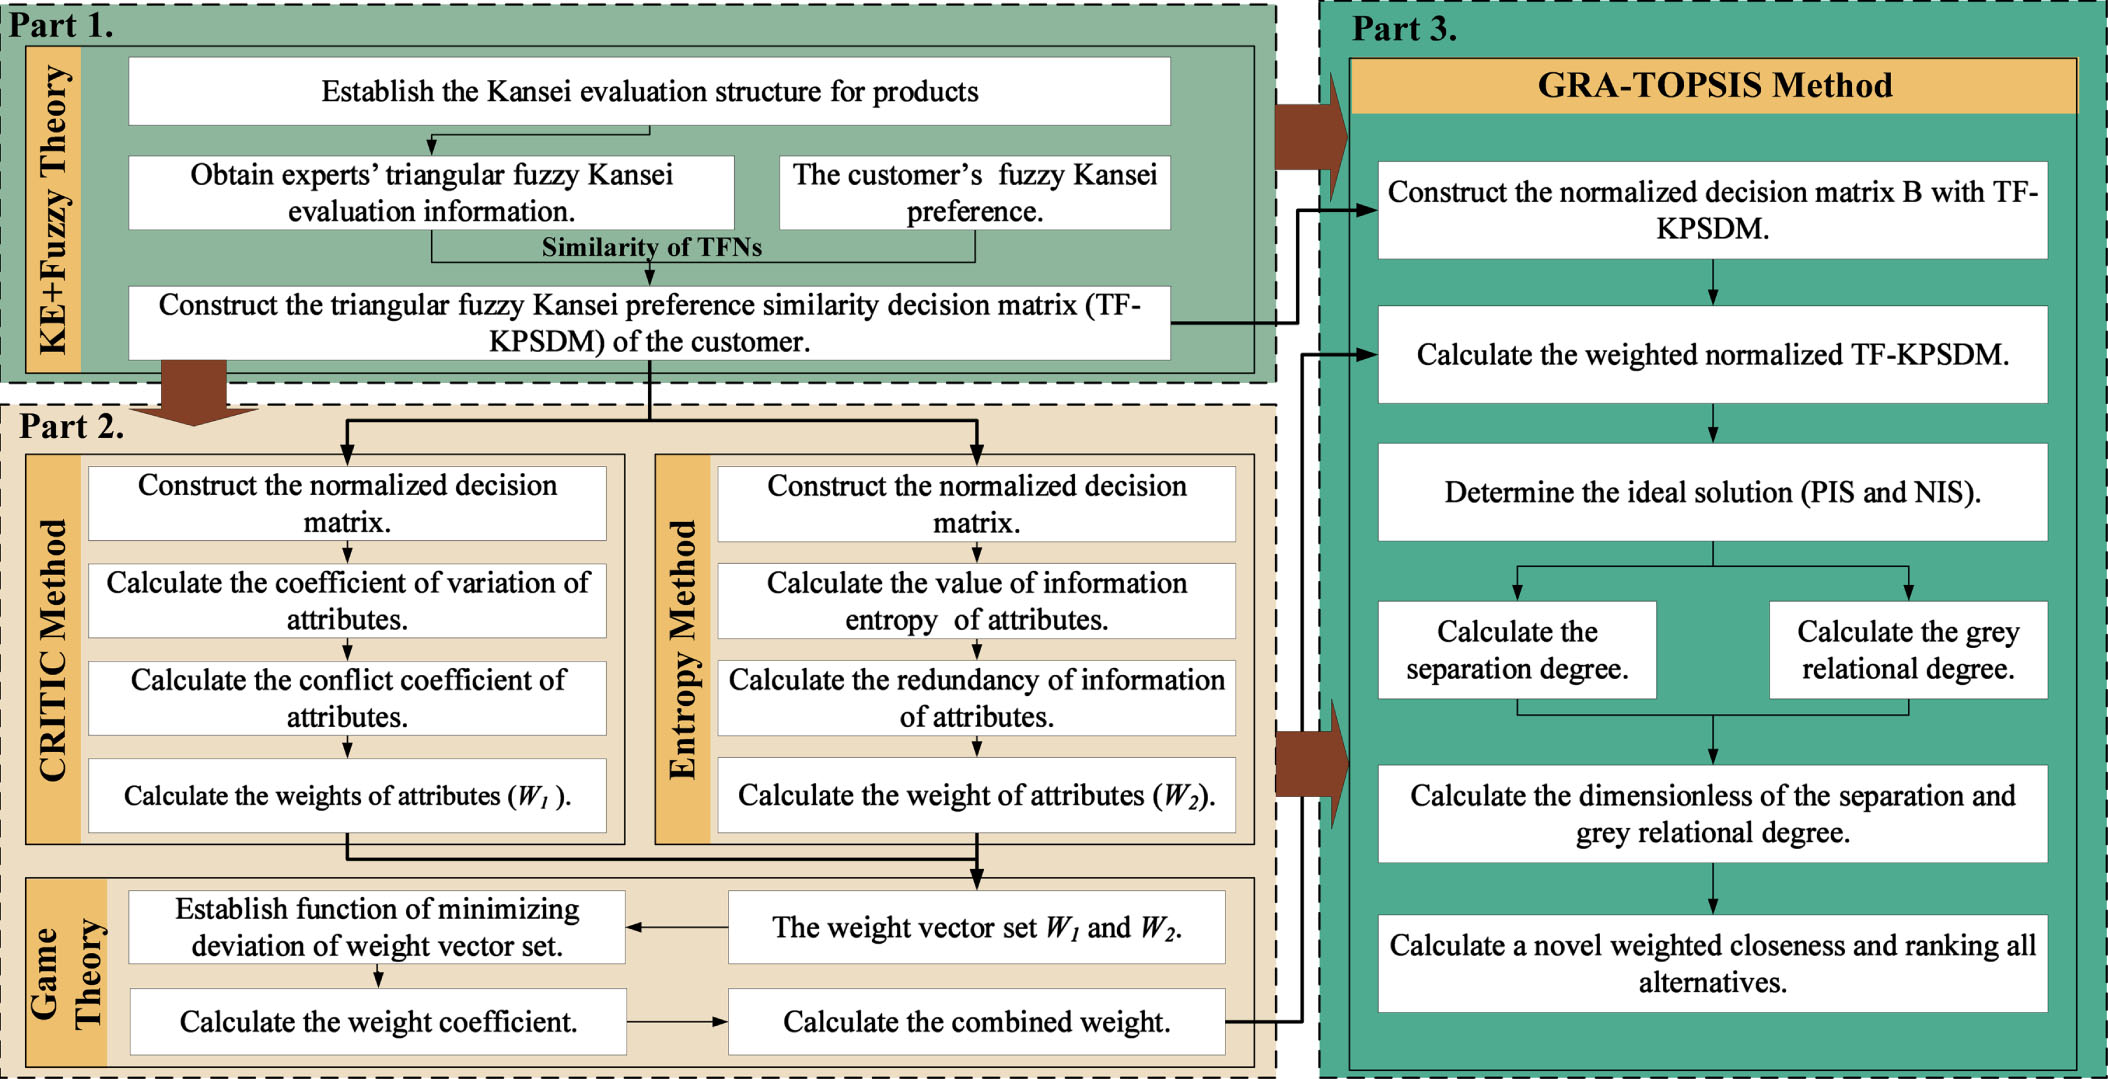
Integrated triangle fuzzy KE-GRA-TOPSIS decision-making method framework.
Kansei refers to the unique human perception and emotional response toward things [5]. It encompasses the subjective experience and feedback that individuals have when stimulated. Furthermore, Kansei plays a crucial role in customer-centric product design and evaluation [60]. Kansei Engineering (KE) is an approach to studying Kansei, one of the primary areas of study in ergonomics and psychology [49]. In KE, pairs of adjectives with contrasting meanings are frequently employed to accurately capture one’s subjective feelings. Meanwhile, the Semantic Difference (SD) method is widely used in KE to quantify human perceptions of products [12]. The SD verbal scale depicted in Fig. 2 is central to this approach. However, customers’ verbal expressions of feelings generated by a product are often vague and uncertain. Consequently, traditional SD verbal scales may no longer be adequate to measure customer emotions.
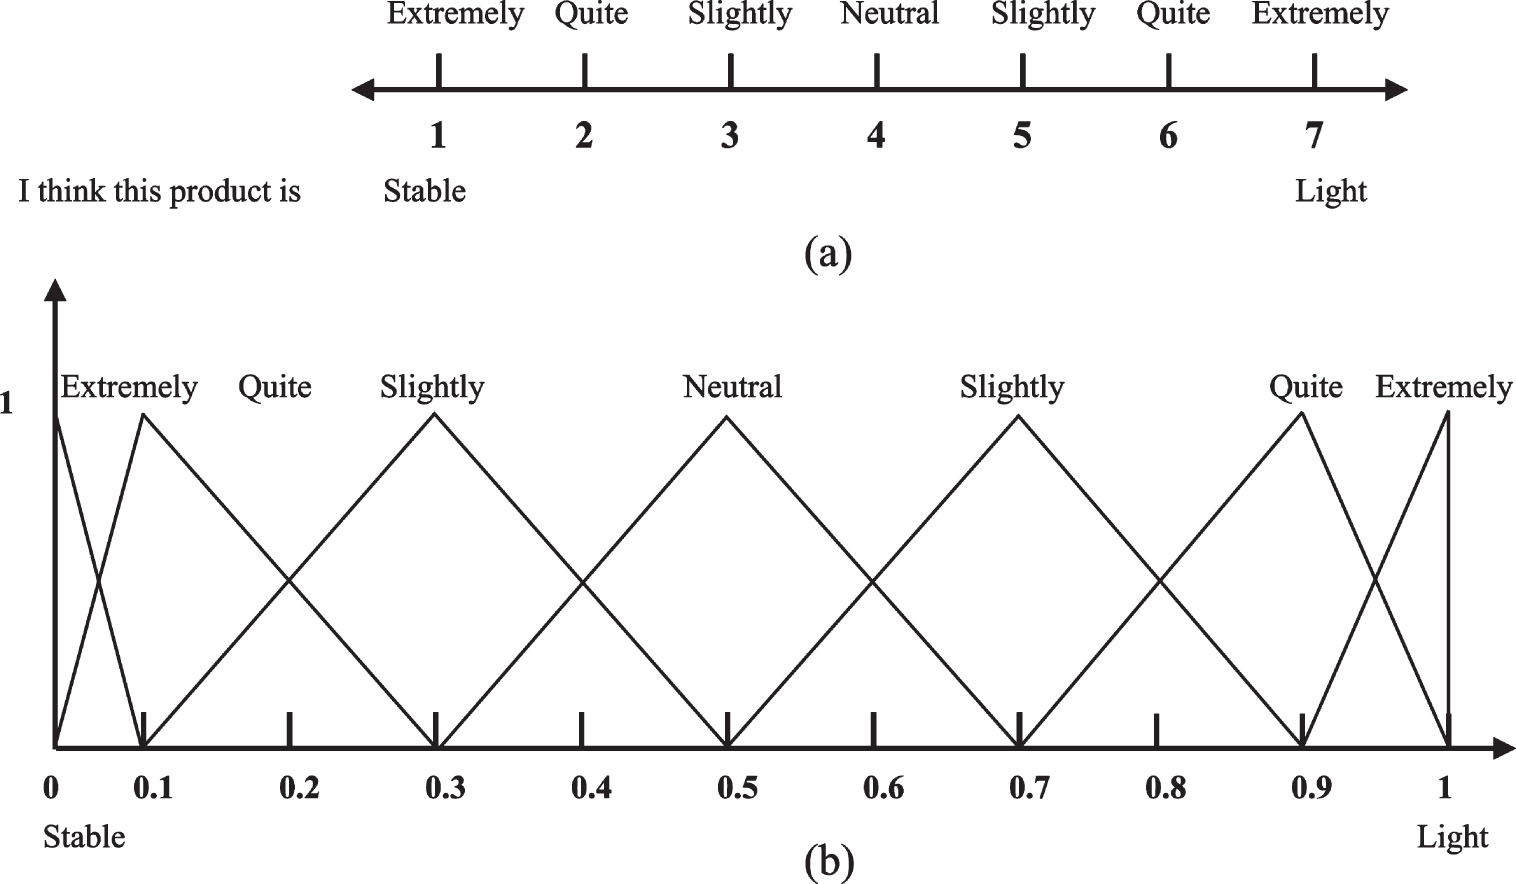
Traditional SD scale (a) and TF-SD scale (b).
The fuzzy theory was first proposed by Professor Zadeh in 1965 to address fuzzy problems [50]. Zadeh argues that human thinking and perception of things are fundamentally ambiguous [51, 61]. Consequently, numerous quantitative methodologies employing precise numerical values encounter limitations in addressing evaluation problems centered around human factors, while fuzzy numbers can convert them into fuzzy values ranging from 0 to 1. Among these, triangular fuzzy numbers are extensively utilized in fuzzy evaluations. A triangle fuzzy number can be expressed as
Let
Similarity measures are crucial in quantifying the level of similarity between two objects [48]. A method for calculating the similarity of triangular fuzzy numbers is presented in Equation (3) [63].
Where the larger
This study combines KE and fuzzy theory to address the fuzzy problem that the traditional SD scale cannot handle in customers’ perceptual evaluations. Furthermore, the SD scale is optimized using triangle fuzzy numbers to form a new Triangle Fuzzy SD (TF-SD) scale, as illustrated in Fig. 2. The TF-SD scale quantifies the fuzzy meaning of a customer’s perceptual assessment of a product by converting it into corresponding Triangular Fuzzy Numbers (TFNs) using seven-level linguistic variables. For instance, Table 2 displays the linguistic variables and their corresponding TFNs for customers’ fuzzy Kansei evaluations.
Linguistic variables for Kansei evaluation and the corresponding triangular fuzzy numbers
According to n Kansei indexes (C={C1, C2, C3,..., Cn}), experts make fuzzy Kansei evaluations on m alternatives (A={A1, A2, A3,..., Am}). Next, all the linguistic information of the fuzzy perception evaluation is transformed into TFNs based on Table 2. Then, their mean values are taken as the initial matrix H of fuzzy Kansei evaluation.
Considering that each customer has different perceptual preferences, this paper proposes a triangular fuzzy Kansei preference similarity decision matrix (TF-KPSDM) that quantifies the satisfaction of customers’ preferences based on the similarity between their fuzzy Kansei preferences and the initial matrix H. Finally, they are presented by Equations (5) and (6).
Where the bigger the value in the matrix P, the higher the customer satisfaction with the product’s perceptual needs.
Where the
The CRITIC method, proposed by Diakoulaki in 1995, is an objective weighting approach that determines the weight of each indicator by calculating variability and conflict between indicators [64]. This method fully utilizes the objective information in the original data and has clear advantages in calculating dynamic weights for indicators. However, there is still room for improvement in the CRITIC. The single CRITIC method fails to account for the dispersion among indicators, whereas entropy can effectively compensate for its limitations. The specific calculation steps are outlined below.
CRITIC method
Step 1. Construct the normalized decision matrix.
This study uses the TF-KPSDM (matrix P) as input for the CRITIC Method. Then the normalized matrix X can be represented by Equation (7).
Where xij is the normalized value of pij.
Step 2: Calculate the variation coefficient of each indicator.
Where Sj is the variation coefficient;
Step 3. Calculate the conflict coefficient of each indicator.
Based on the Pearson correlation coefficient, the conflict coefficient (Rj) is calculated by Equation (10) [55, 57]. Moreover, the Pearson correlation coefficients between the two indicators are calculated by Equation (11).
Where x
ik
and x
il
are the values of the kth and lth indicators in the normalized matrix, respectively;
Step 4. Calculate the weight of each indicator.
The total information volume for each indicator can be computed using Equation (12). The weight of each indicator is determined by Equation (13).
The entropy method can be utilized to identify the dispersion of an indicator based on raw data [34]. A larger dispersion of the indicator indicates a more significant weight for it. The specific algorithm is outlined below.
Step 1. Compute the entropy value of the jth indicator.
Step 2. Compute the degree of information redundancy on the jth indicator.
Step 3. Compute the weight of the jth indicator.
Game theory is an operational research method for studying competitive things [58]. Using the Nash equilibrium in game theory allows multiple decision-making subjects to maximize their gains or minimize losses through competition or compromise [47]. This paper considers the aforementioned dynamic weights as decision agents within the game, allowing both parties to balance interests in the conflict and ultimately obtain an optimal equilibrium solution as the dynamically combined weights. The precise procedure is as follows:
Firstly, assume that the obtained sets of weights are W1 = w11, w12, ⋯ , w1n and W2 = w21, w22, ⋯ , w2n, respectively. The combined weight W can be expressed by a linear combination of the two weight vectors as Equation (17).
Where λ1 and λ2 are linear combination coefficients; λ1 + λ2 = 1.
Secondly, utilizing the Nash equilibrium in game theory, we establish an objective function aimed at minimizing the deviation of combined weight W from W1 and W2. According to the principle of differentiation, the first-order derivative condition needs to be satisfied for Equation (18) to attain its minimum values as demonstrated in Equation (19).
Where
GRA-TOPSIS, a combination of TOPSIS and GRA, has been used to evaluate alternatives [24]. The methodology involves determining the positive ideal solution (PIS) and negative ideal solution (NIS), followed by calculating their Euclidean distances from all alternatives. Subsequently, the grey correlation between all alternatives and PIS and NIS is calculated using the GRA method. Then, we make the Euclidean distance and the grey correlation dimensionless before computing the reconstructed new closeness [56]. Finally, the alternatives are ranked according to the closeness value. The specific steps of the GRA-TOPSIS method are as follows:
Step 1: Construct the initial input decision matrix.
This study uses the TF-KPSDM (matrix P) as the input matrix for GRA-TOPSIS, as described in Equation (5).
Step 2: Calculate the normalized TF-KPSDM.
The normalized matrix B is defined by Equation (22), where b
ij
represents the normalized value that can be computed using Equation (23).
Step 3: Calculate the weighted normalized TF-KPSDM.
The matrix Z is a weighted normalized TF-KPSDM based on matrix B and the combined weights, as represented in Equation (24). The weighted value z
ij
can be calculated by Equation (25).
Step 4: Determine the PIS and NIS of the weighted normalized TF-KPSDM.
The ideal solutions include the PIS
Step 5: Calculate the separation of each alternative from the ideal solution.
Where
Step 6: Calculate the grey relational coefficients:
Where ρ is a coefficient that is usually taken as 0.5 [47, 56].
Step 7: Calculate the grey relational degree:
Step 8: Calculate the dimensionless of the separations and grey relational degree:
Step 9: Calculate a novel weighted closeness and rank all the alternatives.
In particular, in this paper, when the values of D- and G+ are larger, the closer the alternative is to the PIS; conversely, when the values of D+ and G- are larger, the closer the alternative is to the NIS. Thus, Equations (33) and (34) can obtain a novel weighted closeness.
Where β and 1 - β represent the effect coefficients of Euclidean distance and grey correlation on closeness, respectively.
The solution is more aligned with the customer’s perceptual preference when the Ci value is larger. Finally, rank all the alternatives in descending order based on their Ci values.
With the advancement of new energy technologies, e-bikes have emerged as a popular mode of transportation. However, there is a wide range of e-bikes in the current market, and the problem of product homogeneity is severe, leading to difficulties for customers in choosing an e-bike that meets their Kansei preferences. Therefore, we conduct a case study on Kansei preference selection for e-bike forms to validate the feasibility and effectiveness of the proposed methodology in this paper. It involves the following steps: (1) Construct the perceptual evaluation structure of e-bike morphology using KE, then integrate fuzzy theory into KE to obtain TF-KPSDM. (2) Obtain dynamically objective weights through CRITIC and entropy methods, then combine weights using game theory. (3) Rank the alternatives with GRA-TOPSIS.
Fuzzy Kansei evaluation system and alternatives
For the perceptual evaluation of the e-bike forms, a multi-dimensional system of perceptual evaluation indicators has been constructed, combining KE with the existing scientific literature on such indicators [62, 65]. As illustrated in Fig. 3, we have identified eight criteria as the dimensions for Kansei evaluation of electric bicycles’ form: “Sense of technology”, “Sense of weight”, “Structure”, “Individuality”, “Sense of line”, “Popularity”, “Sense of speed,” and “Gender”. Each criterion includes a pair of Kansei words. Sense of technology” comprises “Technical” and “Factitious”. Sense of weight comprises “Stable” and “Light”. Structure comprises “Simple” and “Complex”. Individuality comprises “Special” and “Ordinary”. Sense of line comprises “Streamlined” and “Stagnant”. Popularity comprises “Fashionable” and “Outdated”. Sense of speed comprises “Speed” and “Slow”. Gender comprises “Masculine” and “Female”.
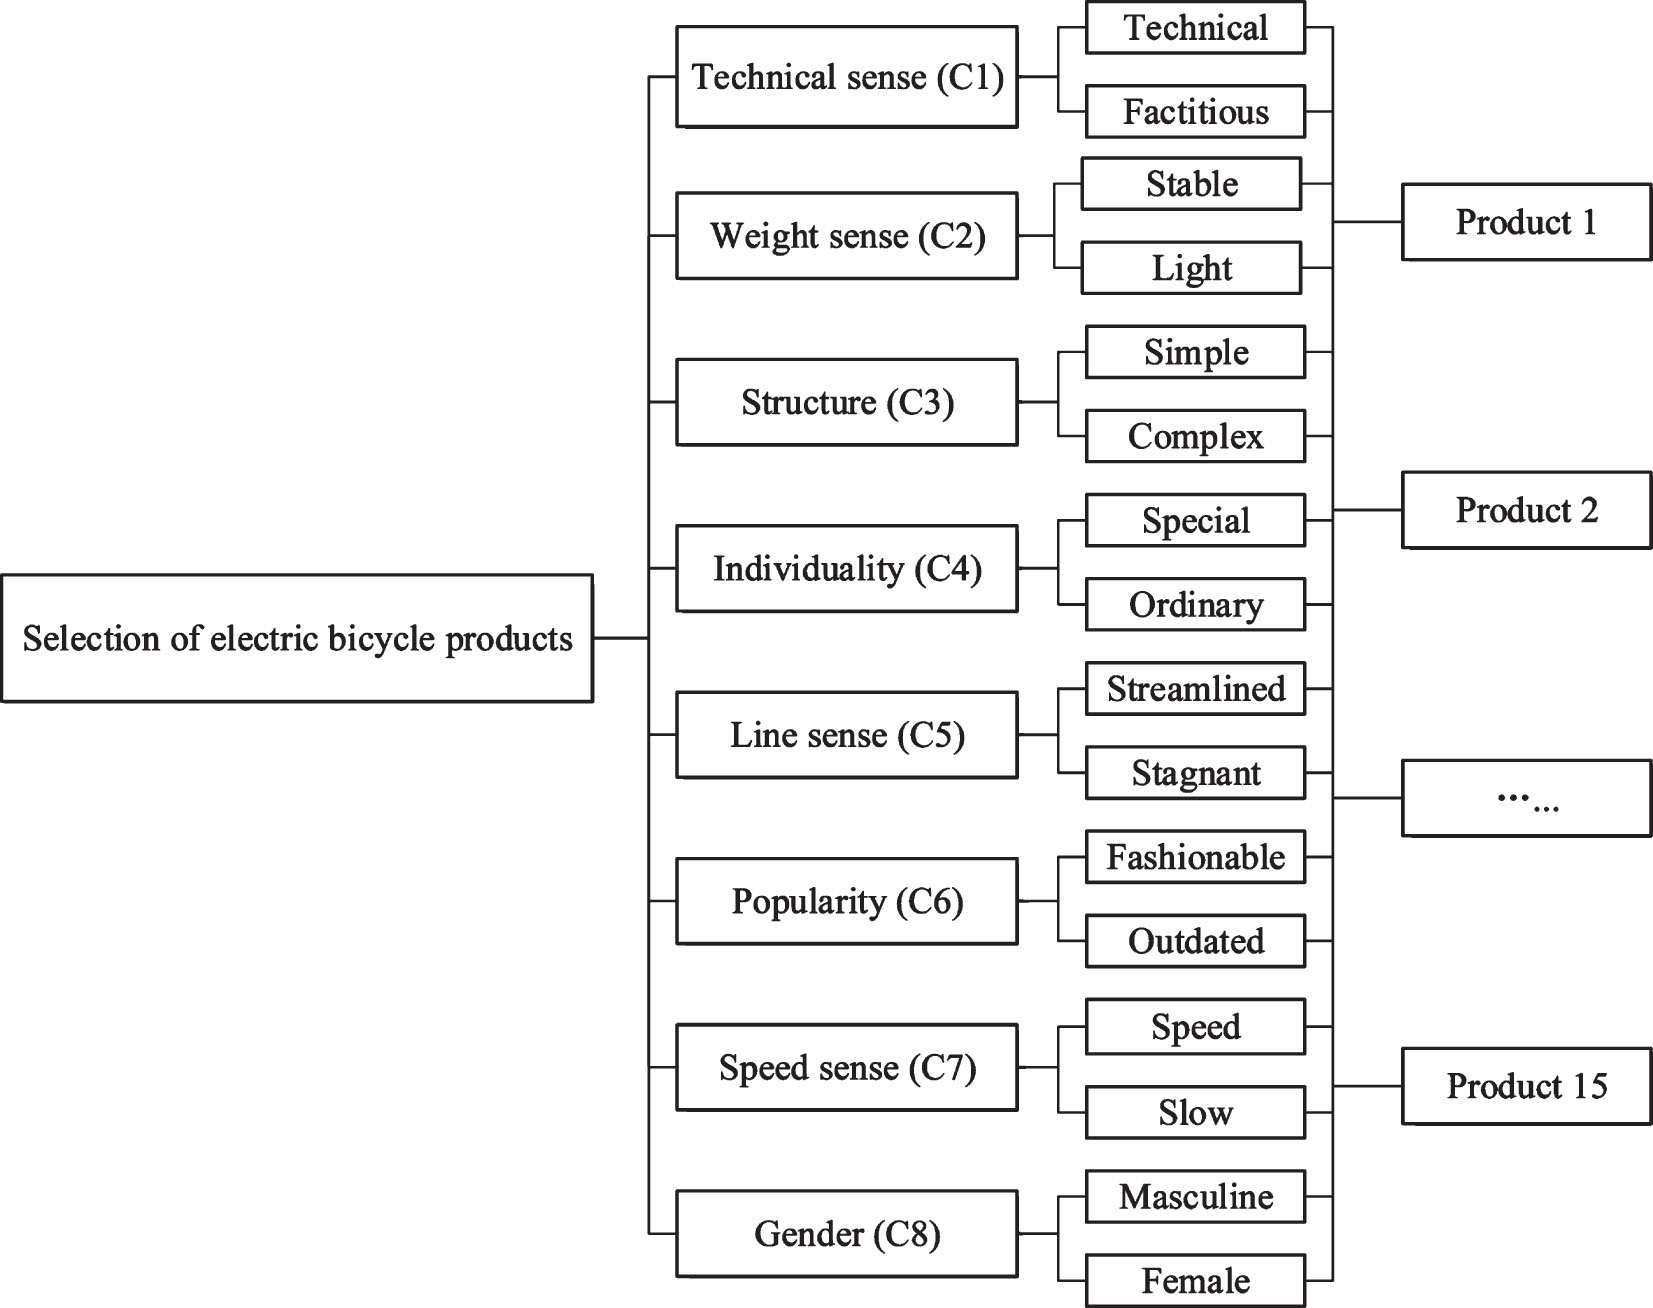
The electric bicycle product perceptual evaluation system.
We selected 15 different types of e-bikes with significant sales rankings on JD.com, a Chinese B2 C website (https://www.jd.com/), as alternatives, as shown in Fig. 4. Given that factors such as the color, license plate, and label of the e-bikes may interfere with the expert’s perceptual evaluation results, we processed the images of all alternatives with Photoshop to obtain more accurate results. Next, we formulated the questionnaire as depicted in Fig. 5. We recruited 30 participants comprising ten e-bike designers, 10 structural engineers, and 10 consumers to conduct perceptual evaluations on the morphology of all e-bikes presented in Fig. 4 across eight distinct perceptual dimensions. Among them, the fuzzy Kansei evaluation matrix of a certain expert is shown in Table 3. Subsequently, the evaluation results were aggregated to generate the initial matrix H, illustrated in Table 4.
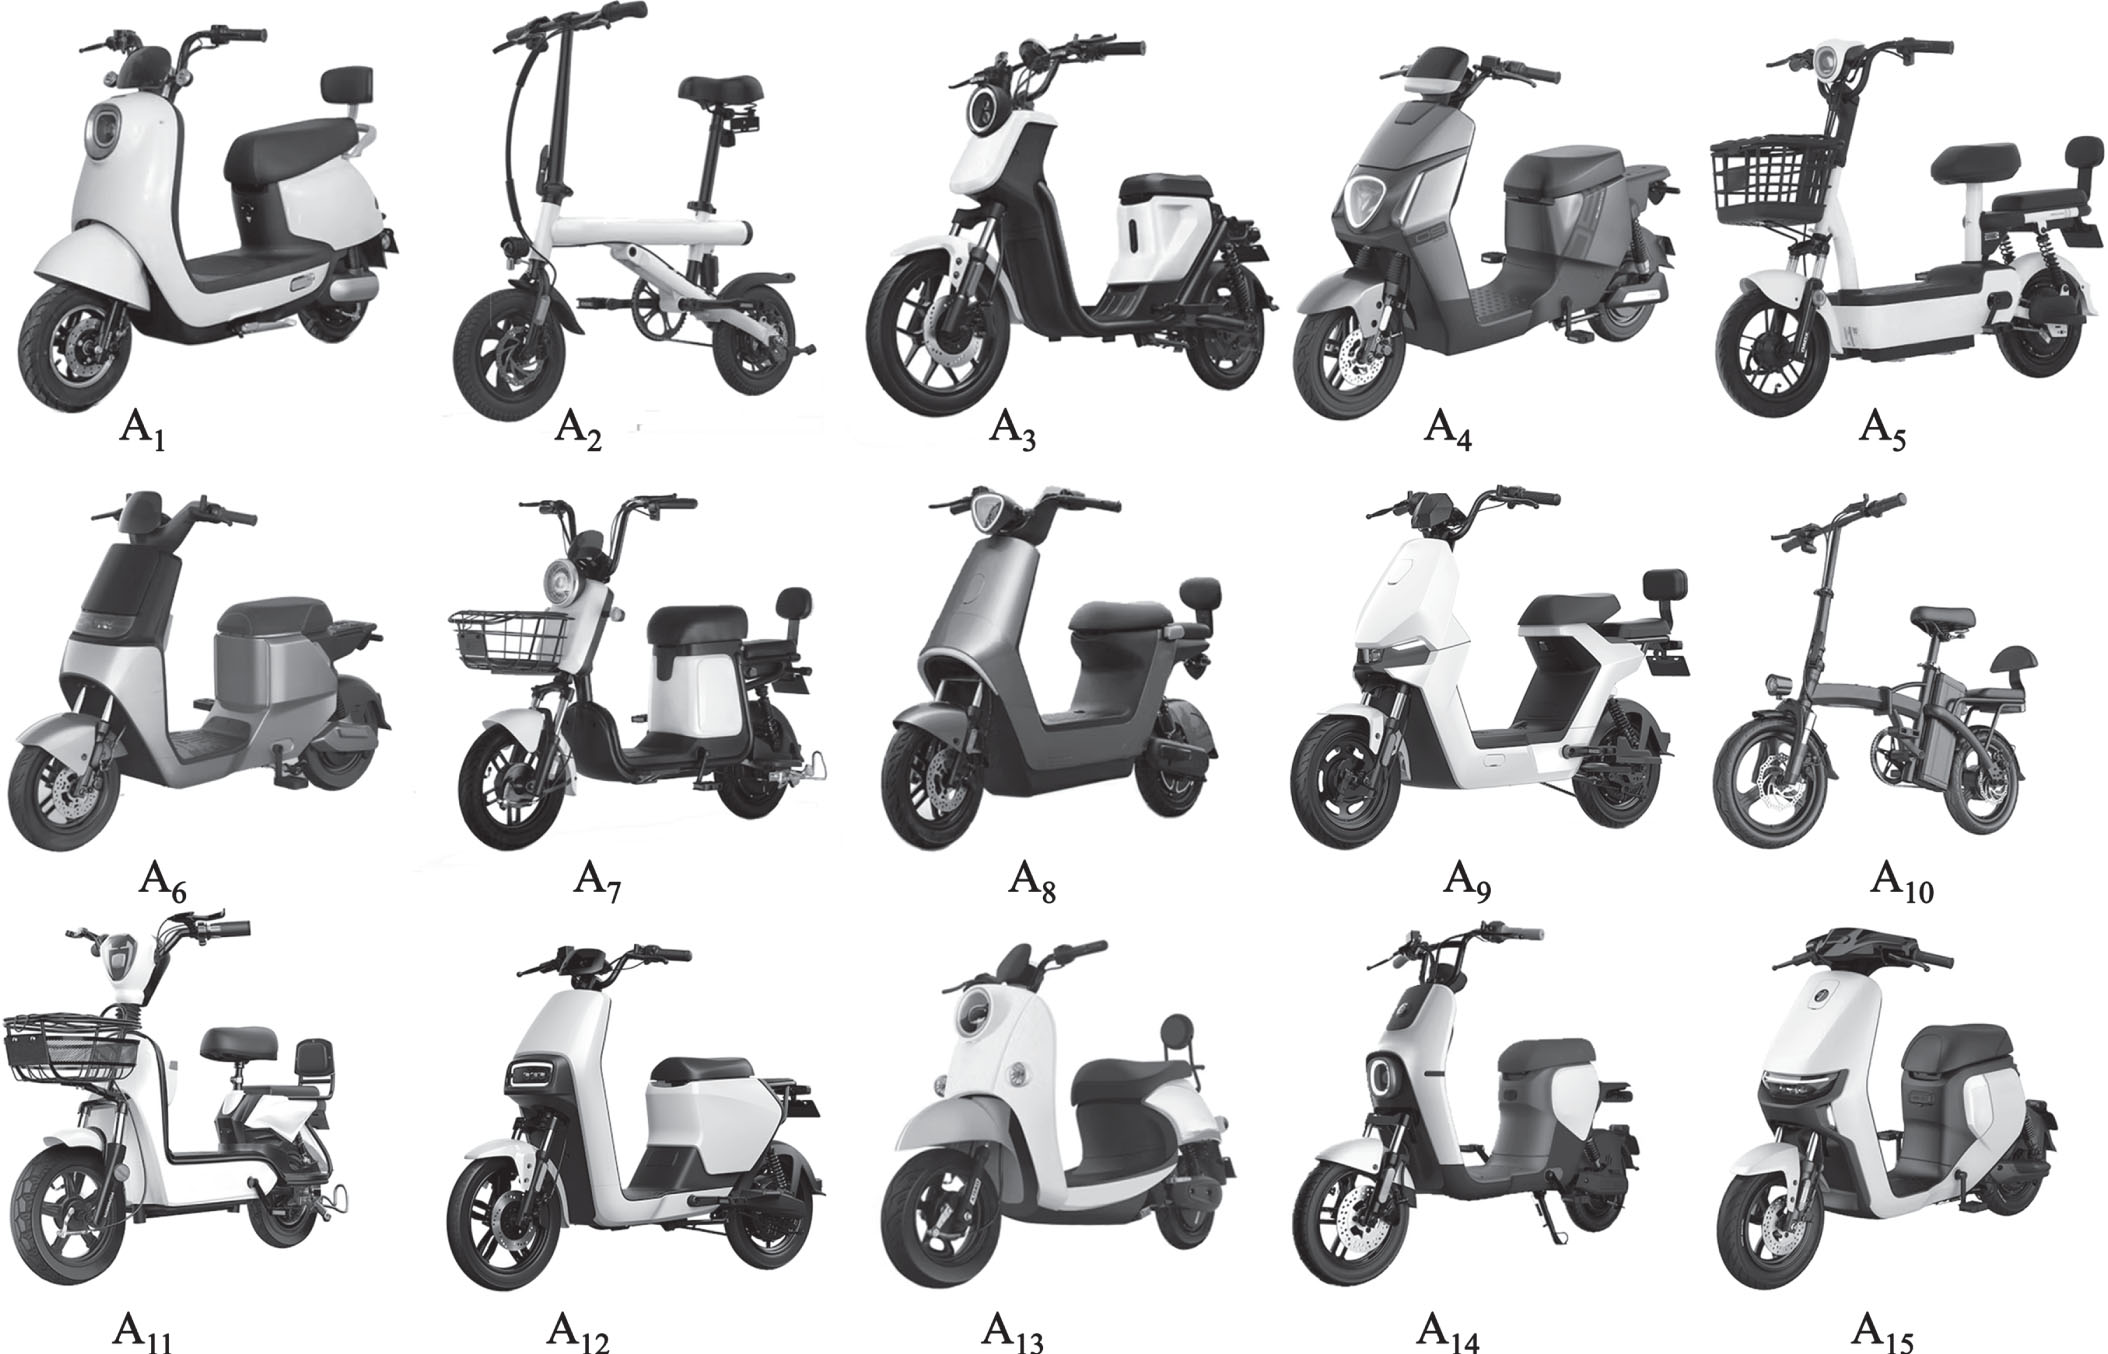
The alternatives of electric bicycles.
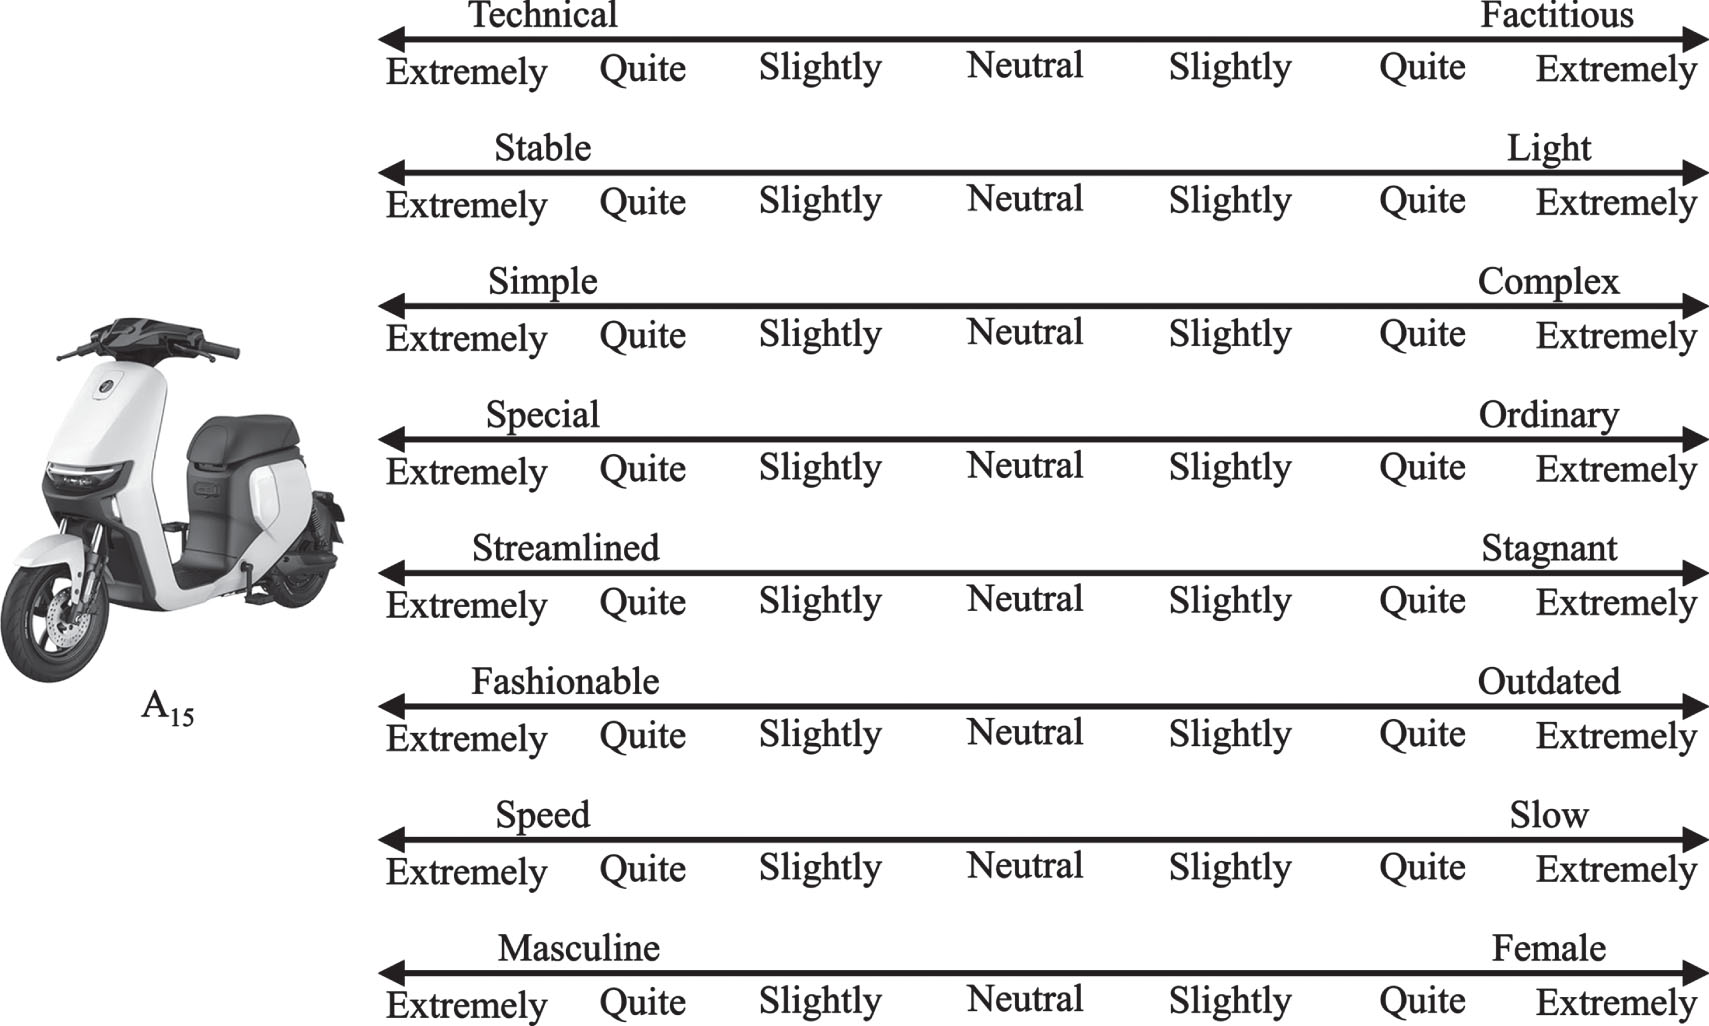
A perceptual evaluation questionnaire.
An example of a certain expert’s evaluation results
The experts’ evaluation results from questionnaires for alternatives
Then, the customer (also called a Decision Maker, DM) proposes its fuzzy Kansei preference. In this study, the fuzzy Kansei preferences of a DM are taken to be: quite technical, slightly stable, quite simple, slightly special, quite streamlined, slightly fashionable, slightly speed, and slightly female e-bike form. According to Table 2, the DMs’ fuzzy Kansei preferences can be expressed as DM = [(0,0.1,0.3), (0.1,0.3,0.5),(0,0.1,0.3),(0.1,0.3,0.5),(0,0.1,0.3),(0.1, 0.3,0.5),(0.1,0.3,0.5),(0.5,0.7,0.9)]. Finally, the TF-KPSDM of the DM is obtained by Equation (15) and the results are shown in Table 4.
The normalized matrix X for the customer’s TF-KPSDM is computed using Equation (8) and presented in Table 6.
A triangular fuzzy Kansei preference similarity decision matrix of the customer
A triangular fuzzy Kansei preference similarity decision matrix of the customer
The normalized matrix X of TF-KPSDM
Based on the normalized matrix X, we can acquire the weight values of CRITIC, entropy, and combined weight using Equations (9) to (21). Moreover, we can obtain the combined weight coefficients (
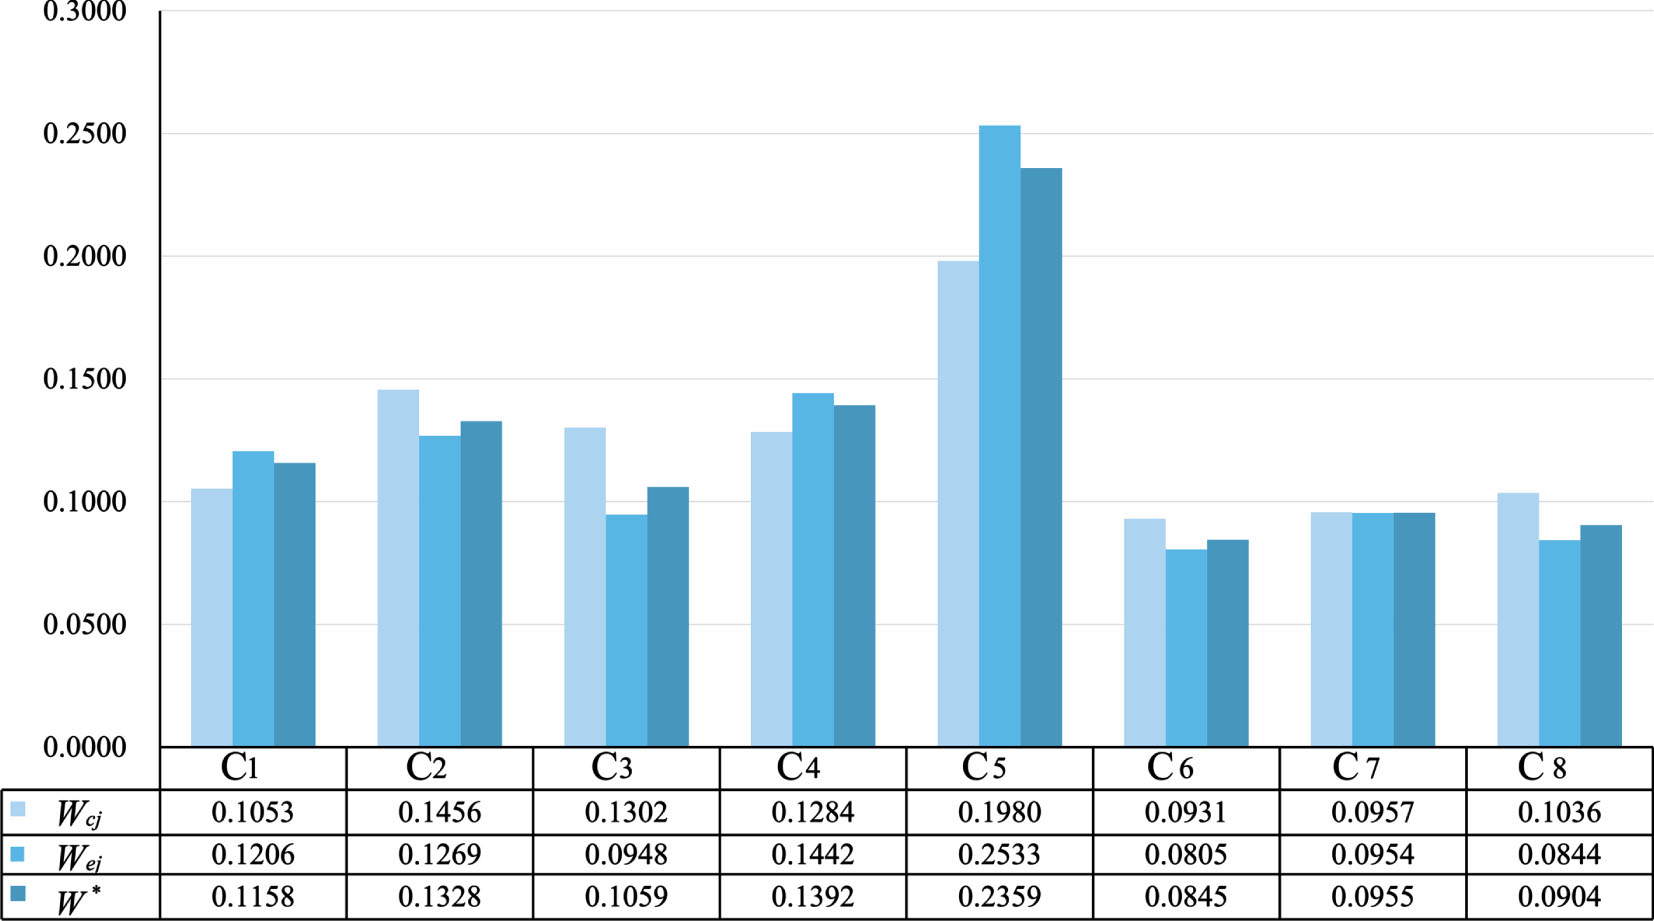
The CRITIC, entropy, and combined weight comparison graph.
As seen in Fig. 6, there are some discrepancies in the results for the weights computed by entropy or CRITIC. However, game theory can effectively reconcile these disparities by minimizing weight deviations. For instance, the Wej of C5 is 0.2533, while the Wcj is only 0.1980. After optimization through game theory, the W* is 0.2359, which is more scientifically reliable.
The weighted normalized decision matrix Z and the PIS (A+) and the NIS (A-) of alternatives are obtained according to Equations (22) and (26). They are shown in Table 7.
The weighted normalized matrix of TF-KPSDM
The weighted normalized matrix of TF-KPSDM
Next, the closeness of each alternative is calculated and ranked based on Equations (27) to (34); in this paper, the value of β is generally taken as 0.5. Then, we performed a linear fit to the closeness in Table 8. The fitted linear coefficient (R2) is 0.9361 in Fig. 7. It proves that the ranking results obtained by the proposed method are reasonable. Then, this paper employs three distinct methods (TF-KE-GRA method, TF-KE-TOPSIS method, and TF-KE-GRA-TOPSIS method) to rank alternatives of customers’ fuzzy Kansei preferences, respectively. In Equation (33), when β = 1, it indicates that only the TF-KE-TOPSIS method is used; when β = 0, it indicates that only the TF-KE-GRA method is applied. Moreover, this paper compares the values obtained from three methods: TF-KE-GRA-TOPSIS (β = 0.5), TF-KE-TOPSIS, and TF-KE-GRA. The comparison results are presented in Table 9 and Fig. 8.
The closeness and ranking of alternatives
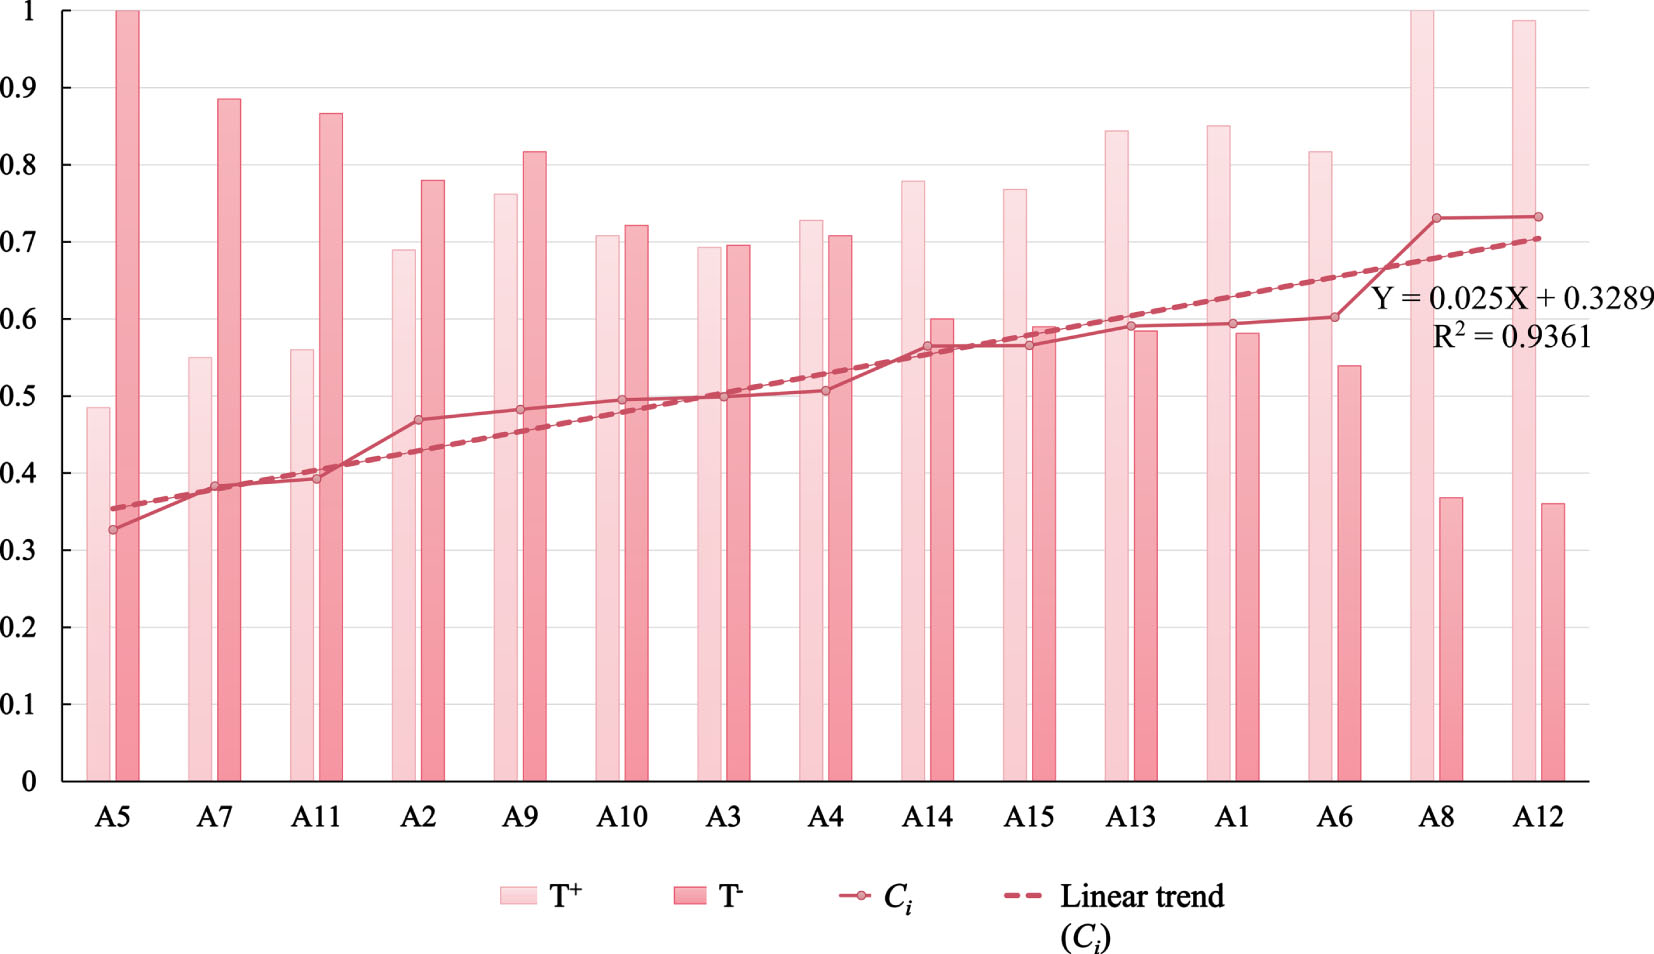
The linear trend graph of the alternative closeness.
The closeness and ranking of alternatives
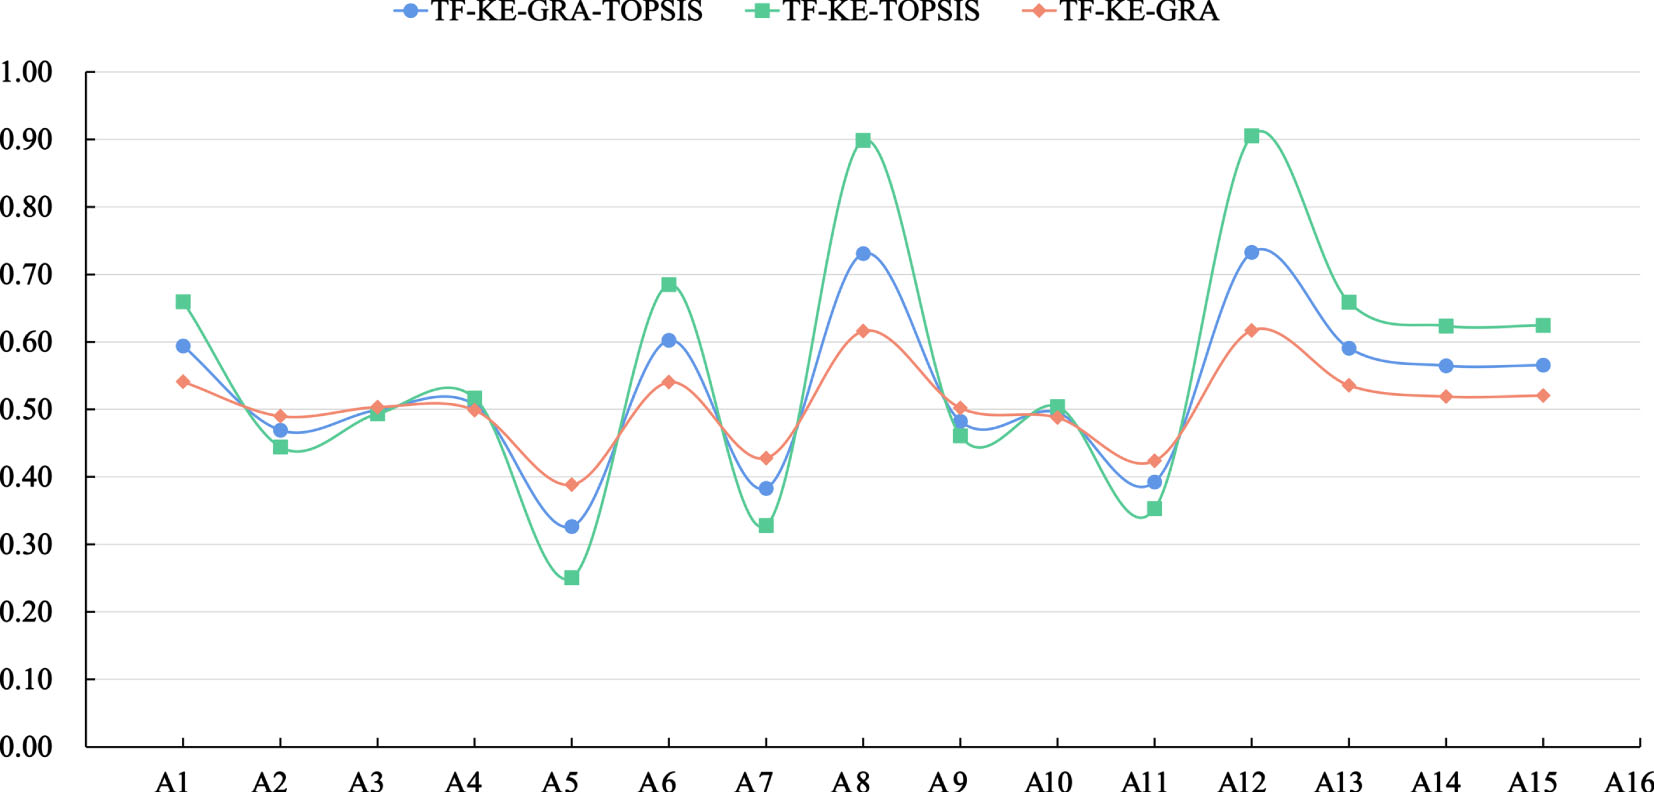
The comparison results of closeness.
Looking at Fig. 8, it is evident that the proximity of alternatives in the TF-KE-TOPSIS method varies significantly due to its sole consideration of spatial distance, which amplifies evaluation outcomes. Conversely, when utilizing the TF-KE-GRA approach, the gap between alternatives narrows as it solely concentrates on indicator linkages and disregards spatial distance. The TF-KE-GRA-TOPSIS method integrates the TF-KE-TOPSIS and TF-KE-GRA methods, considering the correlation degree among evaluated options and their gaps. Therefore, the derived closeness is more realistic.
To assess the robustness of the proposed method, we conduct a ranking consistency test and LOO analysis against five comparison models listed in Table 10.
The basic information about the comparison models
The basic information about the comparison models
Ranking consistency plays a pivotal role in assessing the robustness of MCDM [66, 67]. This study employs Equation (35) to compute the ranking consistency results for six models compared to DM. Additionally, the accuracy of each model is evaluated by comparing its ranking outcomes with DM’s selection. The results are presented in Table 11.
The ranking results of 6 comparison models
The ranking results of 6 comparison models
Where r s is Spearman’s ranking correlation coefficient. The x i and y i are the ranking results; N is the number of alternatives. The larger the correlation coefficient of r s , the closer the ranking results of the two alternatives.
Table 11 shows that all r s values are more significant than 0.95 in six models, and the top two and last ranked alternatives are the same in the 5/6 models. That indicates that the ranking results of the models are highly consistent with those of the comparison models. In addition, it is worth noting that model 1 has the highest ranking accuracy, while model 5 has the lowest accuracy at 86.67% and 46.67%, respectively. This further validates the reliability of the ranking results of the proposed model.
LOO analysis is a reliable method for testing the robustness of rankings [68]. It involves altering one of the fundamental components of a study and assessing whether the ranking results have changed significantly [69]. If no significant change occurs, it can be concluded that the ranking is indeed robust. Specifically, we eliminate this paper’s top-ranked alternative among 15 alternatives and then rank the remaining 14 alternatives. The reverse-order results of the new ranking are calculated by Equation (36).
The IOI (Inverse-order index) represents the percentage of alternatives that occur in reverse order compared to the original ranking result, while NI0I denotes the number of occurrences. N refers to the number of alternatives after LOO. For instance, if there is only one occurrence of reverse order (A3 and A4) after removing A12 from model 2, then the IOI for model 2 would be 1.1%. Similarly, the IOI values of other models are computed and presented in Table 12. According to Table 11, the accuracy of Model 5 is too low. Therefore, it is not included in this comparative experiment. According to Table 12, the ranking results for models 1, 3, and 4 remain unchanged even after removing the top-ranked alternative from the respective model. However, there have been changes in the ranking results for Model 2 and Model 6. The IOI of Model 6 is maximum, accounting for 4.4%, and the IOI of Model 2 is 1.1%. Therefore, the LOO analysis has successfully verified the robustness of our proposed method.
The results of LOO analysis for six comparison models
Moreover, by comparing the accuracy and IOI values of models 1, 2, and 3, we conclude that the dynamic composite weighting algorithm constructed in this paper demonstrates robustness. This algorithm is more fault-tolerant and maximizes correctness compared to a single conventional weighting method. When comparing the ranking accuracy and IOI values of models 1 and 6, we observe that the latter has lower ranking accuracy and highest IOI values when it does not consider the ambiguity of customers’ Kansei preferences. That suggests that vagueness has an essential effect on the order reversal of the model ordering in this paper. Following the comparison of models 1, 4, and 5 ranking accuracy, we find that the GAR-TOPSIS method achieves the highest accuracy, followed by TOPSIS, with GRA coming last. That is because TOPSIS solely considers the spatial distance between numerical values in MCDM, disregarding the shape-changing trends among them.
On the other hand, GRA solely considers the trend of numerical variation. GAR-TOPSIS effectively combines the advantages of both approaches, resulting in higher accuracy. In summary, the comparative analysis of these six models validates the accuracy and robustness of the proposed ensemble approach.
Based on the accuracy, r s and IOI values of the six models from Tables 12 and 13, it is shown that models 1 and 4 are superior. In this paper, 10 DMs are invited to repeat the experiment to validate the proposed method’s effectiveness further. Table 10 shows the results of the preference and alternative ranking of DMs.
The Kansei preferences and ranking results for 10 DMs
The subjective selection of 10 DMs was compared to Model 1 and Model 4, and the results are presented in Fig. 9. The bar graph represents the number of correct rankings, while the line graph depicts the accuracy rate. From Fig. 9, it can be seen that in Model 1, the accuracy rates of DM1 to DM10 are 86.7%, 86.7%, 100%, 86.7%, 80%, 100%, 80%, 86.7%, 100%, and 100%, in that order, and their average accuracy rate is 90.7%. In Model 4, DM1∼DM10 achieved accuracy rates of 53.3%, 60%, 80%, 66.7%, 73.3%, 53.3%, 66.7%, 80%, and 66.7% in that order, with an average accuracy of 68%. Model 1 is accurate by comparing the two models. The above results demonstrate the feasibility of employing similar decision matrices to capture customers’ fuzzy Kansei preferences and validate the accuracy of the proposed method in selecting products that align with their preferences. In addition, accurate product recommendations to customers can increase their satisfaction, stimulate their desire to purchase, and increase product sales, thereby helping the company gain a foothold in the competitive marketplace.
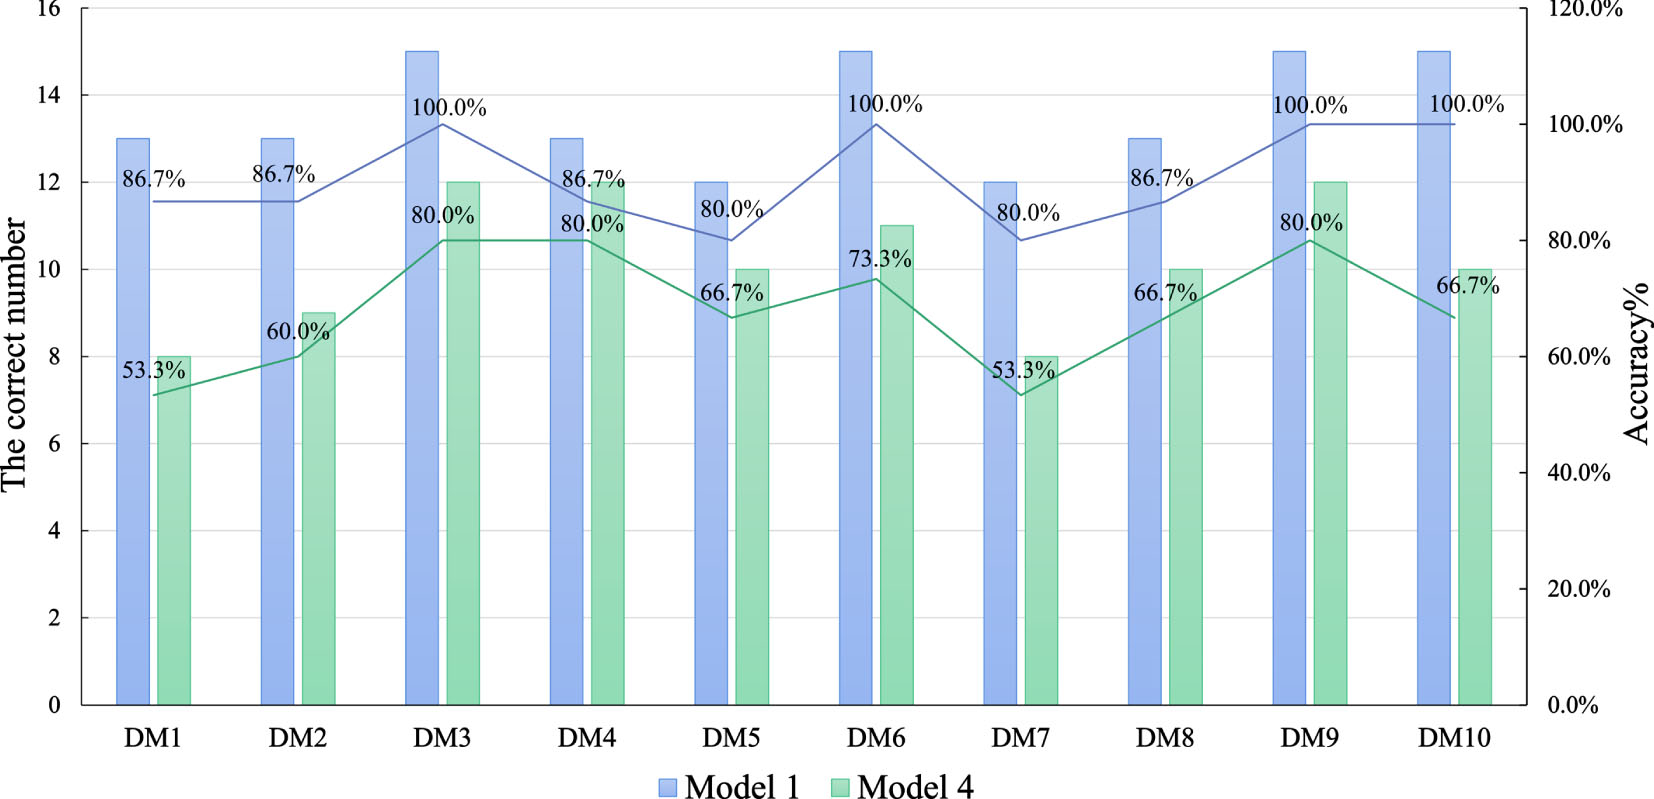
The correct number and accuracy of the rankings for models 1 and 4.
This study proposes the TF-KE-GRA-TOPSIS method to dynamically rank product alternatives based on Kansei criteria and customers’ fuzzy Kansei preferences. This research aims to reduce ambiguities and uncertainties in the Kansei preference decision-making process and assist companies in dynamically recommending products to customers based on their Kansei preferences, enhancing customer satisfaction and ultimately driving sales.
Firstly, we construct a perceptual evaluation system by using KE. To more accurately obtain the fuzzy Kansei preferences of customers and the perceptual evaluations of experts, we combine the triangular fuzzy number with the SD method in KE, which effectively avoids the problem of ambiguity and uncertainty in the acquisition of Kansei information. Next, given that each customer has different Kansei preferences when selecting products, we define the TF-KPSDM with the help of the triangular fuzzy similarity algorithm based on the expert’s perceptual evaluation and the customer’s fuzzy Kansei preferences. The greater the similarity between customers’ fuzzy Kansei preferences and product Kansei attributes, the higher their level of satisfaction. Then, we employ CRITIC and entropy to compute its dynamic weights according to TF-KPSDM, thus ensuring an objective and accurate assignment of weights to perceptual metrics. Subsequently, game theory was utilized to derive the optimal combined weights. Finally, to facilitate the MCDM-based selection of products that satisfy the customers’ fuzzy Kansei preferences, this paper innovatively replaces the conventional matrix with TF-KPSDM as input to GRA-TOPSIS. Furthermore, we demonstrate the feasibility and effectiveness of the proposed approach using an electric bicycle as an example. A comparative analysis of six contrasting models reveals that the TF-KE-GRA-TOPSIS approach has better accuracy and robustness in dynamically ranking product alternatives based on customers’ fuzzy Kansei preferences.
Overall, this research provides a valuable framework for addressing the challenges posed by ambiguous and uncertain Kansei preferences, enabling companies to better cater to the Kansei preferences of their customers.
While our proposed model can be extended to help customers choose other products based on their fuzzy Kansei preferences, thereby increasing customer satisfaction and boosting sales and revenues, it is essential to acknowledge that certain model limitations must be addressed and optimized in future research. The validity and accuracy of the model in question depend on the quality of the acquired perceptual preference data. Inaccurate data can introduce biases that affect decision-making outcomes. In this study, triangular fuzzy sets are employed to aggregate perceptual data. While this approach addresses the issue of ambiguity and uncertainty compared to traditional crisp numbers, it needs more refinement to account for the hesitancy. Therefore, future research should consider not only the ambiguous uncertainty of customers but also their hesitancy in acquiring perceptual data, which can be achieved by incorporating fuzzy linguistic terms with hesitation, such as intuitionistic fuzzy set and hesitant fuzzy set, into the process of acquiring perceptual data. In this study, we validate the proposed model by recommending a representative industrial product, i.e., an electric bicycle, to customers based on their perceived preferences. However, many other products and services must also be accurately recommended to customers. Therefore, in future research, this framework can be extended and integrated with personalized recommendations for various goods and services in everyday life. For example, it could help malls accurately recommend customers’ preferred clothing and footwear, airlines recommend their favored services to travelers, etc. Given the rapid advance of the artificial intelligence (AI) era, the framework presented in this paper may need to be fully aligned with the demands of the rapidly evolving AI age. Hence, our future objective is to extend the proposed approach into the AI decision-making domain and create an AI software system that provides customers with more seamless and intelligent choice services that cater to their evolving needs in a technology-driven landscape.
Footnotes
Acknowledgments
We are genuinely pleased to extend our gratitude to editors and anonymous reviewers for their valuable work. Moreover, this work was in part supported by the National Social Science Fund of China under [21&ZD215], Guizhou Provincial Basic Research Program (Natural Science) (No.ZK[2023]029), Guizhou Provincial Education Department’s Project for the Growth of Young Science and Technology Talents (No.KY[2022]209).
Declaration of competing interest
The authors have no competing interests to declare that are relevant to the content of this article.
Data availability statements
The data that support the results of this study are available from the corresponding author upon request.