
Abstract
Tables are commonly used for effective and compact representation of relational information across the data in diverse document classes like scientific papers, financial statements, newspaper articles, invoices, or product descriptions. However, table structure detection is a relatively simple process for humans, but recognizing precise table structure is still a computer vision challenge. Further, innumerable possible table layouts increase the risk of automatic topic modeling and understanding the capability of each table from the generic document. This paper develops the framework to recognize the table structure from the Compound Document Image(CDI). Initially, the bilateral filter is designed for image transformation, enhancing CDI quality. An improved binarization-Sauvola algorithm (IBSA) is proposed to degrade the tables with uneven illumination, low contrast, and uniform background. The morphological Thinning method extracts the line from the table. The masking approach extracts the row and column from the table. Finally, the ResNet Attention model optimized over Black Widow optimization-based mutual exclusion (BWME) is developed to recognize the table structure from the document images. The UNLV, TableBank, and ICDAR-2013 table competition datasets are used to evaluate the proposed framework’s performance. Precision and accuracy are the metrics considered for evaluating the proposed framework performance. From the experimental results, the proposed framework achieved a precision value of 96.62 and the accuracy value of 94.34, which shows the effectiveness of the proposed approach’s performance.
Introduction
Image acquisition technology has enabled us to digitize many printed documents. With the help of the digitization process, documents such as reports, invoices, and articles are restored in digital format. These documents generally contain one or more text, table, and graphical information components. Therefore, such document images are called Compound Document Images (CDIs). OCR converts only the text information in CDI into digital text formats. Graphical components are segmented from the CDI and can be stored in various image formats. CDI analysis typically applies page segmentation, skew detection, text–orientation detection, Pattern matching, and word detection. Each component holds some crucial information in a document. Recognition of all components in an image is a critical factor in CDI analysis. A table, diagram, graph, and text on the same page contain related information. Therefore, focusing only on text information restricts us from fully understanding the document.
Precisely, in the case of tables, OCR cannot extract contents with relational integrity of data [1]. Tables are used to represent relational data that may have crucial structural information associated with it. Different regular and complex document types use tables for information representation [2] using different table structures, either with or without a skeleton. The Tesseract OCR engine is mainly used for extracting printed text from images. However, this method fails when the document contains tabular data [3]. A simple method for table detection is Random Bounding Box. An imaginary rectangle is the point of reference for object detection and creates a collision box for that object [4].
Image processing and pattern recognition use analysis of tables from documents. Table recognition methods have recently shown a high degree of regularity due to their layouts [5]. Hence, machine learning techniques have become a powerful tool for finding the pattern in tabular data [6, 7]. Computer vision and machine learning are applied to automatic table structure recognition. Further, it performs feature extraction and dimensionality reduction [8]. With the help of an automatic machine learning pipeline, we can efficiently perform table segmentation [9]. Hence, we can identify each table document’s border and cell structure. It helps to find the information inside and outside the table [10]. With the increasing growth of digital files and content, there is an increasing demand for automated extraction of tables [11]. Hence, we use different machine learning algorithms simultaneously, which also helps extract tables from the web also [12].
Deep Learning is one of the latest breakthroughs in the machine learning field. It uses artificial neural network algorithms inspired by the human brain. Detecting the tables and charts from documents uses deep convolution neural networks and different graphical methods [13]. Graph networks are improved versions of neural networks that can accelerate the feature extraction process [7, 14]. Recently bottom-up approach has been used for extracting table information. It converts the lines into cells for finding rows and columns. The content of the cell contains text or numerical value [15, 16]. The more systematic method for table detection is DeepDeSRT [17]. It is also based on deep Learning. However, it does not require rules to detect and recognize the table and inside the contents. This method is suitable for both scanned and born-digital PDFs [17]. Using mobile devices equipped with a camera system and scanners makes the extraction process important. The invention of Table Net makes table detection and structure recognition easier. It extracts information from scanned tables through cameras or mobile phones [18].
Based on the above discussion, deep Learning is the building block of table extraction, and using computer vision, we can easily find the position of information in the tables. However, the relational integrity of tabular data remains a challenge.
The following section provides a comparative study of the state-of-the-art approaches and recent CDI analysis development. Section 3 presents the proposed methodology for table structure detection, and the experimental results are presented in Section 4. Finally, the overall work is concluded in Section 5.
Related works
Gupta, A., et al. [19] have proposed an integrated framework for extracting the table from the documents. In the prepossessing phase, vertical and horizontal line removal eliminates the dependence on table rule lines. The textual and structural contents are extracted simultaneously from the document images. Three sub-operations are performed in the table detection phase: word blob formation, candidate line selection, and table region detection. The contents from the table are extracted in the third phase, i.e., the metadata extraction phase. UNLV Dataset was used for the evaluation of the integrated framework performance.
Hansen, M., et al. [20] have focused on automatically extracting tables, algorithms, and data visualization from a document. The principle for structuring the unstructured PDF documents was formed using the proposed system. Two techniques such as rule-based image processing and Deep Learning, are developed in this framework. The neural network was trained by annotating the massive corpus of PDF documents. The segmentation method was developed in the first phase using Deep Learning and rule-based technique. While in the second phase, the Object Detection-based method was developed using Deep Learning. The precision value obtained for this approach was 0.78, and the recall value attained was 0.94.
Milosevic N., et al. [21] have introduced an integral approach and the requirement analysis template for extracting the information from the tables. Table detection, functional processing, structural processing, semantic tagging, pragmatic processing, cell selection, and syntactic processing and extraction are the seven phases in the developed framework for data extraction from the table. Certain variables are extracted in the information extraction operation, and stored the appropriate data in a defined template. Then, the rules are defined for extracting information from the tables. Mapping public PMC4 articles was used to generate the MEDLINE dataset with the word “clinical”. Zhang Z. et al. [7] have proposed accurate table structure recognizer using split and merge method.
Rastan, et al. [22] developed a table processing concept using component-based design and implementation. It provided high performance, re-usability, and flexibility on various table ranges. A fully automated table processing approach called TEXUS was proposed to detect tables from the PDF document. The two-phased processing pipeline model and the table processing specific document model are developed to enhance the table extraction and recognition process from the document. ICDAR 2013 dataset was utilized for the evaluation of the table processing concept. The performance metrics considered for evaluation are precision, recall, F-measure, completeness, and purity.
Yuan, J., et al. [23] have proposed a novel OpenCV-based architecture for extracting particular values and metadata from PDF tables. The initial process in the table extraction framework was the visual outline highlight. The vertical and horizontal lines are used for the location of tables. The tabular frames are coordinated in each PDF page, and the cross scenario was utilized for each table after the successful table detection. The particular values are extracted in each table cell using the optical character recognition (OCR) engine. Precision, recall, and F measure are considered to evaluate table extraction. Educational Documents, Conference Articles, and CCKS Financial Reports are the three datasets used to evaluate the system’s performance.
Above literature discussion helped us to identify the problem statement for this article which is as under.
Motivation
Due to the structural variations in data representation within the tables in CDI, constructing a robust model for table structure detection is challenging. Moreover, in some cases, the graphs and line diagrams are identified as tables. Wrong contour leads to inaccuracy in tabular data relational integrity in CDIs. Therefore, an efficient image transformation approach is required to improve the document image quality. Pre-processing plays a critical role in CDI analysis and robust extraction of various components from CDI. It also enables table structure recognition and data extraction from tables. Existing approaches focus on text extraction from tables, while relational integrity is not maintained for analysis and digital restoration.
Therefore, the Objective of the work is formally defined below:
Contribution
The following are the contributions of this work: Table borders are enhanced using the image transformation technique. IBSA method is developed for table degradation with uneven illumination, uniform background, and low contrast. Morphological Thinning and Masking are designed for extracting the table line, row, and column, respectively. Black widow optimization-based mutual exclusion (BWME) is proposed to detect table image location and extract table cells. The table structure is recognized using the ResNet Attention Model.
Proposed methodology
Tables efficiently summarize relational information in different document classes, such as scientific papers, newspaper articles, invoices, forms, product descriptions, or financial statements. The vital information is communicated for scientific and financial records through the Tabular structure embedded in documents. Such information extraction is essential for firms for processing/digitization purposes. Therefore, it is vital to detect the structure of the tables in document images. Image transformation is a primary step in detecting tables, in which the bilateral filtering approach includes enhancing the data and borders present in the table. Then, an IBSA approach is proposed for degrading the table images with low contrast, uniform background, and uneven illumination. The next step is the extraction of table lines using Morphological thinning. Table rows and columns are extracted using Masking.
The location and extraction of table cells are performed using the BWME technique. Finally, the table structure is recognized using ResNet Attention Model. Figure 1 represents the architecture of the proposed methodology.
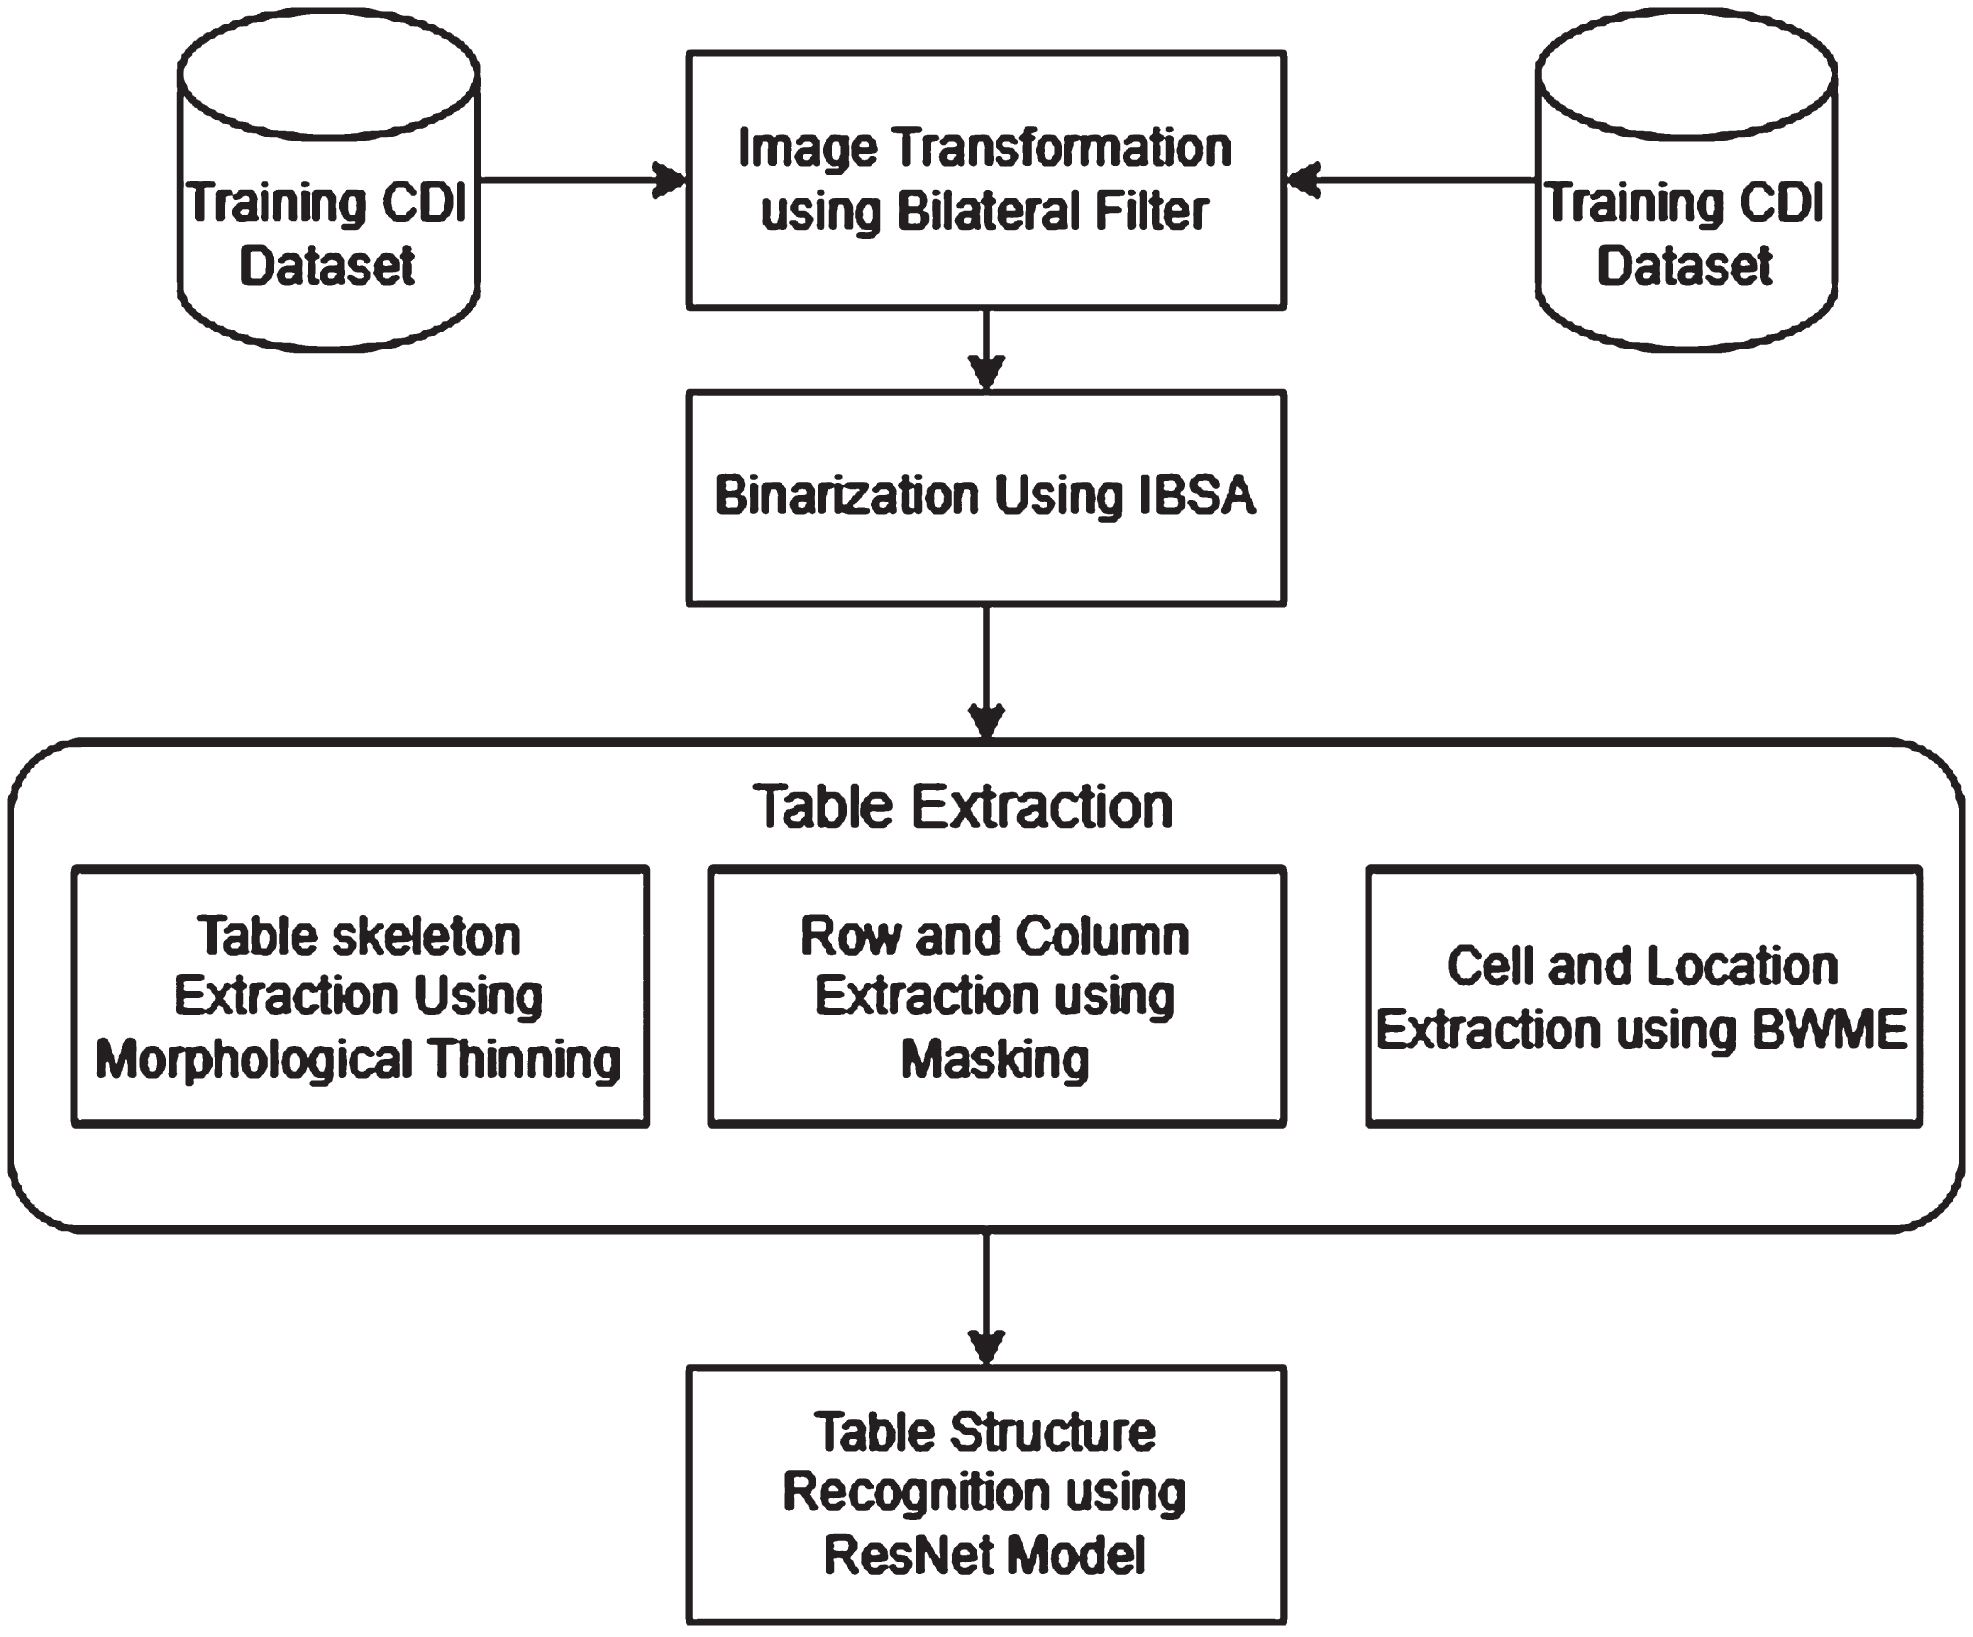
Process flow of proposed methodology.
In table structure detection, image transformation is the initial process, which plays a vital role in document images conversion to natural images. It enhances the quality of document images to detect the table more efficiently. A bilateral filtering technique is used to transform images from PDF documents. The bilateral filter is an adaptive filtering approach that preserves edges. It also depicts nonlinear behavior. It combines range and domain filtering and is considered a nonlinear filter. It improves compound document images’ visual quality, readability, and processing accuracy. The input document
Where the intensity is denoted as
After the image transformation, the table images with uneven illumination and low contrast are degraded using the binarization algorithm. Based on the binarization effect, the detection accuracy of characters in the table and edge information depends. In this work, the IBSA approach is designed for the binarization process. It is an enhanced approach that deals with table images suffering from low illumination, less contrast, and uniform background [25]. The IBSA provides adaptive thresholding, preserves local contrast, suppresses noise, and handles document variations robustly. Therefore, for accuracy, better preservation of CDI details, IBSA provides enhanced performance in subsequent analysis tasks of OCR, segmentation, and document analysis. It also overcomes the disadvantages of the conventional Sauvola binarization algorithm in terms of robustness and loss of information. The binarization output is obtained by the geometric mean g (x, y) with the maximum value max (x, y) in the window expressed as:
Where
The table extraction includes the table line, row, column, and cells and the location extraction to detect the appropriate table.
Morphological thinning
Thinning is a morphological task that eliminates the selected foreground pixels from the binary images. The topology, such as connectivity and extent of the raw input image, is preserved, and most foreground pixels are removed. It decreases all the lines to a single-pixel thickness to tidy up the edge detector output. Two inputs are given for the morphological thinning operation: greyscale or binary and structuring element. This structuring element examines the precise details of the effect of the image operator. Finally, it extracts the line images L I from the tabular structure.
Then, a connected component (CC) analysis is performed to extract table features from the obtained L I . The horizontal and vertical lines are constituted in CC, and these lines are denoted as X i and Y i respectively where i = 1, 2, 3, . . . n. In the top-to-bottom order, the horizontal lines indices are sorted and in left-to-right order, the vertical lines indices j are sorted.
The line X
i
’s length and starting and ending positions are represented as
Likewise, a similar procedure is followed for vertical lines, i.e.
Feature Vector and their respective definition for calculation
The table region’s encompassment of horizontal and vertical lines is ensured using features I1 to I6. The line skeleton constitute a table, usually have some regularity in their position, length, and spacing between adjacent ones. They are computed using the feature I7 to I16 and definition are written against them in Table 1.
Due to a large number of cells available, the Euler number’s high negative value exhibited a CC that belongs to the table. Moreover, the line drawings and the graphic objects have ‘open’ lines, which do not intersect with other lines at an end. The lines enclose the tables in both vertical and horizontal positions. Therefore, the non-table objects have more convex deficiency regions because of the availability of ‘open’ lines. Thus, the features I17 and I18 are used for computing the above characteristics as defined in Table 1.
Masking is a process that generates the column and table region. This mask filters the table and column regions from the document images. Further, it filters only the word patches available within the column and table region. At this instant, the row is defined using these filtered words and is the collection of words obtained from several columns at the same horizontal level. Multiple lines can be spanned by row based on the content of a column or line separations and are not restricted to a single line. The following are the rules that are formulated for row segmentation [18]: A Radon transform tests the availability of lines by each space between two vertically positioned words in a column to detect feasible line demarcation for rows. If multiple lines are spanned in a row, the table’s rows with high non-blank entries are noticeable as the starting point for a new row. Therefore, in each column, all the entries are filled, then the new row begins. Each line is perceived as a unique row if all the columns are filled, and there are no line demarcations in the tables.
Black widow optimization-based mutual exclusion (BWME)
BWME approach is proposed in this work to extract the location of the table region and the cells in the table. The black widow optimization algorithm (BWOA) is the meta-heuristic algorithm inspired by the black widow spiders’ specific mating behavior [27]. It can solve complex mathematical optimization problems and provides optimal values. Mutual exclusion can avoid race conditions, i.e., this approach ensures that simultaneous updates can prevent or not occur. This BWME approach is designed to solve the complex numerical problems in mutual exclusion using the BWOA.
Moreover, it extracts the location of the table region from the document images. Further, it extracts each cell from the table for the efficient detection of the table. The procedures for the extraction of table location and cells using BWME are as follows:
Step 1: Initialization: In the first step population is initiated, by some widows with size S. Each widow is denoted an array as 1 × P
var
. This array represents the solution, and is expressed as;
Where (x1, x2, . . . . x P var ) are the floating point numbers as variable values.
Step 2: The fitness function is then evaluated for the widow f (W). It is defined as equation below:
The candidate widow matrix is created. Size of this matrix will be P pop × P var with the initial population. Further, pairs of parents are randomly chosen that performs the procreating step.
Step 3: Procreate: An α array with the length equal to window array must be generated. This array will contain random numbers. The offspring is defined as:
The crossover output is determined and stored where the offspring is denoted as z1 and z2.
Step 4: Cannibalism: Variable pop2 stores the new population after applying the cannibalism mechanism.
Step 5: Mutation: The mutepop number of individuals randomly chooses the population which will be mutated. Then, the two elements of the array are randomly exchanged by each of the selected solutions. The new population is computed and preserved in the new population called pop3.
After the migration of pop3 and pop2, the new population is attained and sorted to return the optimal widow with P var dimensions.
With the help of the local features learning part, from input table features, the local features are learned for recognizing the table’s structure. Using the ResNet, the output is computed as a feature map. The structure of local feature vectors is included in the feature map. This portion contains limited primary layers and the main body, formed by repeating infrastructures. Every main body structure includes the residual module and max pooling layer. For the layer of max pooling, the pool size is 2. By each of the structures, the feature map length is halved. In this model, the structure amount is based on the input length. Figure 2 illustrates the ResNet Attention model architecture.
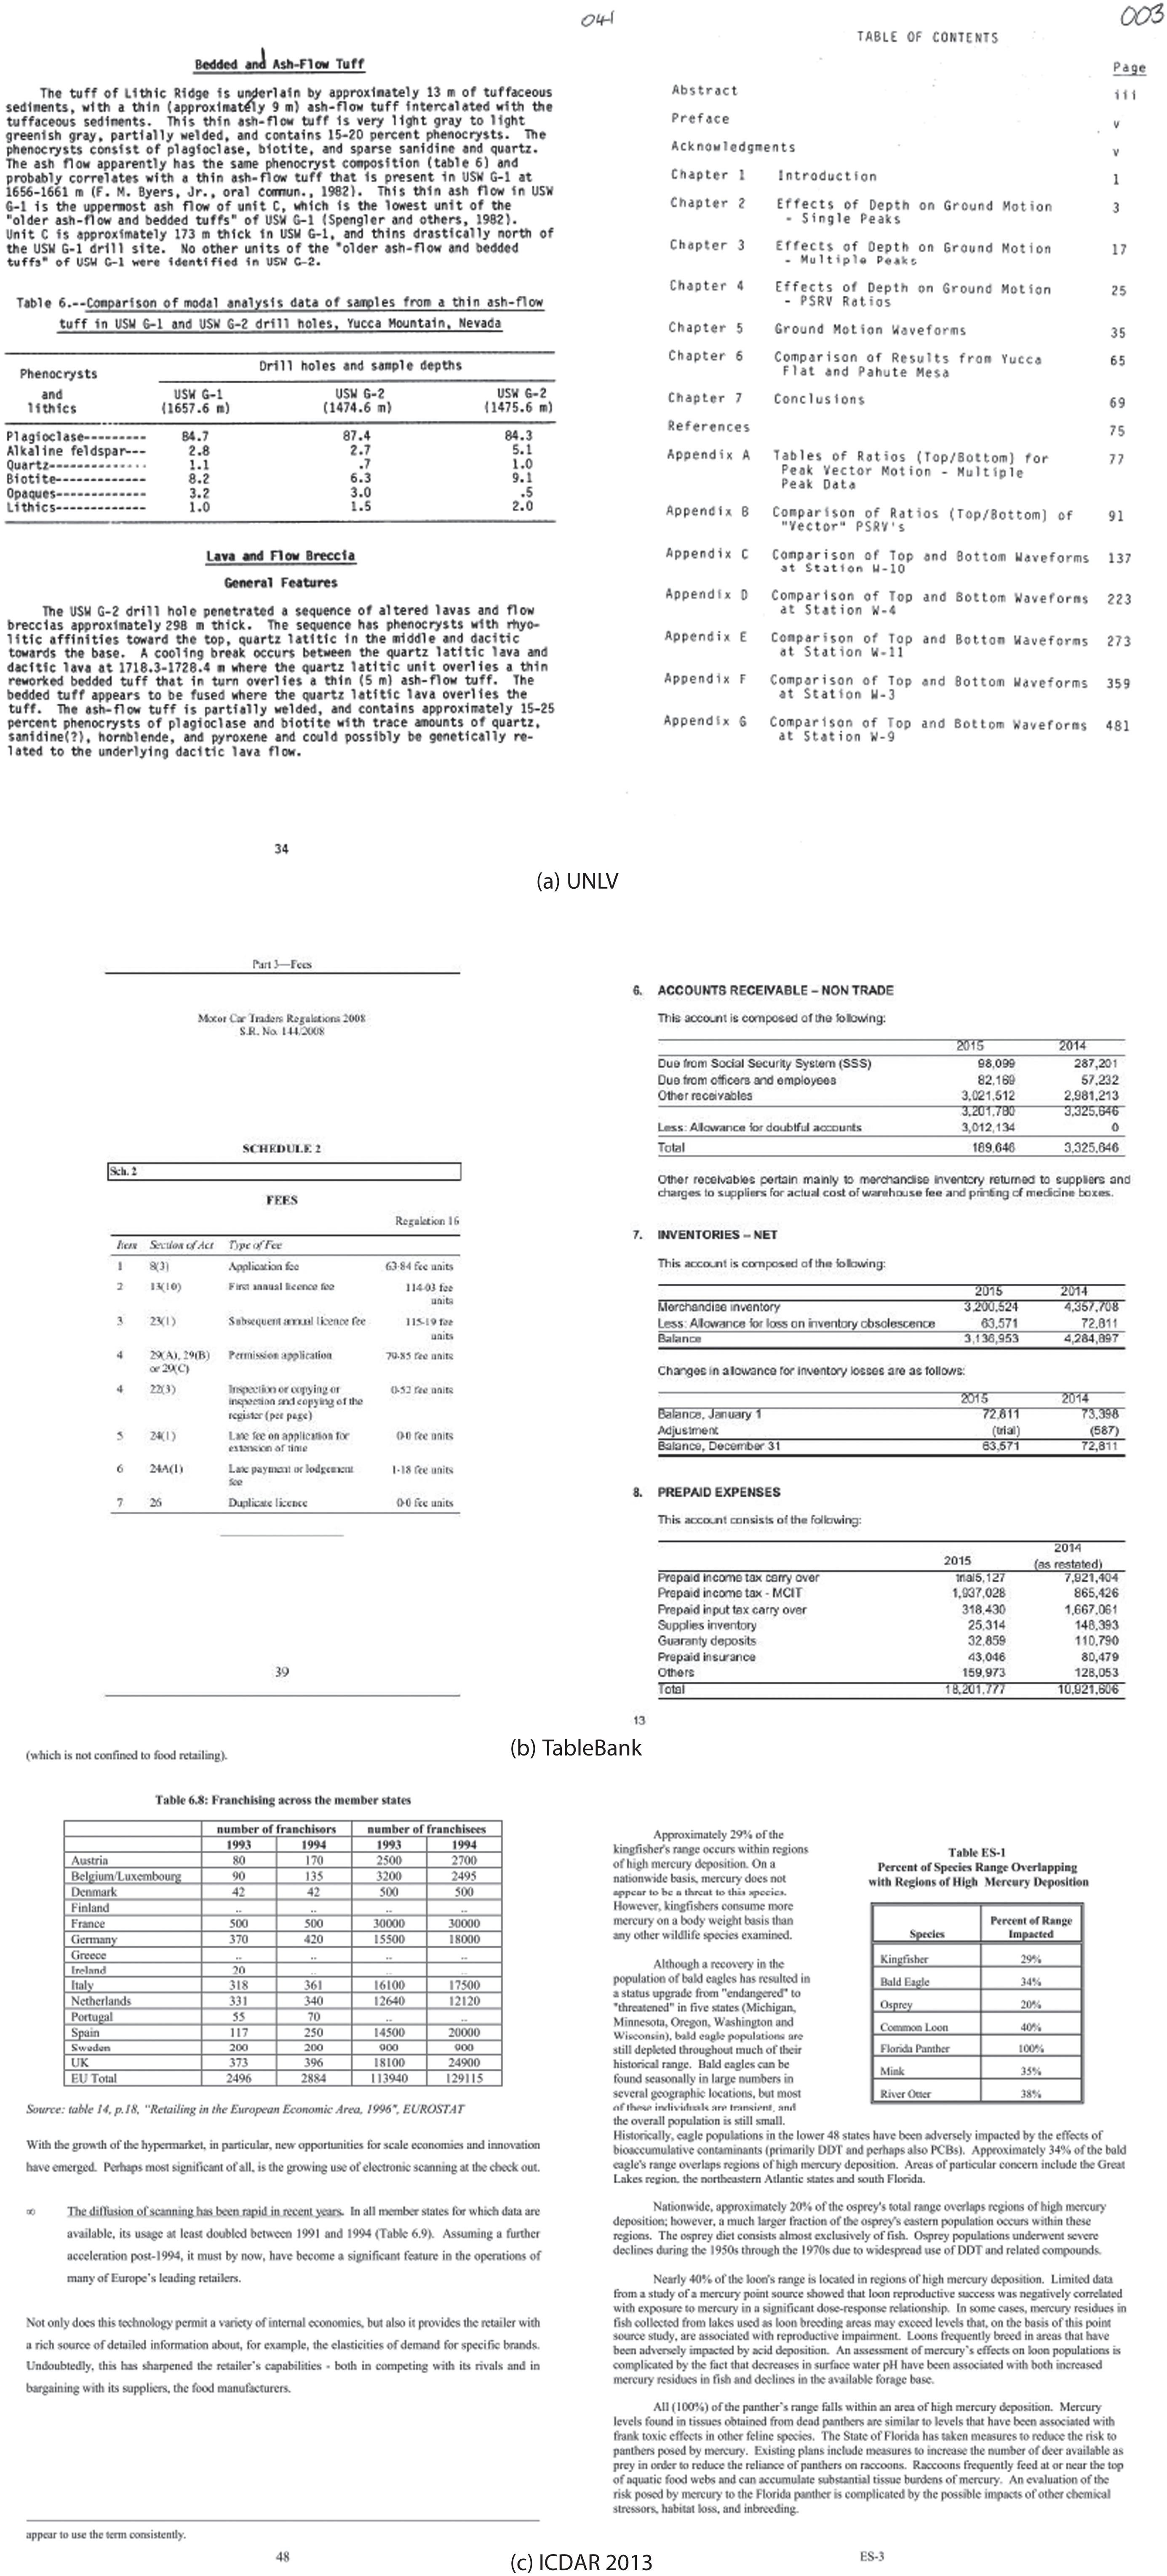
Sample Test Images of dataset used in this work.
Additional pooling layers are included in the more extended input signal to compress the feature map with a particular length. The convolution layers are included in every residual module. For each convolution layer, three layers are involved: dropout, ReLU activation, and batch normalization (BN). By summation with the second convolution layer output, the residual module input is combined by a shortcut connection.
The feature maps are intensified using the merge process, in which the output length is parallel to the input length. The kernel size of 32 is utilized in the initial convolution layer. The size of the kernel is decreased by half through each of the four structures until it is not more than 2. In the ReLU and BN layers, the local features learning part is ended. After that, the feature maps are given as the input of the global features learning part. These review the local features into a global feature vector applicable to structure recognition. Finally, the table structure is recognized efficiently from the document image.
Methodology discussed above is implemented in Python using pnumpy, keras, scipy, math, and OpenCV APIs.
Dataset description
The performance of the proposed DNN-HHOA methodology is tested on UNLV, TableBank, and ICDAR 2013 image datasets. The original UNLV [28] dataset include 2889 pages of CDI collected from various magazines, business letters, technical reports, and newspapers. Out of these CDI ground truth of 427 images is available for analysis. The ICDAR-13 table competition dataset is a public dataset, which is available and utilized for the performance evaluation of the proposed work using two metrics such as precision and accuracy. In table structure recognition and detection, this ICDAR 2013 dataset is the most commonly used significant dataset formed by the documents accessed from email messages and Web pages. In the ICDAR-13 dataset [29], 67 PDF files are comprised, with 238 pages included with 156 tabular structures. From the total images, 60 images are taken for testing, and the remaining 178 images are used for training the model. TableBank [30] is a large CDI dataset containing 163,417 images in Word, 253,817 in LATEX, and 417,234 in Word+LATEX subsets, respectively. In our experiment, we limited our training and test set of images by selecting randomly. We chose 2000 images randomly from the TableBank LATEX and Word dataset for training. Similarly, we have created the randomized test set for both LATEX and Word by choosing 3000 images from TableBank.
Evaluation matrix
In an XML file, the ground truth is represented, and the coordinates of its circumscribing rectangle give the table regions. Let us consider that the bounding box of i th ground-truth is denoted as T i , and the bounding box of the j th detected table is denoted as U j [3]. Then, equation (12) defined the number of areas overlap AO between T i and U j as:
The intersection area is denoted as |T
i
∩ U
j
|. According to the number of AO, the following metrics are evaluated. False positive rate(FP): It is defined as the number of the detected structure of the tables which do not overlap with any ground-truth tables (i.e., AO ≤ 0.1). True positive rate(TP): It is defined as the number of the detected structure of the tables which overlap with any ground-truth tables (i.e., AO ≥ 0.9). False negative rate(FN): It is defined as the number of undetected structures of the tables which exist in the ground-truth tables (i.e., AO ≤ 0.1). True negative rate(TN): It is defined as the number of undetected structure of the tables which does not exist in the ground-truth tables.
Precision, Recall, Accuracy and F1-Score are used to analyze performance of proposed methodology.
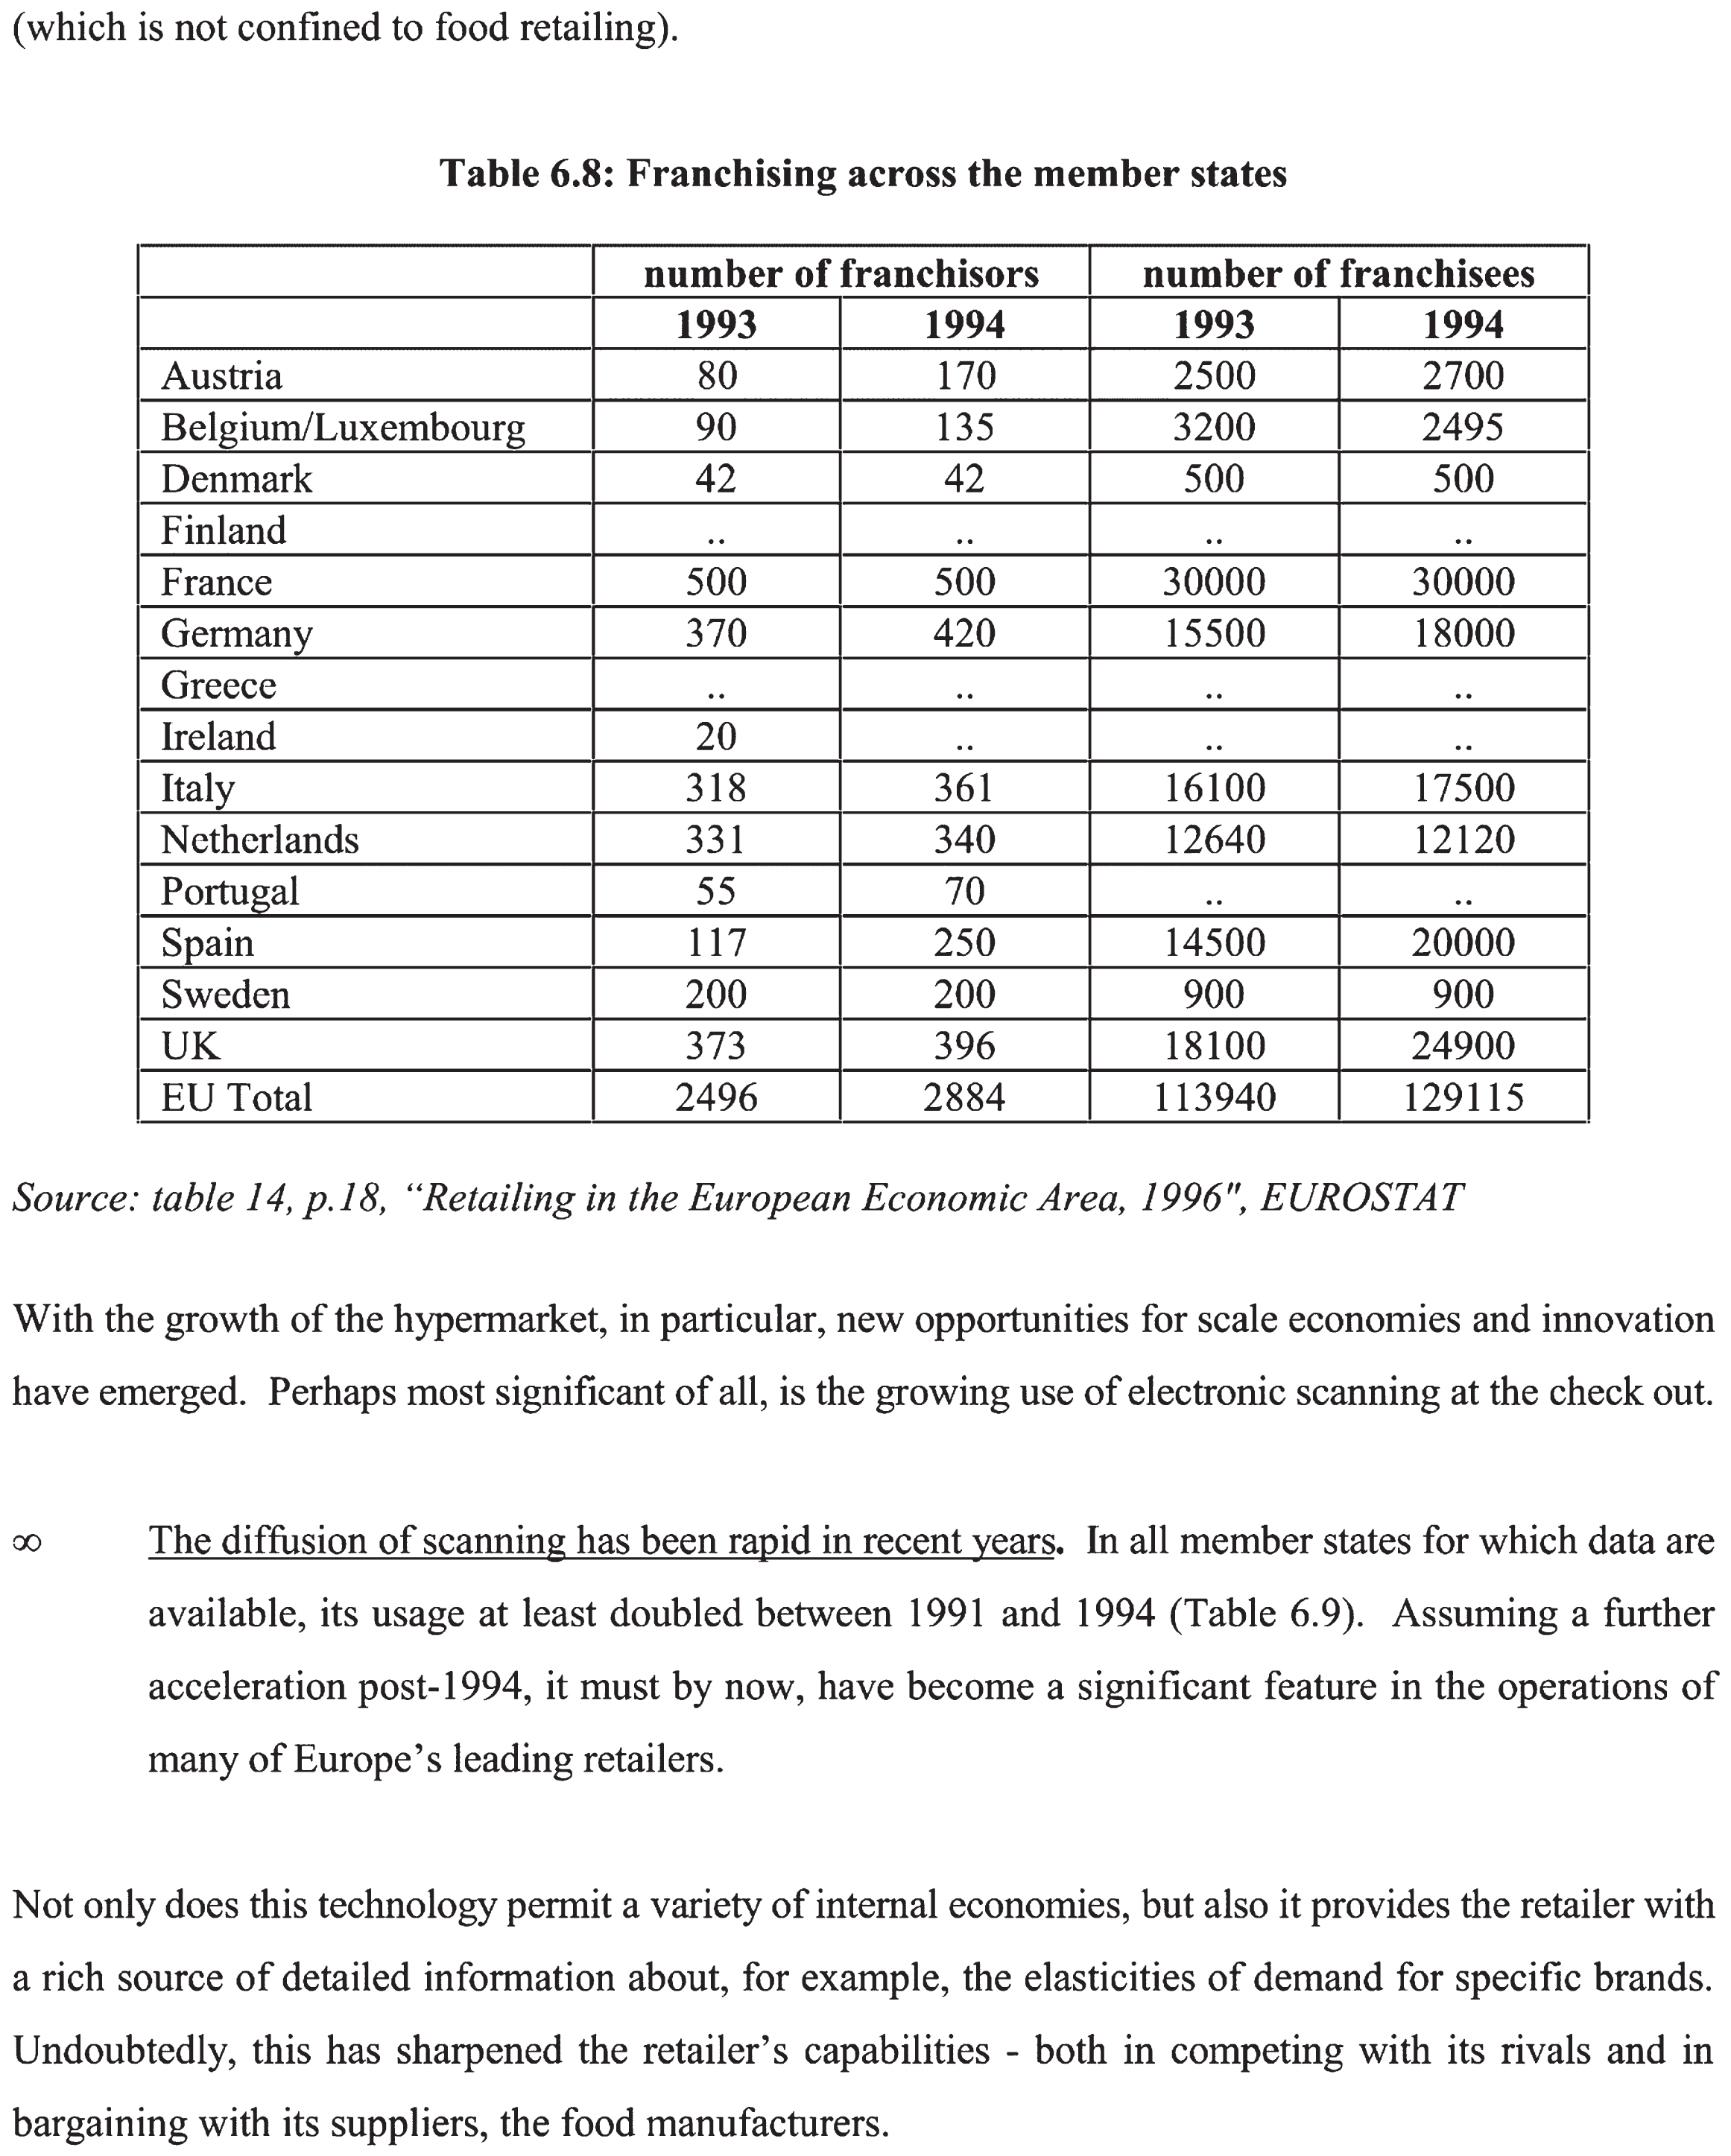
The experiment evaluates the proposed framework’s effectiveness in detecting the table structure from the document images. The individual results obtained in various operations, such as image transformation, table feature extraction (line, cell, row, and column), and structure extraction for table structure recognition, are provided below. These obtained results depict the efficacy of the proposed framework. The blur in the raw input images is removed in the initial stage. Effects of the process are demonstrated using a sample CDI from ICDAR 2013 EU dataset shown in Figure 4.

Input Compound Document Image from ICDAR 2013 dataset.
Resultant image after transformation process.
Figure 5 represents the image obtained from the image transformation process using bilateral filtering. Figure 6 illustrates the image obtained from the binarization process using the IBSA approach. Resultant images are obtained with more brightness, and the uneven illumination from the table images is removed. This process improves the efficiency of the table structure detection strategy.
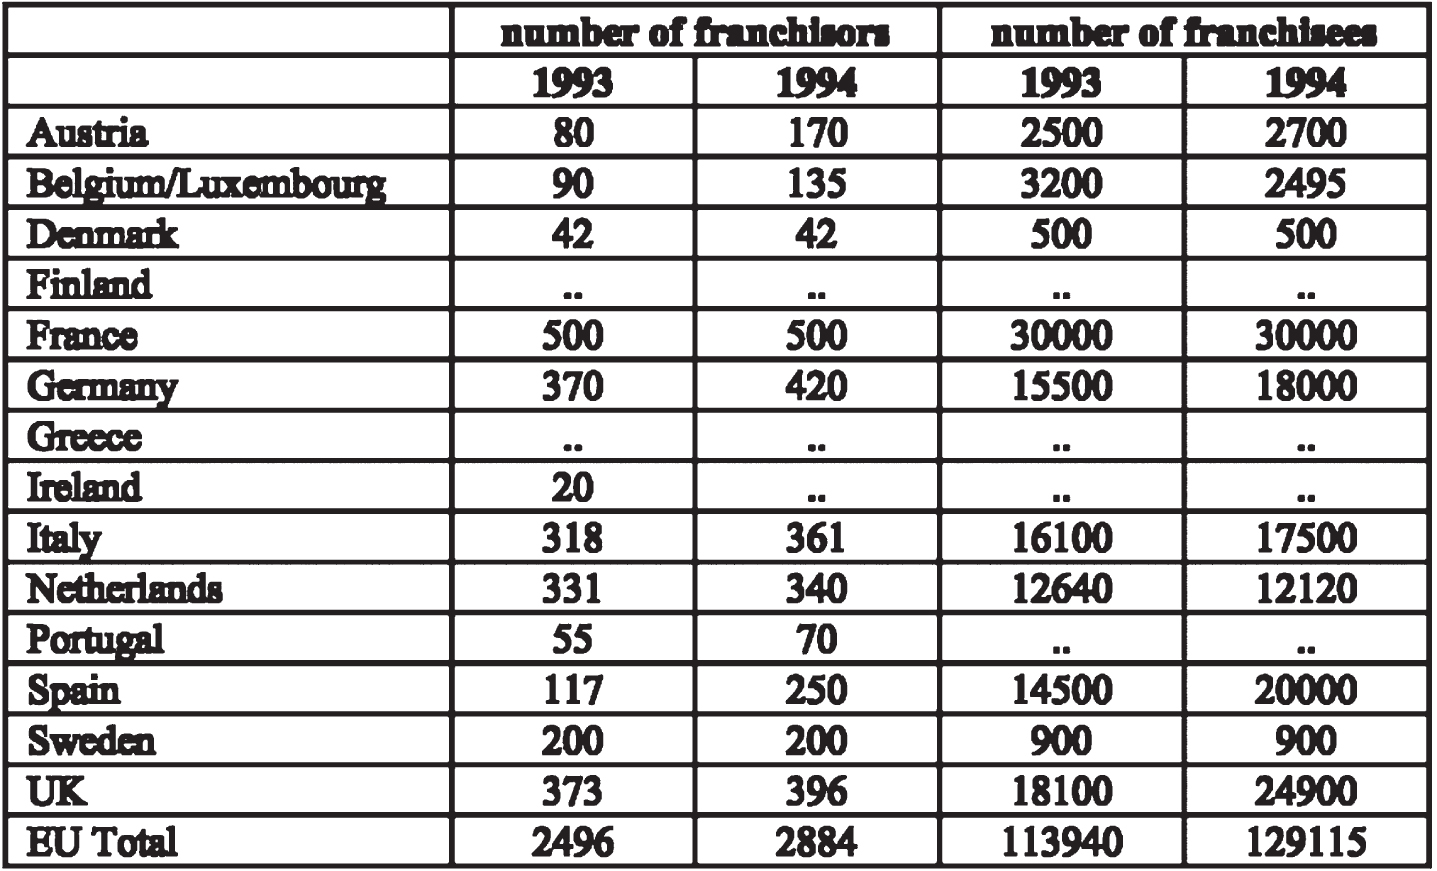
Output obtained after binarization using IBSA process.
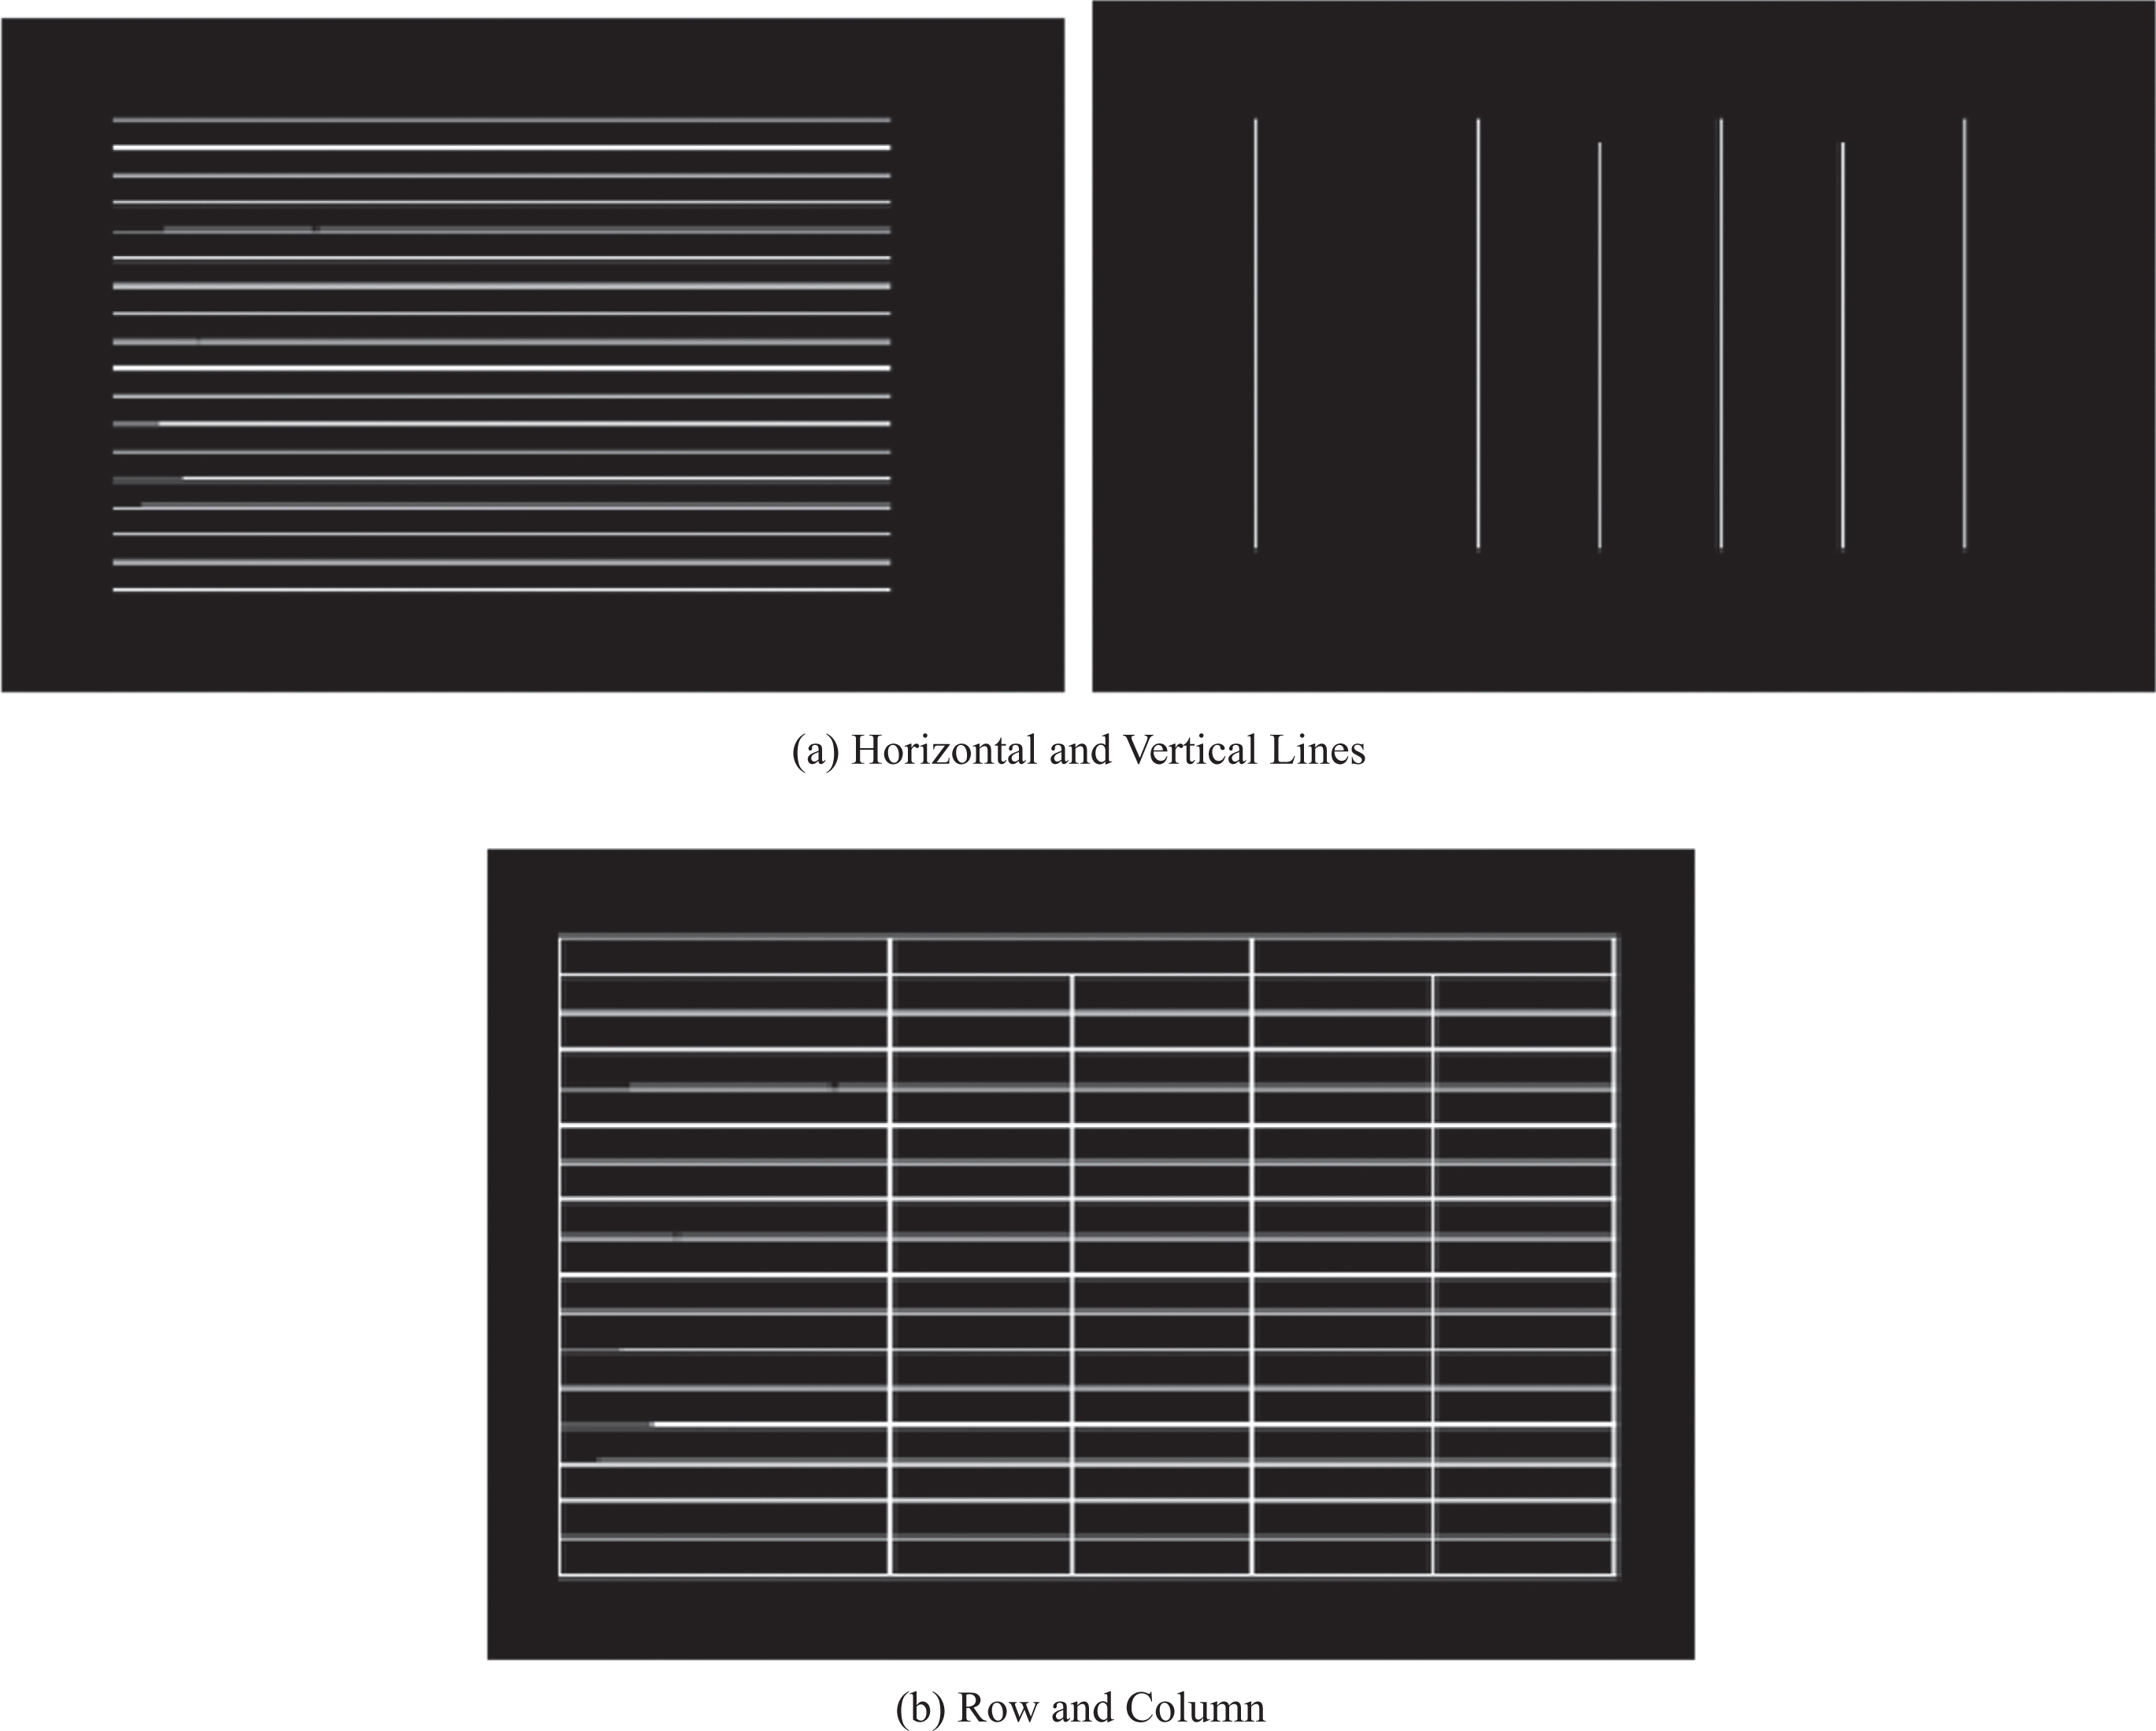
Extraction of table information of Rows and Columns of Figure 4.
Figure 7(a) represents the resultant image obtained from horizontal and vertical line extraction from the table. Based on these extracted horizontal and vertical lines, the row and columns of the table can be obtained from the document images. Figure 7(b) represents the output image after completing the row and column extraction using the masking operation. This row and column extraction represents both horizontal and vertical lines. The rows and columns of the table are obtained from horizontal lines, and the vertical lines are extracted from the line extraction operation. Based on these lines, the table structure can be evaluated more efficiently.
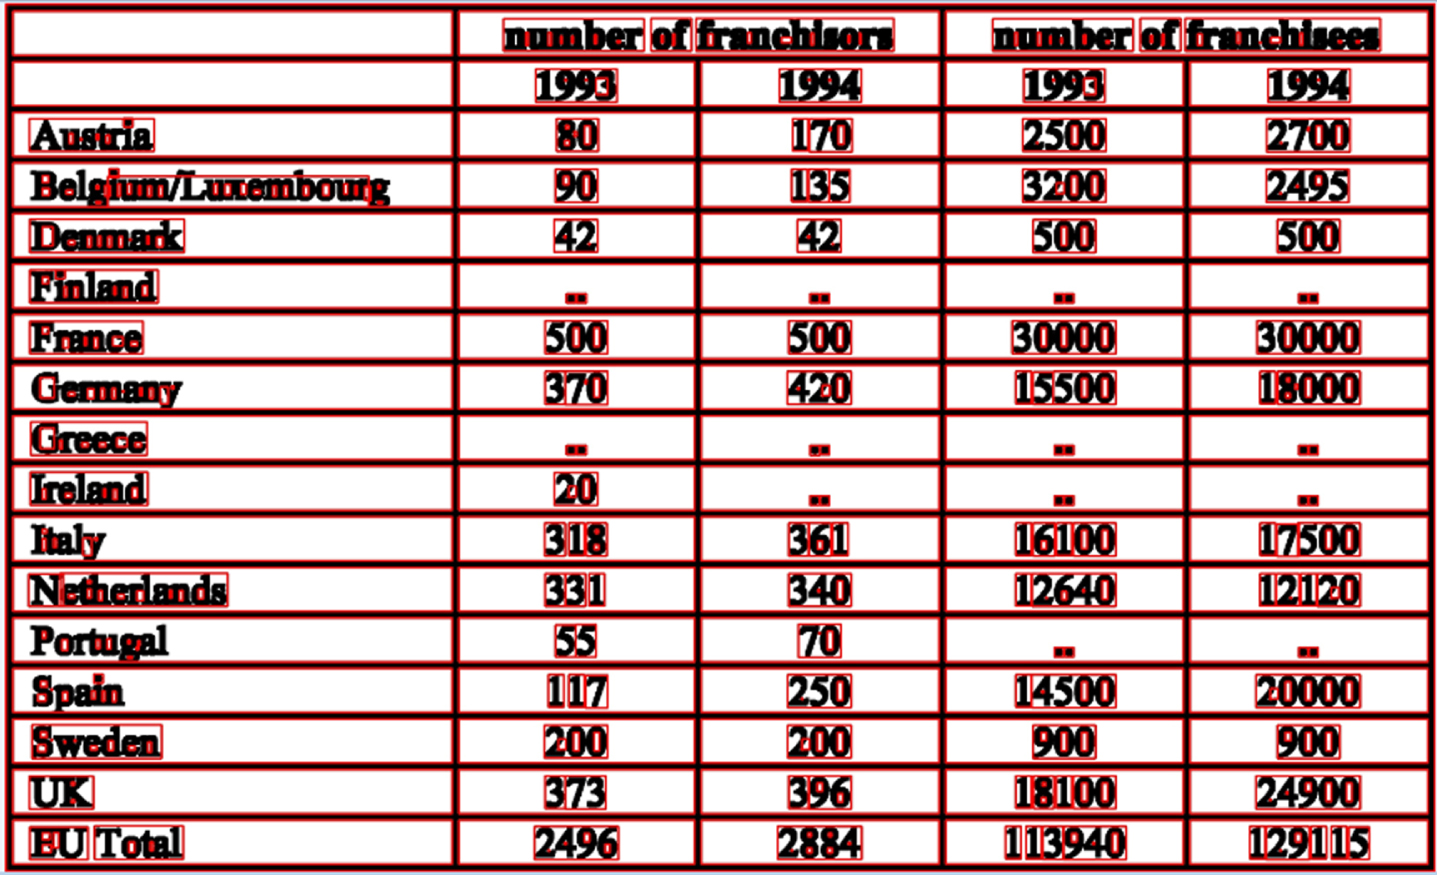
Cell extraction output from the table.
Figure 8 represents the resultant image obtained from the cell extraction from the input images. Based on the extracted features, these cells can be extracted using the BWME approach.
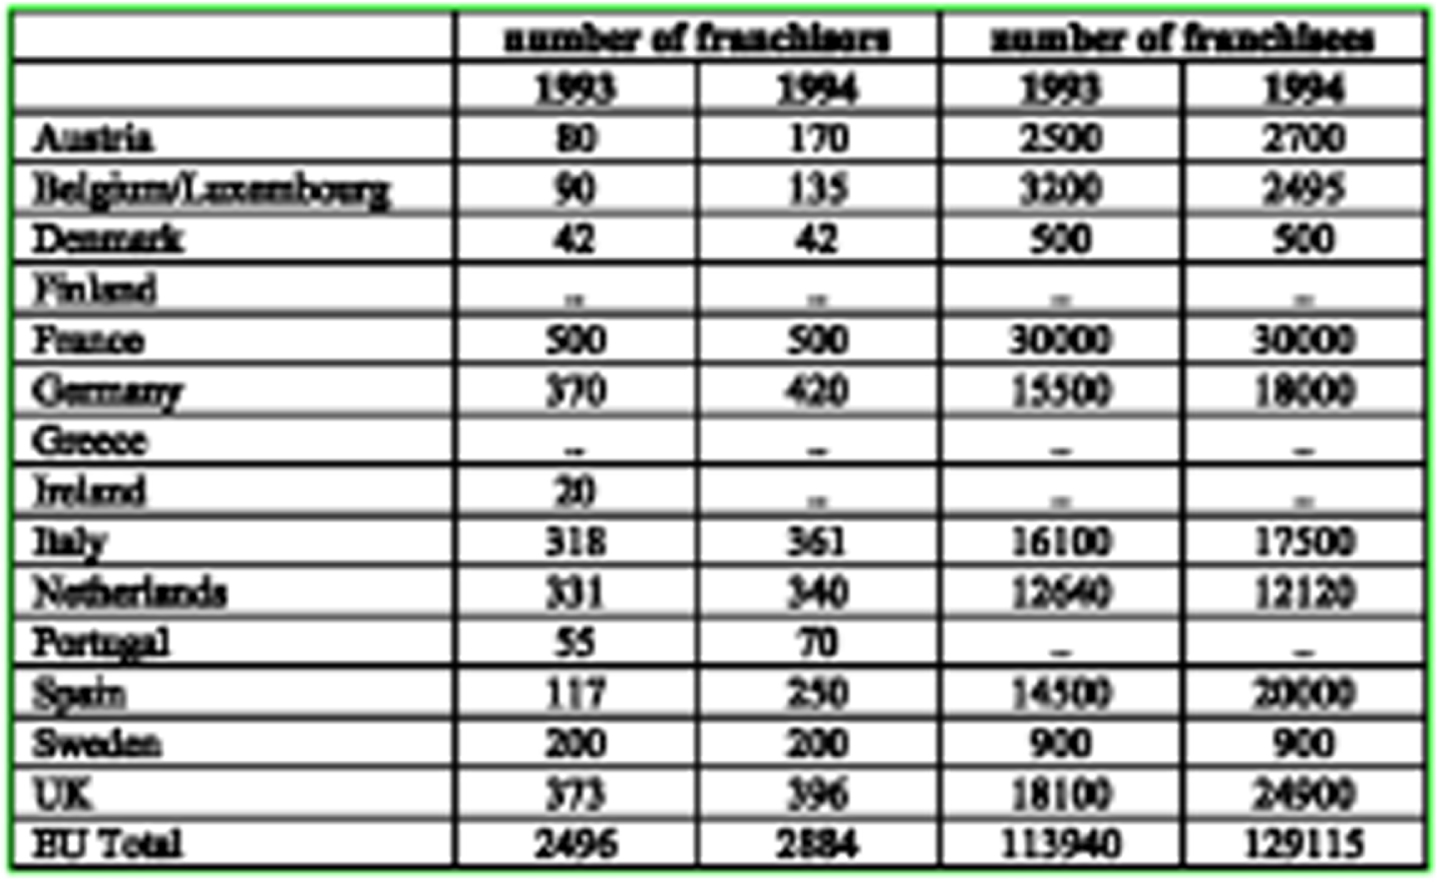
Table structure recognition output using ResNet Attention Model.
Figure 9 represents the resultant image for detecting table structure from the extracted table features. The table structures are extracted from several document images in the dataset based on the location region and the other features obtained from the previous process. Further, the precision and recall value achieved by the proposed framework is provided to show the method’s efficiency.
Python XML module is used for comparing the results of OCR analysis from the ground truth. The performance of the proposed work is analyzed based on the obtained accuracy and precision. The value of precision obtained by the proposed approach is 98.122, and the accuracy obtained by the proposed approach is 98.349.
The proposed framework is compared with some existing approaches, such as Schreiber, S., et al. [17], Paliwal, S.S., et al. [18], and Siddiqui, S.A., et al. [31] in order to prove the effective performance of the proposed technique. The comparison analysis is based on the accuracy of these approaches achieved. Schreiber, S., et al. [17], Paliwal, S.S., et al. [18], and Siddiqui, S.A., et al. [31] has been achieved an accuracy of 91.44, 91.51, and 92.98, respectively.
Table 1 compares the proposed method’s performance with the existing methods regarding accuracy. Schreiber, S., et al. have used Faster R-CNN for the table structure recognition on ICDAR 2013 dataset. The precision and accuracy are computed by finding the scores for each document separately and then calculating the average precision and accuracy. The main disadvantage of Faster R-CNN is that the tables are confused with other graphical features, which appear identical to the tables. Paliwal, S.S., et al. used the TableNet deep learning model for table structure recognition using the ICDAR 2013 dataset for the performance evaluation. After the fine-tuning process, the performance was improved. It computed the performance metrics based on the ground-truth values. However, the computation complexity is high in this deep learning approach.
Result comparison for UNLV dataset
Result comparison for tabular data extraction ICDAR2013 dataset
Accuracy of table structure recognition on ICDAR2013 dataset
Result comparison for Table detection in TableBank dataset
Siddiqui, S.A., et al. [31] have been DeepTabStR, a deformable convolutional neural network technique for table structure recognition. This technique uses the deformable base model and the deformable position-sensitive ROI-pooling layer to extract the table structure. For each document, the performance metrics are evaluated separately. Then, compute the average for precision and accuracy. The ground truth is not considered in this approach. The performance significantly dropped during the cross-testing dataset (ICDAR 13). However, the table structure cannot be recognized effectively as there is confusion in case multi-line rows are prevalent. Also, the accuracy obtained using these techniques is low compared to the proposed approach.
The proposed method uses Residual Network optimized over BWME to recognize table structure. Residual blocks in the ResNet allow the network to learn informative and discriminating features from the input feature vector data. This method also mitigates the vanishing gradient problem, which enables efficient training of deep neural networks and is crucial in complex table structure recognition tasks requiring handling diverse and intricate table layouts with and without skeletons. Therefore, the proposed method obtain better accuracy when compared to the existing approaches. From the comparative analysis, the proposed framework achieved efficient table structure recognition performance.
BWME with ResNet attention model is proposed in this work to recognize tables from the document images. The image transformation is performed initially using a bilateral filtering technique. Then, the IBSA method is designed to remove a low-contrast table from the dataset. Moreover, the table images are enhanced by increasing the brightness to detect the table structure efficiently. The table line, cells, location, row, and column are extracted using the morphological thinning, BWME, and masking approaches. In the final phase, the ResNet attention model is designed to detect table structure from the extracted features of tables (i.e., line, cells, location region, row, and column). The accuracy obtained by the proposed framework for ICDAR-13 dataset is 94.34, and the precision value obtained is 96.62, which shows the proposed architecture’s effectiveness in table structure recognition.